An examination of H2 2018
Anyone who was invested during 2018 cannot have failed to notice that everything was going really very nicely until about September - and then everything fell off a cliff.
Interestingly, NAPS2018 seemed to start to show weakness from about June 2018, but the rest of us caught up later and eventually the stocks which seemed to have the highest momentum seemed to suffer the most.
I commented previously that what seemed to happen was that the factors we usually rely on seemed to lose their ability to discriminate. So with about six months of distance from September 2018 now, I ran a version of my Bayesian analysis to see whether any of the metrics I track were "resilient" in the sense that they did not lose their discriminatory powers in the second half of last year.
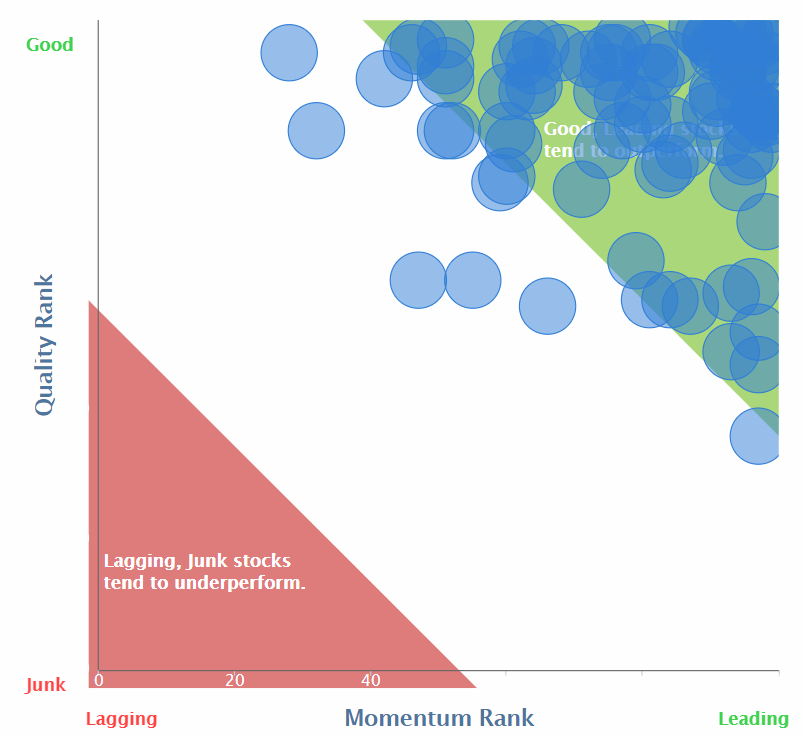
[In the following plots the QVMS ranks at the start of the period are compared with the performance at the end of the period.]
First, here is what the QVMS ranks look like when they are working well:
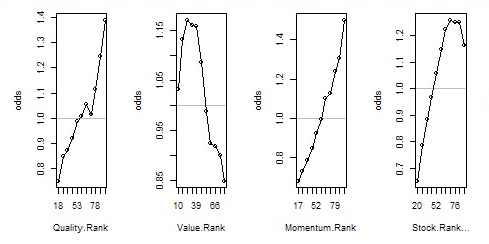
These plots are showing "likelihood" that a particular value of QVMS will result in above average returns. You can think of them as decimal* odds, so a value of 1 is the equivalent of a 50% chance of outperforming the index. [*: thanks to PJ0077 for pointing out that "decimal odds" are defined differently. Here the intended meaning is p/(1-p) where p is the probability.]
Q and M are both quite strong discriminators. Perversely perhaps lower V tends to out-perform higher V because low V tends to be an indication that the market expects better performance in the future. But if you look at the scale on the y-axis you can see that V is a weaker discriminator than QM.
The Stock Rank has a slight droop at higher values. Typically all stocks with a SR >= 80 are roughly as good as each other.
However, look at what happened over the last six months of 2018.
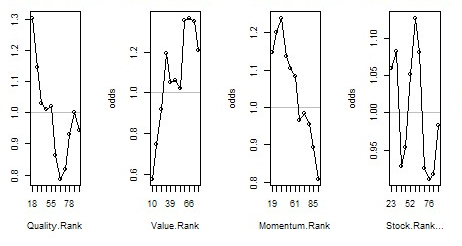
Everything is topsy-turvy. Lower Q and lower M out-performed and high V finally paid off. Even more interesting, V is now a very strong discriminator. On the other hand, SR is really not making much effect. Although it is swinging up and down, the y scale shows that the…