WEBINAR - The NAPS Portfolio at half-time - and how the rules are best adapted to the USA and Europe

We ran a webinar on Thursday evening (watch the replay here) - it's a “half time” review of the NAPS Portfolio - the No-Admin-Portfolio-System I’ve been publishing for the last 11½ years. But the webinar study grew into something more than a mid-year progress update.
Over the last couple of weeks we’ve run one of the largest simulations we’ve ever done on the NAPS portfolio rules: not just for the UK, but across the US and 14 European markets too, using our archive data right back to 2015, after real-world costs - spreads, commission, stamp duty, the lot.
We've taken the core rules, and changed one rule at a time to watch what would happen.
Some of what came back genuinely surprised me. Here’s a quick taster.
Where the NAPS stands at half-time
First, the score (yes it's the World Cup). The NAPS has gained 13.0% so far in 2026 - that’s 10.6% of capital growth plus another 2.4% in ordinary and special dividends. The FTSE All-Share has returned 7.0% over the same stretch. So we’re running at roughly double the index, and dividends are doing real work.

What I find more instructive than the headline is the spread underneath it. Seplat Energy (LON:SEPL) is up 86%, CMC Markets (LON:CMCX) 54%, Gattaca (LON:GATC) 56% - and at the other end, Central Asia Metals (LON:CAML) is down 28%. That range is the whole reason I treat the portfolio as a system. You do not need to pick the winners.
High StockRanks, 20 stocks, sector diversified, in an equal-weighted book - the discipline is letting the basket do its job. This year, with the Hormuz energy shock setting the tone for everything, the diversity has earned its keep yet again.

What surprised me
Now to the half of the study I was excited to talk through on the webinar.
The first big question we get, over and over, is: does this only work because it’s the UK? The honest answer - and I’ve now got the data to back it - is no. The core Quality + Value + Momentum NAPS worked in all the markets we tested, after costs, over 11 years:
- Europe - 17.3% a year
- UK - 16.7% a year
- US - 15.2% a year
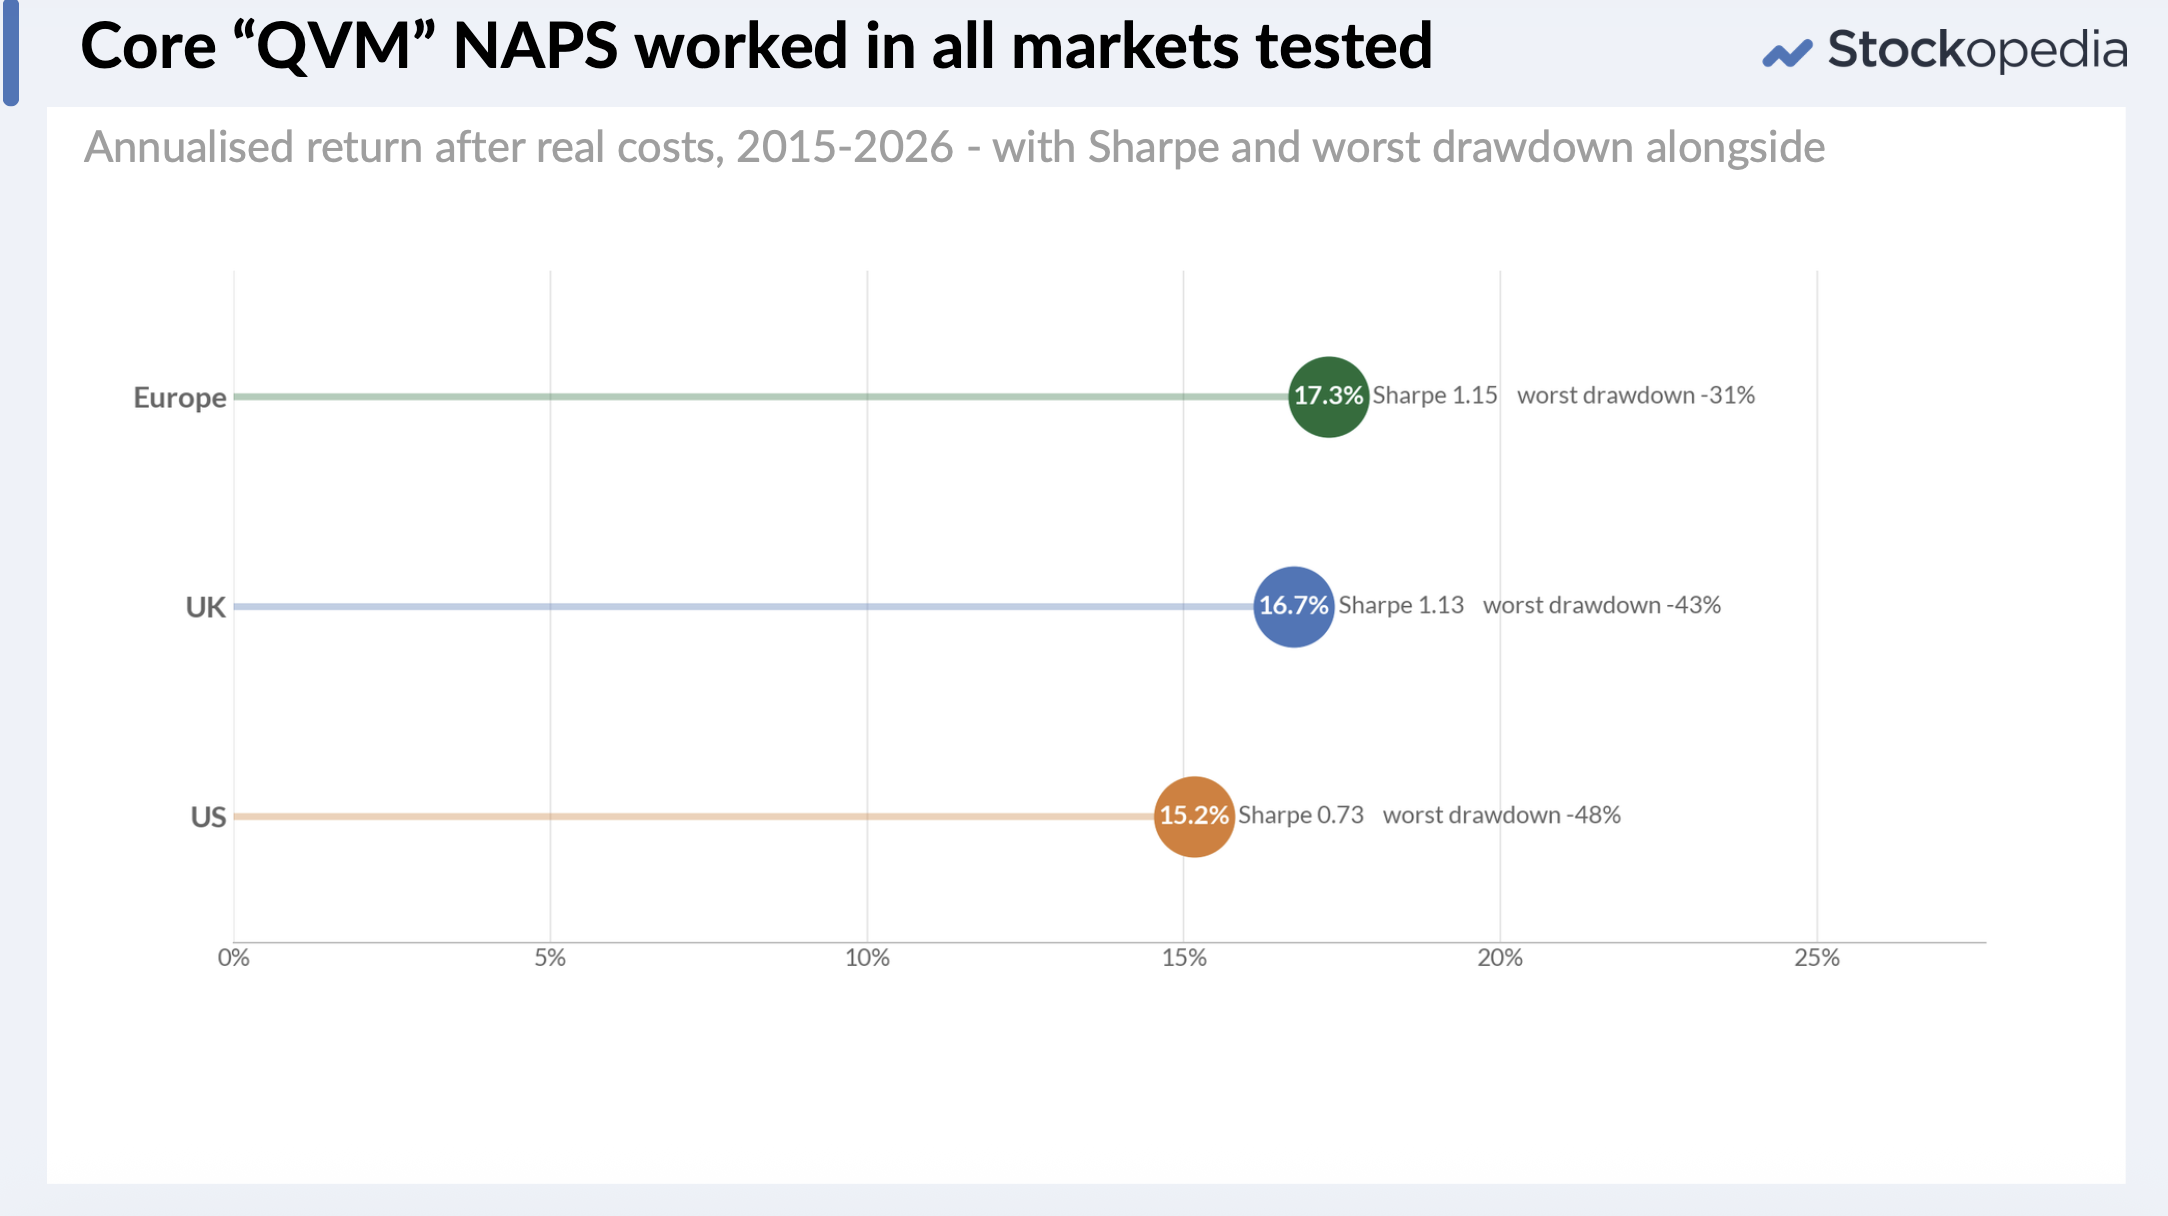
It shows that this is a structural edge, rather than a home-country phenomenon. The same simple, rules-based process puts the odds in your favour in all the markets we point it to.
But it looks like the US underperforms. While that's true with the value-weighted ranks (QVM, VM etc) - the US plays a different game. In the UK and Europe, Value + Momentum and a broad 20-30 stock portfolio win. In America, that approach lags - it's a growth market after all. What wins there is Quality + Momentum (or Growth + Momentum) and a more concentrated 10-15 stock portfolio.
It's the same philosophy, but with different settings. If you’ve ever tried to run a UK-style screen on US stocks and been underwhelmed, this is very likely why.
That’s before we even get to the questions you’ve all asked me for years that I’ve finally tested properly - how many stocks should you really own, do stop-losses help or hurt, how often should you rebalance, and which month is best - all of it is in the deck, all of it is based on evidence, not opinion.
Watch the replay
We were live at 5pm but you can catch up at this link and download the slides.
And whether you made it live or caught the replay, please do discuss in the comments below.
The best part of doing this in public has always been the discussion that follows. I've learned so much from the community feedback. Tell me which insights have changed your mind, how you've been doing with the rules in international markets, and what you'd like me to test next.
Disclaimer
This is not financial advice. Our content is intended to be used and must be used for information and education purposes only. Please read our disclaimer and terms and conditions to understand our obligations.

56 comments
I've been running a "modified NAPS" portfolio since Start of the year. Basically Ed's approach of 2 stocks/sector etc, top SR in each sector. Two major modifications (I know - the second makes it the opposite of a "No Admin" approach but it keeps me very disciplined on what/where to buy).
YTD performance is + 18%, but half of the funds weren't invested until late Jan/Feb so missed on that early pop. Out of interest (with a little help from Uncle GPT), I've just calculated some formal Alpha/Beta and Sharp Ratio stats. 9 Months is a very short period to calculate Sharpe ratio over, but a result of 1.8 is something any Fund manager would be delighted with - lower volatility and higher returns than the benchmark (BTW I'm not taking credit - it's the stockrank system as far as I'm concerned). For the analytical among you - I used the FTSE All-Share total return (inc dividend reinvesting) as benchmark - not just the FTSE 100.
Ed, have you run a Sharpe Ratio calc on the NAPS previously? We all know the high SR's have outperformed, but illustrating it is with lower volatility/risk as well is really powerful.
Ed I wonder if you are able to tell me what the average annualised performance of the NAPS is over the last 10 years.
Hopefully some people are still following this thread....
I tried a NAPs approach for the first time in Jan, split across UK and US markets, 20 stocks total. It's not been great selection so far, though that's by-the-by and of course there will be inter-year variability.
What I'm really interested in is people's views on how many stocks to pick if I'm buying UK, Europe (excl UK) and US. If I recall, the research showed that UK and EP portfolios each needed around 20 stocks for best results, while the US did better with around 10-15.
I can't see anything that looked at what do to if you want to buy from all three markets. What do people think: [A] one portfolio with around 20-25 stocks, split evenly between countries; [B] three separate portfolios UK/EP/US with around 20/20/10; or [C] something in the middle.
Transaction/currency fees are obv going to be much higher in option [B], though they're not *that* high (I'm with II).
Hi Glorenfeld,
An interesting question and similar to thoughts I've had on the subject. FWIW (and I haven't put anything into practice yet), personally, I'd go for one portfolio, loosely 8, 8, 6 or 9, 9, 7 split. And within that, I'd basically try to stick to NAPS rules for diversification, more markets giving more choice to achieve the aims
That said, my US portfolio (not NAPS) is performing far better than my UK shares at the moment. On top of that, there are so many variabilities in the market, that when using a system such as NAPS, IMO, you shouldn't get too bogged down in the details of splits, or even stocks. At the end of the day, something else will outperform. NAPS gives you a more than average chance of outperforming the average. Depending the day you select the shares for the portfolio will impact performance as different shares will be higher/lower in the ranks, etc.
Perhaps the easiest answer is to simply run the NAPS screen across all your chosen geographical areas and then select according to the rules. The split will be what it will be, depending on ranking, feasibly even all UK, EU or US!
Good luck,
Jon
I invest across UK, Europe and US on the NAPS. The only adjustment (because I’d rather include good UK shares) is if a UK company is within 1 it gets preference with the proviso an overseas company with a 100 StockRank always gets priority. >25% up to date this year so very happy so far.
Sorry I missed this comment. I was on hols at the time.
No - there's no SNAPS article this year, mostly because we've been doing a range of other work - including this webinar, lots of "Top Stocks" downloads, this week's "StockRank Jumps" webinar and so on. It's very easy to create your own NAPS list at any time - the rules are all public etc.
Hi Ed, Is there going to be a SNAPs, this year?
I was wondering if I had missed this as well - when is it usually published?
Beginning of July. But the half year review of NAPs was early this year.
Last year's NAPs was only up 8%, the Allshare index was up 15%, at end of June. SNAPs seems to underperform NAPs.
That should have said SNAPs was only up 8%.
Thanks for the reply. I agree - I looked at the Stockrank performance recently too and thought it was very weird... a bit disconcerting in fact. Can someone from Stockopedia help with this? By the way did your NAPS follow the UK methodology? I assume you're aware that Elio ran a NAPS in Australia for a couple of years a couple of years ago?
Thank you Ed and team, very interesting and insightful. On slide 46 you use "Volatility Stops" and during the webinar you mentioned this was worthy of putting a slide together. Your brief description was "half the annual volatility" . Would this be using Average True Range (ATR) or Average Daily Range (ADR) over a 12-month period? Thank you.
Good question - I would also be keen for an explanation on what this is and how it is applied in practical terms in Stockopedia.
Ed, If you want to demonstrate that your NAPS system works you need to compare the results with an equally-weighted index to demonstrate that your 20-30 selected shares perform significantly better than a randomly selected sample. Comparing with a market-cap weighted index, as you have done, is meaningless as the latter is dominated by a small number of huge multinationals. I admire you and know that you are sophisticated enough to understand this and I find it a bit depressing you insist on making these misleading comparisons every six months (despite me having pointed this out to you on previous occasions!) I understand that you have subscriptions to sell but even so.... Could you please rerun the comparison against the FTSE All-share Equally weighted index (which FTSE Russell helpfully compiles).
My first reaction to this System 1.5, is that most people's default alternative these days, is to buy a tracker ... and that's very rarely equal weighted ... so it seems a fair comparison... am I being too kind ?
You are missing the point. The question is whether the NAPS system performs better than randomly selecting 20-30 shares. I don't know the answer but Ed should be telling us instead of comparing apples with pears.
I understand the point, but I couldn't find an equal weight All share tracker to invest in ? Do you know of one please System1.5 ? I totally understand your P.O.V., but without a real world alternative to invest in what's the point of comparing ? No one is going to buy all the stocks individually... many thanks indeed
Has the Russell FTSE outperformed the FTSE Allshare index?
Why not put them on here so we can compare?
l understand the Russell is rebalanced quarterly. NAPs is once a year.
Does anyone have a view on NAPS in Australia? Would QM or QV do better?
I'm wondering the same thing. I've used the NAPS approach based on StockRank for an ASX portfolio over the last 12 months with good results. I'm ready to reset the portfolio and considering using VM this time. It's hard to know, though. Glancing at StockRank performance history, rebalanced annually, gives some weird results:
The bottom ranked perform better recently. This is not a direct comparison. It's including very small microcaps, doesn't exclude large spreads, etc. But still odd. Switching to StockRank still shows a lot of outperformance by mid-ranked stocks over high ranked. You don't see the clear gains from the UK or others markets in ANZ.
Curious if others have found any explanation for this. Maybe the market is just too small?
Thanks for the reply. I agree - I looked at the Stockrank performance recently too and thought it was very weird... a bit disconcerting in fact. Can someone from Stockopedia help with this? By the way did your NAPS follow the UK methodology? I assume you're aware that Elio ran a NAPS in Australia for a couple of years a couple of years ago?
Looks like end of Sept may be a good time to start an ASX NAPS (from Market Index):
I watched the webinar and it was fascinating the number of things you've modelled. Really well done.
My naps adventure is into its 5th year and has managed 16.49% on a unitised number I've been maitaining from the broker records. And that includes a flat part at the start and a period of being underwater! I've varied at times from the "brochure" for a variety of reasons (existing positions mainly) and sometimes had success and sometimes not. I am pretty astonished and many people have this perception that the UK sucks, whereas actually we're the 3rd best producer of "Colts" in the world economy behind only US and China.
I was interested in the portfolio scaling part, and whether as the portfolio size grew whether it would be worth doing 3 or 4 stocks from each sector to offset the position size increase above optimal?
Alastair, that's terrific! I think definitely I should do some work on capacity and more work on market impact - and exploring the trade-off between more positions vs market impact in large portfolios.
I'm quite excited as we've built a new simulation engine. It's a proof of concept and it's for research purposes at the moment, but it's blazing fast and it's answering so many questions like these on our own data (which I trust). I'm very keen to productise this over time - so you can answer these questions yourself !
That sounds fantastic Ed. I think we discussed at some point, some years back that I'd built some simulation engines to test the performance of some ML generated signals. I generally found that drawdowns were less, Sharpe was higher and overall performance was more stable but less stellar as the maximum number of positions grew. However, a key difference was that a lot of the simulations weren't rank based but trigger based (a bit like Roland's portfolio). This meant that the simulation would sometimes sit on quite a bit of cash for a while. I did do some rank based simulations as well that would never sit on cash, but in the backtests I did with the signals and data I had, the performance on the whole wasn't as good.
The signals were fairly correlated with Momentum signals and I found the best holding periods were 7 to 8 months typically (although not drastically different if it was 6 or 12). The simulation did take into account dividends, spread, tax etc. but not really market impact as this was just a personal project where moving the market was rarely a concern.
I've often thought it would be great to be able to run simulations like that on StockRanks. However, I don't have as much time for projects like this myself so being able to do it via the site would be amazing. To be frank though, on the other side, the fact that your no admin systems work so well may take away some of the urgency of looking to optimise further.
Anyway, any content or functionality on these lines is always welcome. Maybe it is just me or maybe there is a subset of your audience who would be interested in some more technical details of how you do all this? I'm not sure how big that group would be but perhaps some more technical content you are comfortable to share at some stage might be of interest to some others?
Anyway, this has become quite a long post, but keep up the great work and excited to see any new developments on this.
Do experienced investors into the NAPS add funds on a regular basis or invest once at the beginning of the year without further funding. I hold my stocks in an ISA. Wondering whether to make monthly contributions or if this will mess with the returns discussed in the Webinar.
There was a slide in the webinar about the better months to invest through the year. There was a slight dip in the centre of the year around June, but I honestly, don't think there's too much difference across months if you are drip feeding and saving regularly into a portfolio.
This is definitely subject to further research - the problem with historic insight like this is that the past has happened - while the future may rhyme, it will never be exactly like the past - so you can end up overfitting your strategy to what's happened, when it might be noise.
The July 23 webinar “The StockRanks Jump Effect: what 5,902 rank jumps reveal about catching re-ratings early” promises to be brilliant. I’m going to start testing it tomorrow with an order for IG Design (LON:IGR). Its quant score also had a bit of a bounce on Yuval Taylor’s weekly The Stock Evaluator spread sheet.
The July 23 webinar “The StockRanks Jump Effect: what 5,902 rank jumps reveal about catching re-ratings early”
I ran a screen on my database and the three qualifying stocks based on weekly jump are:
No
Just beware of errors or glitches in the system. Frontier Developments (LON:FDEV) fell last Tuesday because the mcap was incorrect, when it was corrected on Thursday, the SR shot up.
Yes, its always sensible to check for any event that might cause the jump. These three all have recent results.
Paul Scott has elevated all three of those to green from amber-green within the past month.
Really interesting to have confirmed that US does function a bit differently to the UK.
In terms of stops, I'd be more interested in setting stops based on the original purchase price. I feel like trailing stops don't give the stock as much room to move. Maybe I'm wrong, but I'd only really want to cut out genuine losers, from my standpoint of where I entered the position. I'd interested to see data on that.
I've been so impressed with my returns from NAPS based philosophy. It's only been 18 months for me with a small amount of capital but I'm up over 40% in that timeframe. I'll be allocating more to this as time goes on! Love all the data! Thank you Stockopedia
Great presentation. I was surpised by the large difference in performance depending on when you rebalance. Roughly 12% June vs 23% September for Europe. This seems too large to me at first sight.
I'm left wondering is this would hold going forward or it's just random. If it is a real effect ,I don't understand the mechanism. Even if summer has poorer average returns ("sell in May and go away") how does that translate into better returns over the year if you hold the shares for a full year? Finally, does all this mean the NAPs should rebalance in September, not the start of the year?
Yes the June effect was the standout result for me.
The general idea is that the spring heralds a rise in sap and an increase in confidence about the future. This increases shares prices in general but especially at the riskier end of the market. By the time June comes around a degree of disillusionment has set in. That does not neccesarily mean price falls but if there is bad news then a fall will be amplified. These falls tend to be worse in the riskier end of the market.
Selecting shares in June presumably favours the low risk, i.e. low beta type shares because they have declined less than other companies and have a better momentum rank.
Unfortunately these shares tend to do worse in general over the year. Although they show good value and quality metrics they are probably the worst examples in this category. Likely to be fading workhorses that are losing market share in declining industries like Smith News.
September is the best date to form the portfolio because it is the start of the season which gives the great majority of market returns. Therefore a selection at that time means getting the freshest batch of shares which will do well over the Autumn/ Winter / Spring season. I suspect however that this portfolio does poorly in the May/ June/ July / August months.
P.S. I have written a book on this called the The seven secrets of the stock market.
Spring has been a dodgy time recently. Trumps tariffs were in April? Iran war started end of February. Ukraine War end of February. Covid February/March.
Naps 2026 was down from a peak of around 15%, just before Iran war started and fell back to 1%, now recovered somewhat to about 10%.
Thanks. I've found your book on Amazon and ordered a copy. This definitely deserves more attention - especially as when to rebalane is a very simple tweak to one's rules.
Hope you enjoy it.
Thanks - now ordered.
As the study only has 11 data points (i.e. 11 yrs), I don't think this is enough data to prove any non-randomness in the selection of start months. My understanding is that statistically we'd need at least 33 data points (i.e 33 yrs) to start to be able to see any non random behaviour emerge. You could argue that with 3 markets there are 33 data points but they would be correlated so not independent data points. I hadn't really thought about how seasonality may affect the selection process before so it's interesting work and comments.
I listened with interest to the webinar. I was introduced to NAPS and to Stockopedia at MELLO 2025 in Chiswick and I have used Stockopedia since then and tried out NAPS for 2026.
Because I aggressively sell and reinvest when stocks fall towards 20% loss, I now hold of 2026. NAPS only BP (LON:BP.) , CMC Markets (LON:CMCX) , Gattaca (LON:GATC) , GSK (LON:GSK, Ramsdens Holdings (LON:RFX), Seplat Energy (LON:SEPL), Serabi Gold (LON:SRB) , Vodafone (LON:VOD), Yu (LON:YU.). The proceeds of sale were reinvested elsewhere, My gain to date on NAPS inclusive of losses on sold stocks is 18.4%.
Your gains shown for several NAPS shares are outdated: SEPL (yours is 86%, ours since 2/1/2026 is 63.5%P, for CMCX (54% vs. 49.5%) for GATC (56% vs. 36.0% but we held some GATC shares already, those are up 8/8/2025, those are up 44.2%). The three stocks fell recently.
I have based our investment strategy on quant for several years, indeed since the recovery from the 2020 drawdowns when much of our assets were in a leading UK fund, and a US pension was similarly in ETFs or funds. Since then I have been a follower of Steve Cress whom you must know well. He stresses momentum, per Narasimhan Jegadeesh and Sheridan Titman in "Returns to Buying Winners and Selling Losers: Implications for Stock Market Efficiency", Journal of Finance (1993). Cress’s flagship quant data, opened to subscribers 1 July 2022, claims total return through today of 428.91% vs S&P 500 97.80%.
I measure our success by increment to securities investment wealth, and my statistics ignore dividends (which are anyway reinvested), additional inputs (£20k for an ISA, £9k for a JISA, £10k for a SIPP and £3.6k for a JSIPP). Since 23/5/2024 when I began recording daily totals, we are up 123.87% (“additional inputs” account for only a few percentage points). Since 2/1/2026 we are up 31.40% and over the last 365 days we are up 50.31%.
In other words NAPS is a fantastic program for those who don’t want to trade actively or use Stockopedia (and other) data aggressively, and compare their return to EFTs and funds. Of course there will be drawdowns: that happened to us in 2008 and in 2020. But we remain 100% invested and never withdraw any funds from our portfolios. We have other investment in property. (It did well from 1977 to 2010 and has lost 30% in dollar terms, stayed flat in GBP, since then. But it pays rent.)
FWIW few of our multibaggers (Bird Construction (TSE:BDT) , Rolls-Royce Holdings (LON:RR.) , NVIDIA (NSQ:NVDA) , Berkshire Hathaway (NYQ:BRK.B) …) score well with anyone’s quant. And even near-perfect quant scores on multiple sites can demand patience. Poland is the new motor of Europe and many Polish stocks get high ratings: Seko SA (WAR:SEK) has a 100 StockRank; Orlen SA (WAR:PKN) (bought by us on 29/7/2025 and up 47.1% has a SR of 99. Stockopedia is great for finding such stocks; whether I’d want to use a NAPS envelope for setting up a European portfolio is a different issue. We moved into European stocks (we hold 29 UK stocks, 28 European and 57 US ones) in anticipation of a fall in the dollar under the Trump Administration. UK and European mid- and small-caps had been underpriced. ETFs and hedge funds are discovering that now and cross-border investment has to be flexible.
Finally: Cress’s “picks” have become less reliable lately for two reasons: (1) the US market is inflated and (2) his subscribership has risen from 5,000 to 35,000 so the mere fact of being picked will cause a rise in the price of all but large-cap stocks. With 10,000 subscribers for Stockopedia and under a thousand, I assume, for NAPS that isn’t an issue. But just as for some of us there is a game of disposing quickly of likely losing stocks in NAPS, there is a game – discussed in online forums – of trying to predict the next bimonthly Cress pick and benefit from any bounce.
This was a fascinating webinar. I was particularly interested in the analysis of the different behaviours of the UK and US markets.
I have just one small disagreement with what was said - it was recommended that if you trigger a stop loss you should buy the next highest ranking stock in the same sector. But imagine a situation such as we have just seen where the Strait of Hormuz reopens. All of the oil stocks are going to go down. Why not buy the next highest ranking stock looking across all of the sectors? Maybe another sector will have started to outperform across the board.
presumably its for necessary diversification - eg if you have zero oil and 2 * "housebuilders" then you are more exposed to that sector. so it makes sense to me to keep rigid sector diversification ?
So you would rather repurchase in a sector in which all of the stocks are going down than in one in which stocks are rising?
It was very much a "NAPS" set of tests... so the portfolio construction had to stay true to the sector selection rules. That's why it picked from the same sector.
The benefit of a sector cap is that there can be some market periods where the highest-ranked shares are very skewed to certain sectors. For example, especially with value and momentum, you might find that you end up with a portfolio with ten financials or energy stocks in it.
A lot of value managers blew up in the financial crisis because of exactly this.
There's more to be analysed about the value (or not) of sector diversification - but here are some preliminary pointers....
So in essence -> 2 per sector gives you the best risk / reward ... but expanding the cap to 4 is completely reasonable.
Does adding Growth Rank back to QM work for the US - i.e. GQM score?
The thing I picked up on from your NAPS portfolio is that the 4 leading stocks all had a low 6 month R squared value at the time of purchase. If you had overlooked these in favour of slightly lower ranked stocks from the same sector but showing greater trend clarity- as I did when setting up a mock NAPS portfolio at around the same time- then the portfolio would have underperformed the market to date. As such the existing NAPS portfolio selection criteria seems to add another element of diversification- it allows the selection of stocks that are currently on the move, and stocks that are yet to move.
Fascinating presentation, the returns look great; normal UK NAPS >15% and with tweaks nearly 22%! Well done Ed. But at -43% DD yikes. Not sure I could stomach that!
Yes - that's the trade-off. If you are aiming for strong returns, there is a flip side. Some think the outsize payoff earned by factors like Value and Momentum is due to a perception of "bad times" risk. i.e. it's the risk of bad times (like value stocks being out of favour for a very long time or momentum "crashes") that actually earns you the extra rewards. It's like an insurance premium - but insurers every now and then have to pay out.
You can manage the drawdowns - through market timing - e.g. staying full invested in uptrends, but not re-entering when stops are hit in downtrends.
Your best UK system with a market regime/timing filter, now that would be an interesting backtest to run sometime. As someone who is retired DD is as important a metric as CAGR to me.
Are the total returns figures on an arithmetic or geometric basis?
Total returns are reported on a geometric (compounded) basis.
Thanks Ed, that was a really fascinating webinar. Obviously in these studies there is always more that you could look at, but I'm wondering if you looked at scenarios where NAPS ran across all 3 regions? To cover the 10 main industry sectors and the 3 regions, in a sense it might make more sense to have 10 in each region, 1 in each sector for a total of 30 stocks. I know that is slightly higher than you are advocating as the sweet spot for the number of stocks. But I wonder if this would improve the Sharpe ratio and potentially make the drawdowns slightly less bad. Also holding more stocks I wonder if that could reduce market impact in a way that offsets any disadvantages?
Anyway, I continue to recommend Stockopedia to friends when conversations turn in the direction of markets. Keep up the great work!
I was actually planning on doing exactly what you've said and look at a 30 stock NAPS portfolio with 10 in the US, 10 in the UK, and 10 in Europe. It needed us to adapt our simulation engine so that we could merge in all of the regions into a single data store - and we ran out of time.
At the moment, our data store splits these across three main time zones: America, Europe, and Asia. There's a bit of data work to do to be able to do it, but we're planning on trying to do it in the next few weeks, so I will circle back.
Thanks Ed. I'll look out for that. I'm very familiar with the reality that ideas can sometimes move quicker than the data architecture and engineering needed to support them. I expect it will be very interesting to see cross-region performance.
"People don't need extraordinary insight or intelligence. What they need most is the character to adopt simple rules and stick to them." - Benjamin Graham - The Intelligent Investor
Amen to that brother!