Investors hunting for income from stocks should pay attention to the frequency, consistency and growth of company dividends - all of which can be found in the dividends tab of each company’s StockReport. Using this information –alongside profitability figures which show how well covered and reliable a company’s dividend is– investors can decide whether a stock fits their investment strategy and is a positive contributor to their portfolio.
With that in mind, we wanted to let you know about some recent improvements to our dividend tool, following feedback from the community.
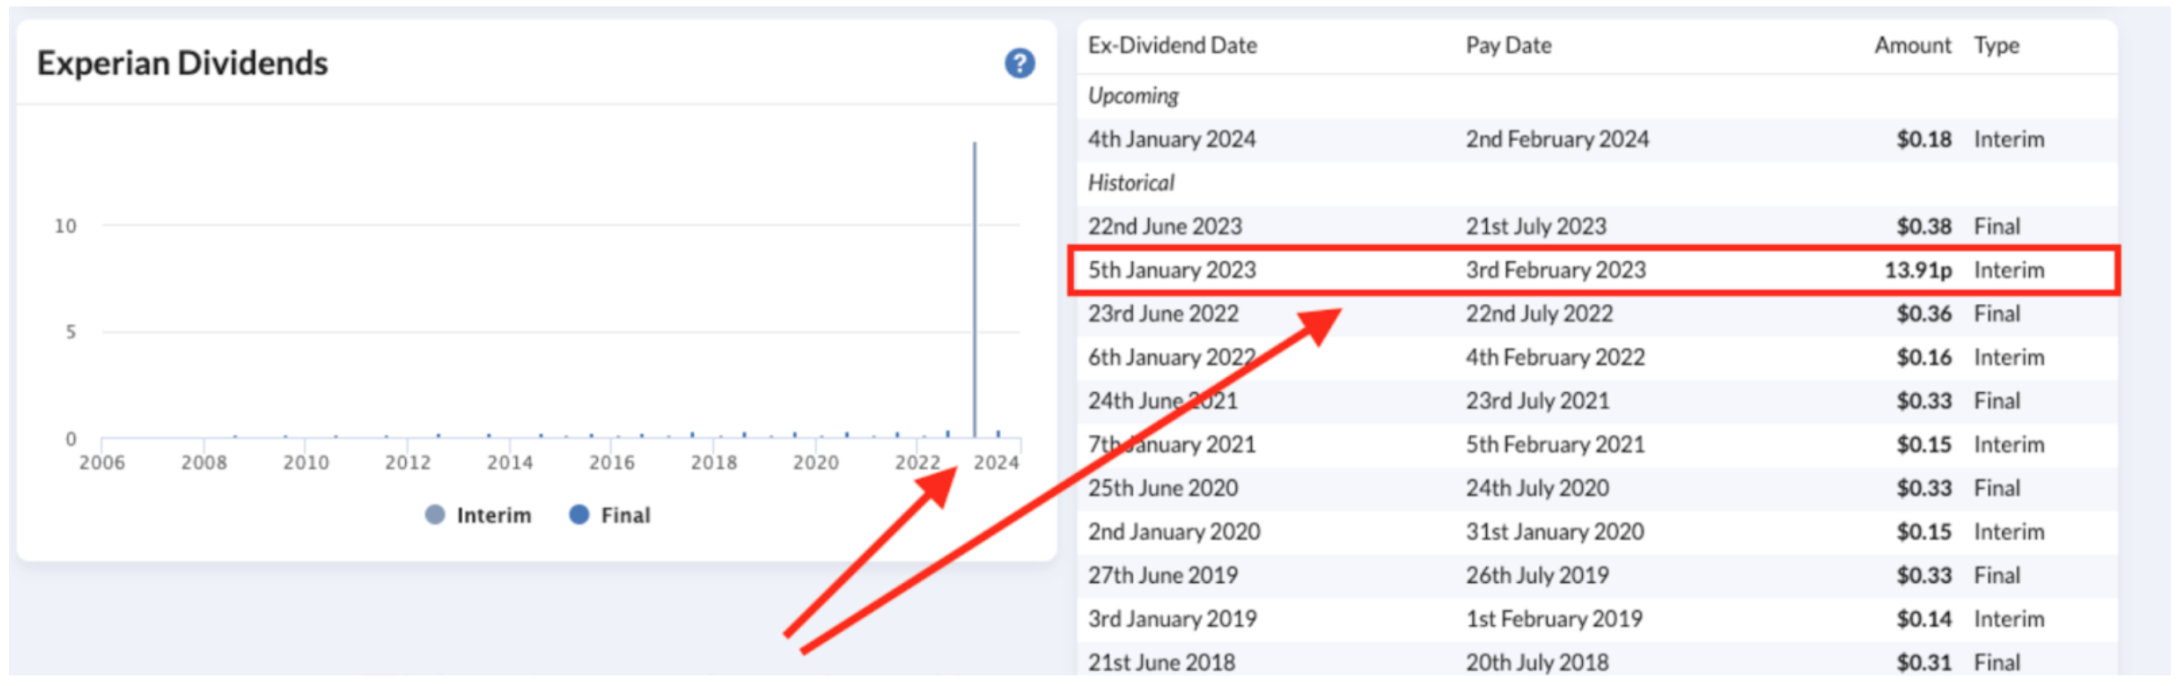
You asked to make it easier to read the bar charts
“The bar charts display varying currencies, showing dollars for certain payments and sterling for others. This inconsistency distorts the chart.”
Let’s take a look at Experian (LON:EXPN). The company typically pays dividends in US dollars, but occasionally pays them in UK sterling. Previously, this caused problems on the chart. The sterling amount was expressed in the pence minor unit (13.91p) whereas the dollar amount was expressed in the major unit ($0.18). The chart tool assumed both values to be in the same currency and this distorted the display. Notice how the pence value was unrealistically big...
We answered
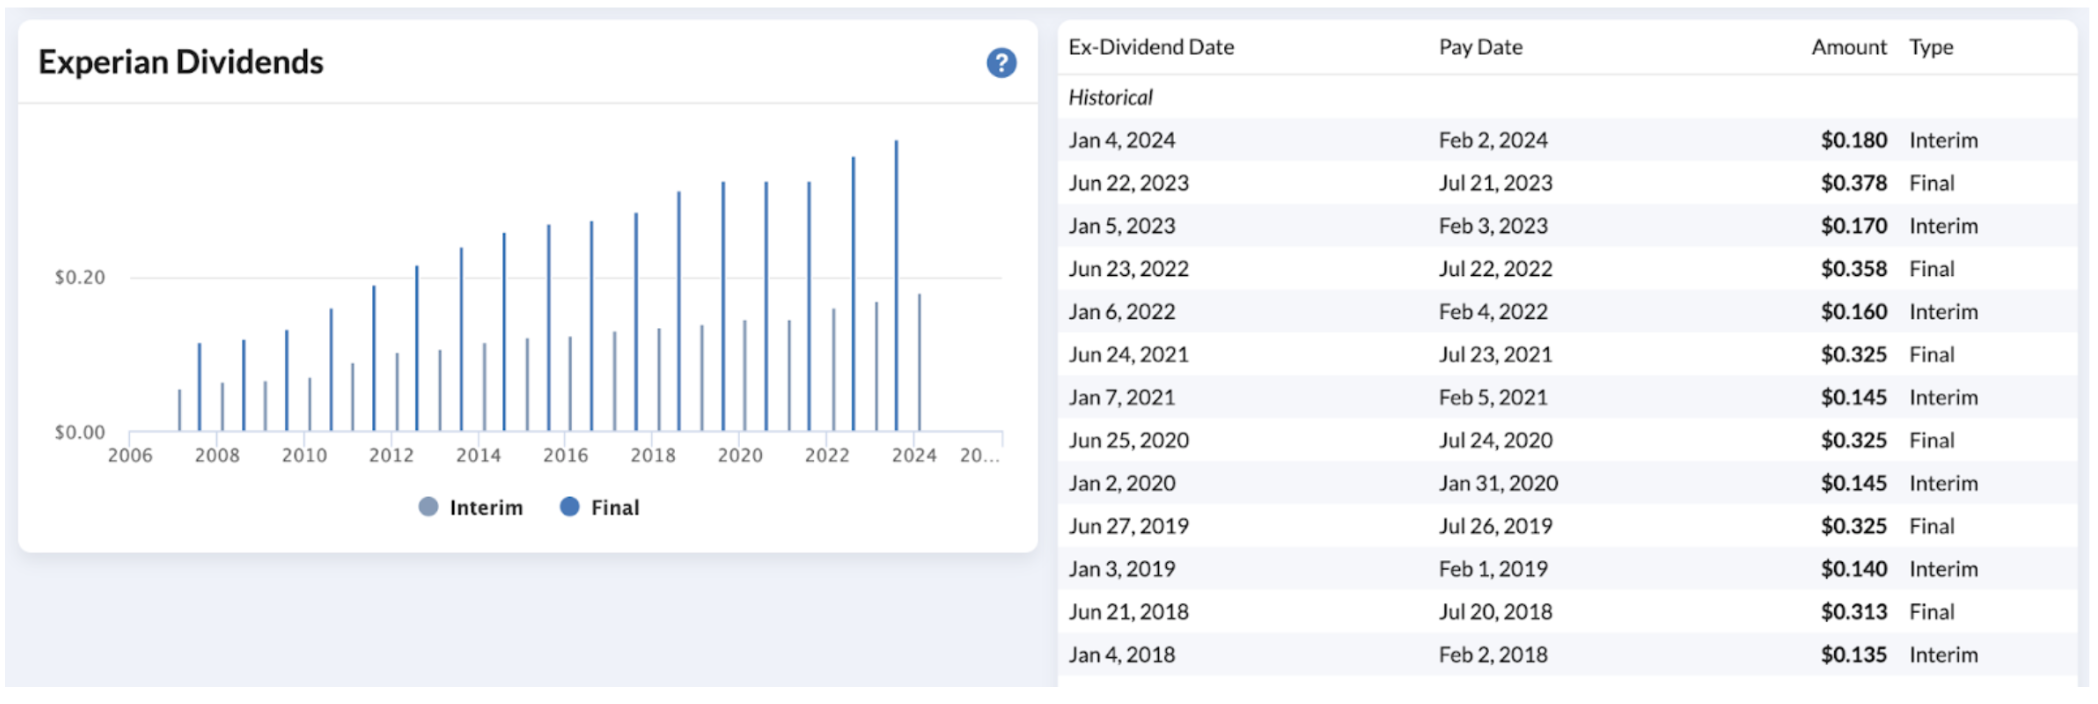
We now display the dividends in one consistent currency - i.e. the modal currency. If a company usually pays dividends in dollars, but occasionally pays them in sterling, then the chart will plot all values in dollars.
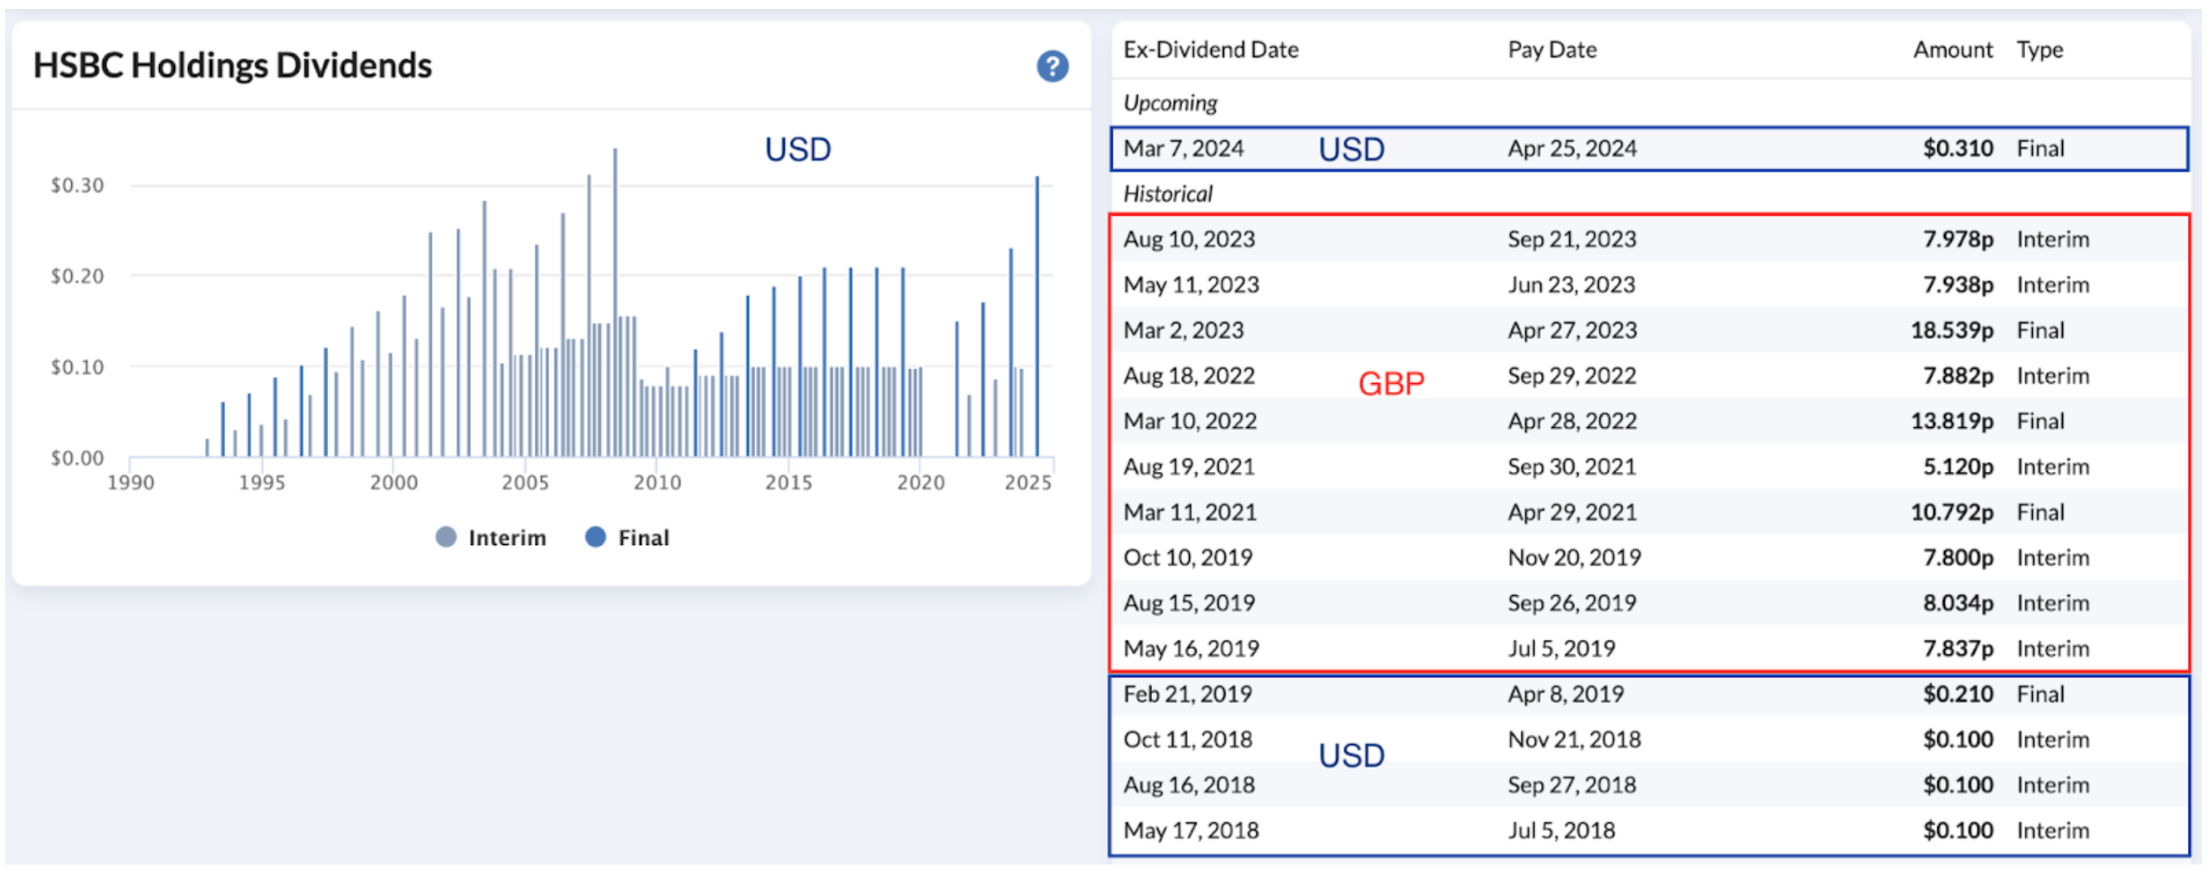
It’s also worth taking a look at HSBC (LON:HSBA), which reports dividends in three currencies, UK sterling, US dollar and Hong Kong dollar. Our table displays a mix of sterling and dollar, but the chart normalises all dividends to the same currency, for ease of comparison.
How to use this information
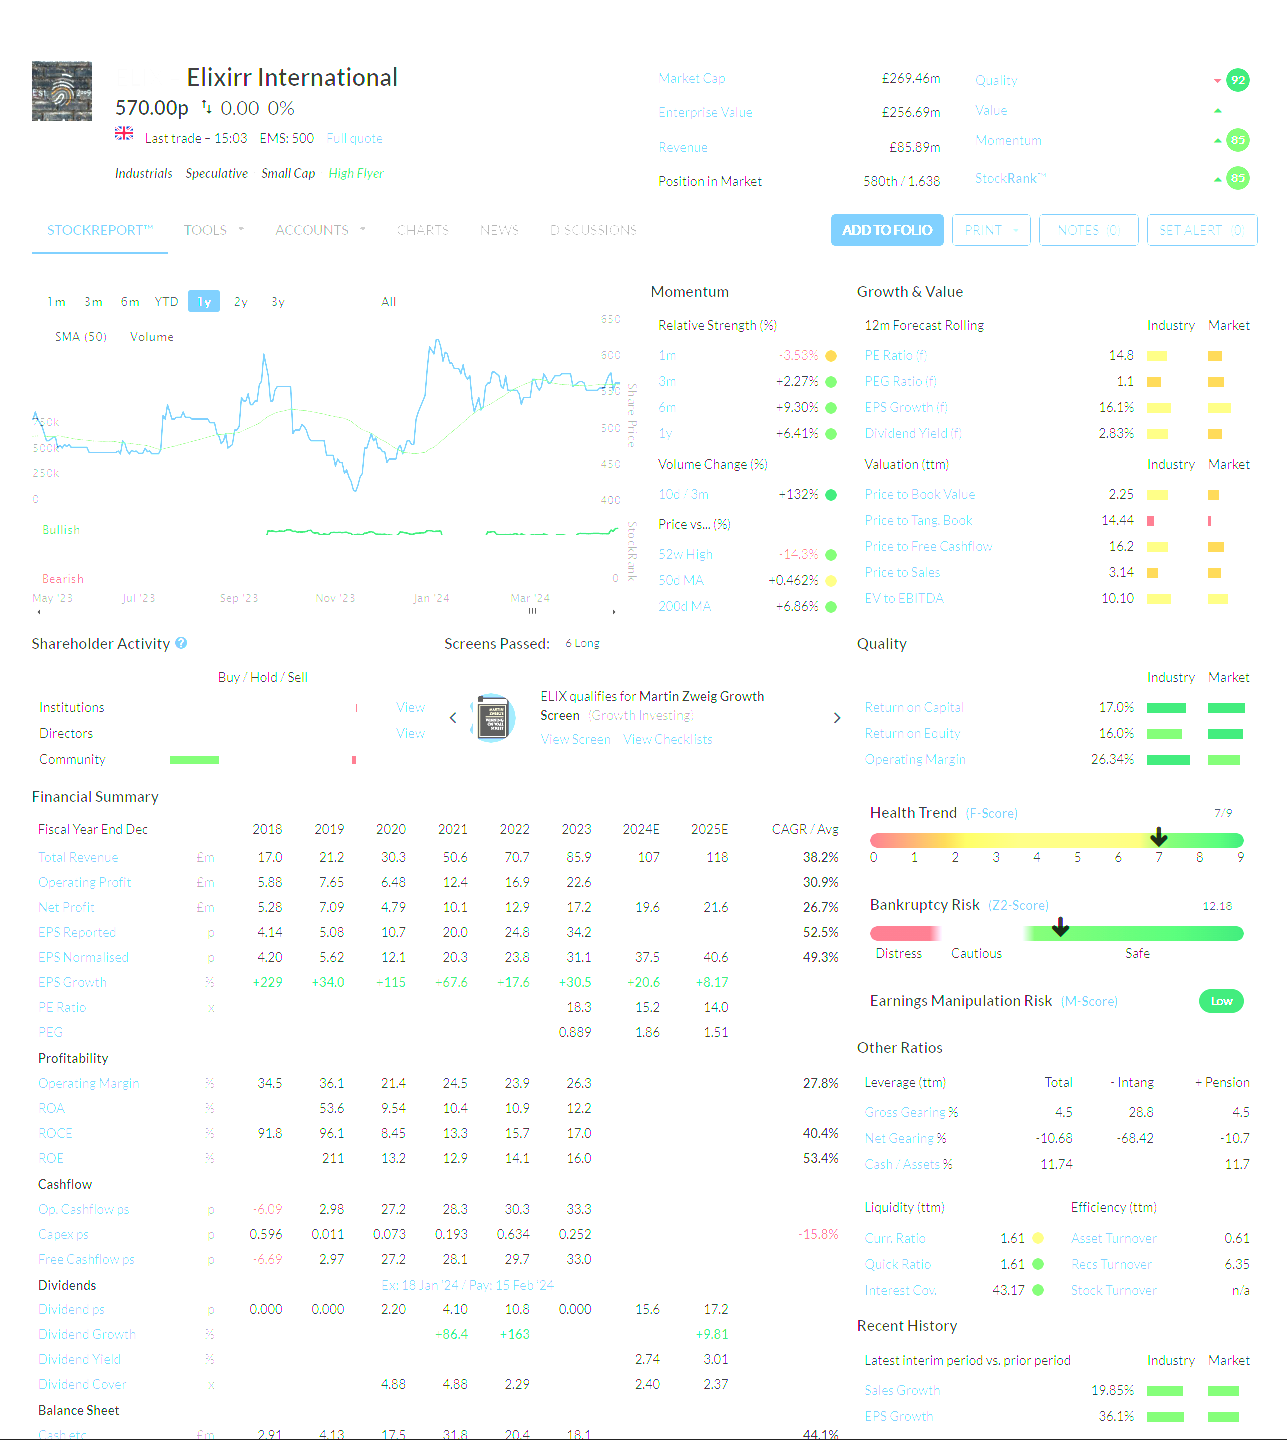
The dividend bar chart is best used in conjunction with the main StockReport. Whereas the chart helps investors analyse dividend trends over time, the StockReport can be used to ascertain how safe a dividend is. Let’s take a look at some useful metrics.
Dividend cover
Dividend cover is calculated by dividing the company's earnings by the dividends per share. A larger value suggests that the company…