How to avoid momentum traps in high profile growth stocks

The long spell of strong momentum that swept a number of fast growing stocks to racy (and possibly stretched) valuations has eased off recently. Popular names that set the pace in the market have seen their prices slip back. Among them are companies like Hotel Chocolat, Purplebricks, Fevertree Drinks, Frontier Developments and Joules and even IQE to name a few. All this prompted our own Paul Scott this week to question whether the momentum trade was actually over.
Timing market trends is notoriously difficult, of course. What we’ve seen from prices could be the market blowing off steam, a change in trends or the start of a wider correction. But whatever it is, it’s likely that this momentum wobble in go-go growth stocks will be worrying some investors - especially those that have bought them recently.
So it’s worth taking a step back and exploring why some growth shares are so good at grabbing investor attention - and why that means it’s important to know what sort of investment profile they really have, and how it can change.
Resisting the temptation of high profile shares
Most investors get their ideas from a handful of sources. We’ve previously discussed the risks of some of them, such as internet bulletin boards and broker recommendations.
But arguably there’s a much broader behaviour-driven problem faced by investors when it comes to sifting through ideas. Essentially, there’s a risk of being attracted to buying shares that are high profile and in the news a lot.
Now that sounds terribly simplistic and it’s likely to be laughed off by a few readers ! But the evidence from research by some influential names in behavioural finance suggests that this is exactly what happens.
Back in 2007, Brad Barber and Terrance Odean wrote a paper on how individual investors tend to be net buyers of attention-grabbing shares. They classed these stocks as those that were in the news, experiencing abnormal trading volumes and experiencing extreme one-day returns. By looking at trading data from brokerages, they showed that investors were often net buyers of shares on ‘high-attention’ days.
Barber and Odean blamed this behaviour on the fact that, faced with potentially thousands of stocks, the average investor automatically slims down the list to those that have caught their attention.
But there’s a bit more to it than that. It’s not just the case that the average investor buys everything that catches their attention. What they buy actually depends on their preferred investment style. So contrarian investors were found to buy out-of-favour stocks that caught their eye. While momentum investors chased recent performers that had captured their attention.
It’s on that final point - that momentum investors buy recent high performers that have caught their eye - that we can perhaps start to make sense of current trends. There have been very sharp price runs in a number of very popular, high profile and ‘newsy’ stocks. That may have been partly driven by larger numbers of investors being attracted by these names and blindly buying into them. But that, in turn, ratchets up the risk of them unravelling very fast if sentiment cools off, even for a short period, and the herd turns away.
How to know the investment profile of a share
Now, the challenge with behavioural traps like the issue of ‘attention’ is that knowing about them is no guarantee of not falling into them. But the good news is that a framework like the StockRank Styles offers an idea about the investment profile of a share. By letting the data do the talking, it’s possible to ignore the noise around a stock and see where its strengths and weaknesses really lie.
With the StockRank Styles we use a lens through which we can see how closely exposed a stock is to attractive value, good quality and strong momentum. Those three factors have historically been very influential drivers of long-run returns in the stock market.
So taking Purplebricks as an example, putting aside the question of whether it will succeed in disrupting estate agency or actually struggle to compete, its StockRank profile classes it as a Momentum Trap at the moment.
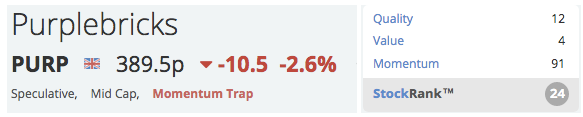
As a pre-earnings business that can only be valued against items like sales and assets, it arguably looks expensive based on the valuation the market is giving it. Likewise, uncertain financial strength means it doesn’t currently have the features of businesses that have historically outperformed in the market. That may change, of course - expectations may be fulfilled and it could be a highly successful stock. But right now, momentum - underpinned by high expectation - is the only factor supporting the price. If that drops away, then there’s a risk that Purplebricks will have low exposure to all three factors, classifying it as a low probability Sucker Stock.
By comparison, the StockRank Style of Joules, which is another popular growth share, is rather different. Here we find high ranking positions in two of the three StockRanks underpinning its classification as a High Flyer. In other words, it appears to be a high quality stock with strong momentum that’s quite expensively priced. If the momentum continues to slip, the high quality will be the only factor supporting the share price, which could qualify Joules as Style Neutral, or a Falling Star.

In fact, this is exactly what has happened with Hotel Chocolat, which was classed as a High Flyer in early September. Since then a persistent decline in its Momentum Rank has pushed it into neutral territory, with a low overall StockRank.

Hotel Chocolat amply illustrates why these popular growth stocks - some of which are recent IPOs - need very careful watching. If the behavioural science is to be believed, then it’s very much these kinds of high profile shares that are often in the news and being discussed that will typically catch the eye of the average investor.
That attention can drive them on to higher highs as their momentum accelerates. But in the absence of strong quality or attractive valuation, they can be prone to reversals and possible crashes if that sentiment changes. Of course, the ranking positions and StockRank Styles can go up as well as down - but for now the trend is turning negative among some of these previously high momentum stocks.
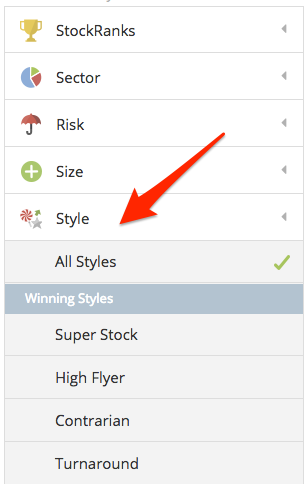
To get started in finding out the investment profiles of shares using the StockRank Styles, you can get started in the StockRank portal - here. Just choose from the Style menu on the left-hand side.
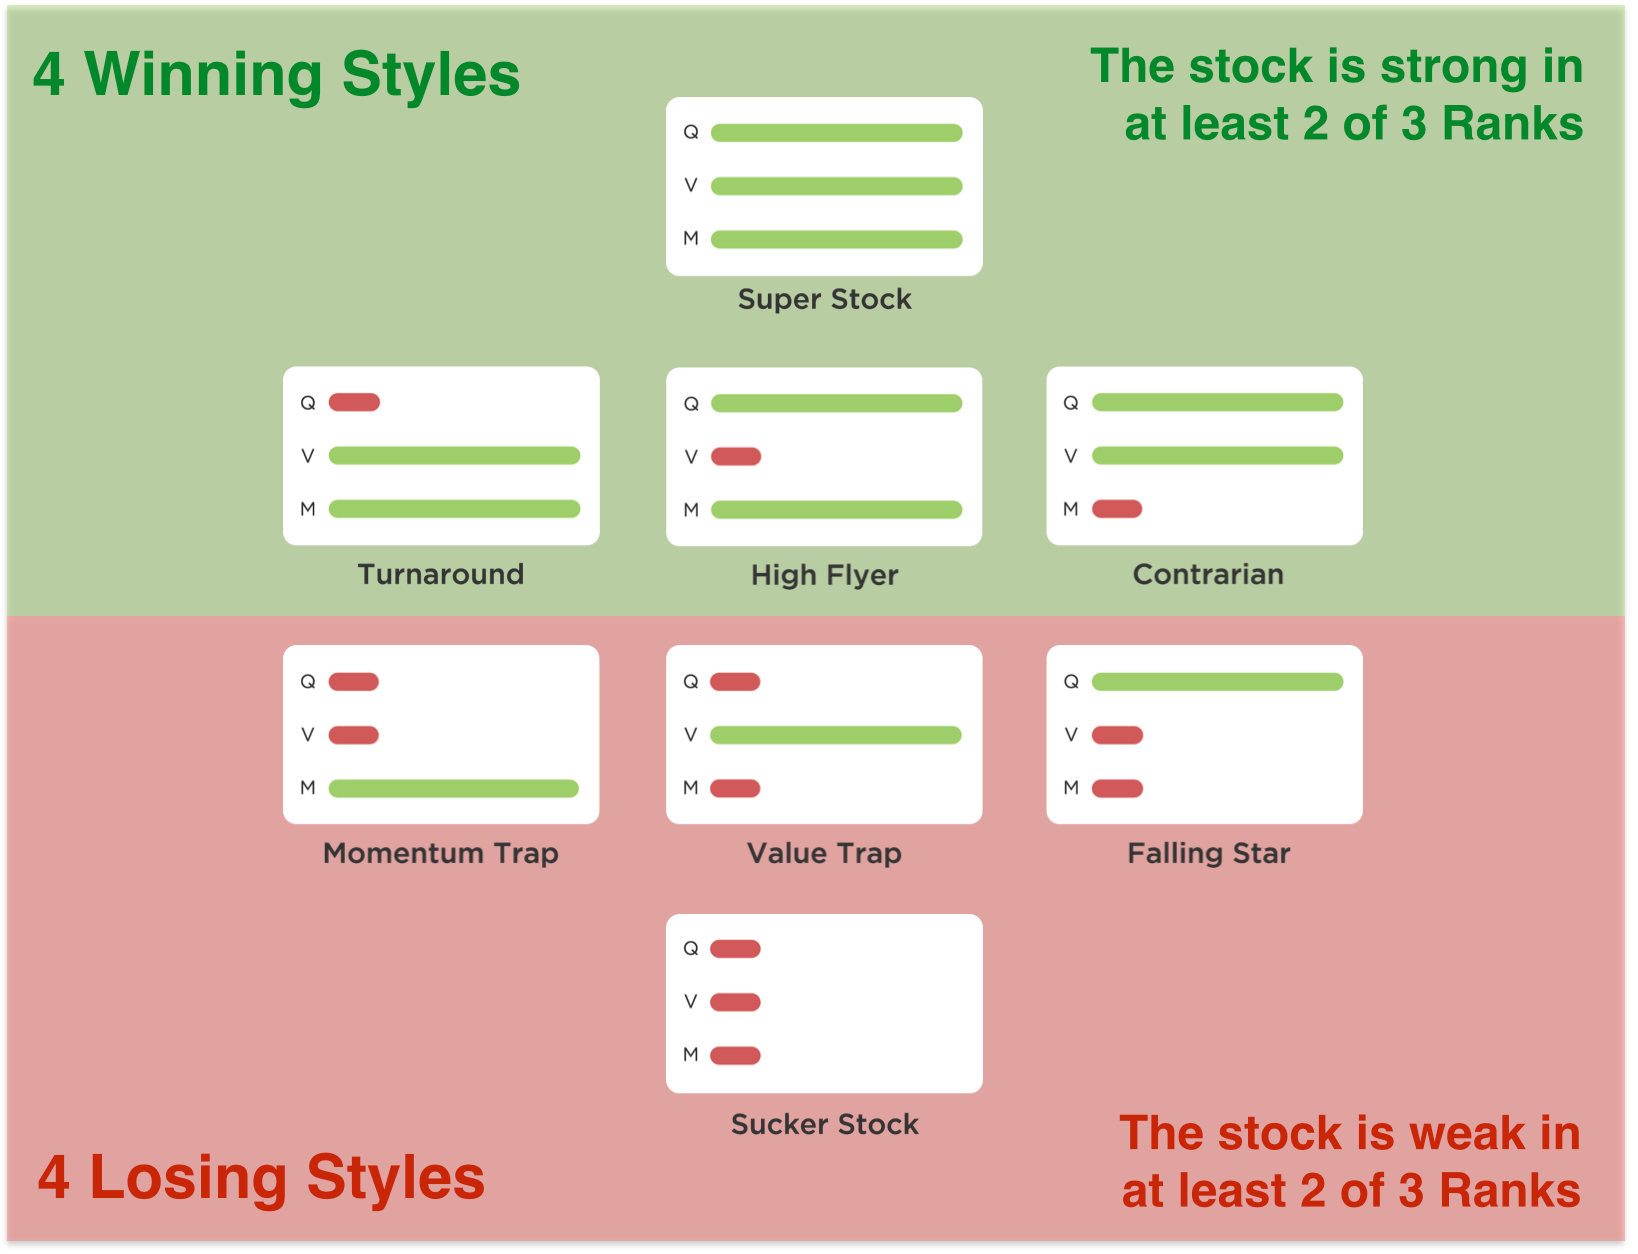
To give a clearer view on the StockRank Styles and the interplay between them, here’s a reminder of the full range of Styles:
Disclaimer
This is not financial advice. Our content is intended to be used and must be used for information and education purposes only. Please read our disclaimer and terms and conditions to understand our obligations.
30 comments
For me, momentum arises when one or more added value features are embedded in a business. Maybe charts and brokers can give pointers , but , to me, what counts is what the company or trust is doing, where and why and what is being achieved in their markets. And what the public reaction is and what it is likely to be.
I don't think you get this from charts.
So Purplebricks, for example gets high marks for breaking new ground and I am starting to see their signs around, so that's a big positive. The risk is that management are not up to it and that the values are hyped up too far already. . That is the trap !
Going back to original article I note Hotel Chocolat (LON:HOTC) is now a high flyer again and the shares are up over 40%. So yes you do have to watch them.
Hello Howard,
I agree with you comment 100% and the heavy buy bias that broker ratings contain.
But, by comparing broker ratings for different stocks I am able to select stocks with the highest broker ratings typically over 50% out of 100% (100% where every broker rates the stock as a strong buy) and add the broker rating to the other metrics, Dividend Forecasts, Dividend Yield and Share Price Difference from 1 year Maximum.
I am not able to offer evidence that my method has effective predictive accuracy. However, it is logical system when supported by looking into company reports, presentations and balance sheet numbers.
Drop me an e-mail if you would like visibility of the spreadsheets I use. My mail address is peter.cra@btinternet.com.
Just lost a long post. So quickly I don't always agree with the styles, some Momentum Traps in particular, Burford Capital (LON:BUR) was one, never agreed with that, now it is a High Flyer, since then its shares have gone sideways. I note that many of Minervini's recent share tips are Momentum Traps.
Would be interested to know proportion of MT that convert to HF or SS status and do they perform better or worse after conversion?
Something that would be useful is just calling up all the shares under each style.
You can do that. e.g. to find all Momentum Traps:
http://www.stockopedia.com/scr...
Or do it interactively from this page:
http://www.stockopedia.com/stockranks/
Nick, many thanks for that, that's great.
Hello Graham,
I provided feedback to Stockopedia following my two week trial regarding the desirability of a stock selection framework based on a stock screening tool which was flexible, fully customisable by the user and which generated a single overall investability metric. Please see as reproduced below the info I forwarded to Stockopedia on 30-Aug-2017.
Stockopedia Feedback, Share Selection Framework. 30-Aug-2017.
Background.
Stock market investment is not a precise science. Share selection is challenging for fund managers and private investors alike. Accordingly, most private investors "Leave it to the experts" and use the services of fund managers. However, investing in funds has its own set of problems and challenges.
Which fund or funds to choose. For example how is the private investor to know if an "Asian Emerging Markets" fund is a better investment proposition than a "UK Income" fund? Fund managers don't know either. That is why they ask the private investor has to choose from the available funds on offer. In reality the investor wants to invest in an "International Maximum Compound Yield" fund. Suprisingly no such fund exists.
How can a fund be researched when the prospective investor has no visibility of the constituent stocks? Fund charges are typically 0.85% to 1.25% PA. A £500,000 portfolio will attract an eye watering annual fee of £5,000 if the annual charge is set at 1.00% per annum. This is fine if the fund typically returns a compound annual yield (Capital gain plus dividends reinvested) of 12% or more but even in this scenario the compound yield is tarnished by the 1.00% fund manager charge.
Investing in Shares, My Initial Approach.
It takes considerable experience and significant amounts of time to learn how to research shares with good potential for an investment portfolio. I carried out a quick and dirty analysis of prospect shares when I first put my share portfolio togerther. My target was FTSE 350 companies i thought would have sustainable demand for their products and services, and, keep paying a reasonable dividend.
My initial approach had limited success and most of the selected companies shares performed well and returned a compound yield approaching 10% per annum. However, two of the shares I chose, Tesco (TSCO) and Drax (DRX), turned out to be dogs and lead to significant capital losses.
Share Selection Framework.
As time passed I began to realise that a structured approach using a reusable framework was required as a basis to select shares. The same methodology is also needed for deselecting underperforming shares in a portfolio. The idea behind using an analysis framework is to produce a permanent rolling record for each share assessed.
In the abscence of any available stock screen web based utilities which produce an overall investibility score I use spreadsheets as a platform to carry out a two part analysis. The first part is an assessment of each individual share and production of some basic metrics. The second part is to compare and generated further derived metrics for every individual share which has been assessed.
Overall Investability Score, Context and Application. - My method produces an overall investability score of each individual share. The contributing share selection metrics and weightings can all be changed to enable the correlation between each criteria and the overall investability scores to be adjusted to meet the investors requirements.
An overall investability score for an individual share is not a panacea!
The investor must also carrry out "Due Diligence" on all prospect shares by downloading and reading the most recent company results. Some company web sites are more "Investor Friendy" than others but all provide useful information. Presentations, results archives, dividend histories, financial calendars and so on. In my experience a quality company always has a quality web site. Examples; BP, Shell, Rio Tinto, Unilever to name but a few.
The key questions the investor wants answered are what are prospects for the company I may invest in and where is the growth coming from?
Company Share Selection Framework Part 1, Individual Shere Assessment. - Comprises an initial setting up activity and assessment followed by data updates and rolling assessment carried out at about 1 month intervals or as needed.
• Download entire dividend history and analyse.
• Download entire share price history.
• Download latest broker, (Strong Buy, Buy, Neutral, Sell and Strong Sell), consensus recommendations from at lease 5 sources. Analyse and produce average score metric.
• Download dividend forecasts from at least 4 sources to assess forecast dividend increases and foreward dividend yield prospects.
• Compute historical compound (Capital and dividend Income) gain between any two dates using dividend and share price history base data. This produces a momentum indicator yielding a compound gain which can be crudely estimated as the capital gain plus dividend yield.
• Compute share price difference from 1 year maximum as a value indicator.
Company Share Selection Framework Part 2, Compare and Generated Further Metrics For Each Individual Share. - Comprises generating and overall investibility score. All share selection metrics and weightings fully adjustable.
Screening Criteria. Dividend Yield (1 Year Rolling).
Screening Criteria. Year 1 & Year 2 Forecast Dividend Increase.
Screening Criteria. Share Price Difference From 1 Year Max.
Metric 1. Dividend Yield.
Metric 2. Forecast Dividend Increase.
Metric 3. Broker Consensus.
Metric 4. Share Price Difference From1 Year Max.
Metrics 1-4 Sum. Total Score.
I do not have the resource or database capabilities to assess merits of fincancial indicators such as PE Ratio, PEG Ratio, EPS, Debt Ratios, Balance numbers and so on.
Stockopedia Feedback.
Prior to my Stockopedia 2 week trial I used the Stockopedia's resources to download the dividend history of many FTSE 350 companies to corroborate and extend the information I had obtained from individual company web sites.
Stockopedia has an excellent set of financial data and technical analysis indicators for a very large number of companies. In fact there is so much data available for each company that, frankly, the investor is swamped with information. Much of the overall Rank, Value, Growth, Quality, Momentum is of little value in making a determination regarding the investibility of a particular share.
For example take the Stockopedia metrics for Royal Mail Group (RMG). This share has near zero dividend growth prospects and very low broker scores. Yet on Tuesday, 15-Aug-2017 Stockopedia indicated a "Stock Rank" of 96 and the other metrics as identified below. This makes a mockery of the ranking system. The value rank is also absurd!! In the case of RMG it is a BAD VALUE RANK.
Quality
Rank Value
Rank Momentum
Rank Growth
Rank Stock
Rank™ Risk
Rating Stock Rank
Style
92 96 54 46 96 Balanced Super Stock
Stockopedia Stock Screener Requirements.
Stockopedia should extend the capability of the web site by introducing a stock screener which can generate a set of overall share investibility scores for a large number of shares for comparison with the following Features:
• Full dividend history, dividend forecast and forward dividend yield forecast for any stock.
• User choice of financial and technical analysis data for screening.
• User configurable screening criteria of financial and technical analysis data.
• User configurable choice of screening metrics including simple mathematical formulae.
• Capability for user to devise fully bespoke screening metrics.
• Summation of metric scores to generate an overall investibility score.
Please see as attached Excel files for Croda International Plc (CRDA) share assessment and for a comparison of metrics for companies I have analysed.
Peter Craven.
30th August 2017.
Hi Peter
Firstly I would say that the Stockranks are from time to time going to throw up rankings that seem overly optimistic or overly pessimistic. But you can look at how the stock rated on the individual metrics that make a Stockrank score to see what it is that is causing a higher or lower reading than seems warranted. But overall the NAPS portfolio that Ed Croft selected using the Stockranks has shown at least so far that it outperforms the market.
Personally when I'm looking for growth companies I tend to pay less attention to the overall Stockrank as good growth companies are often expensive and that may depress their scores. But that is what I like about it. The details are basically there to allow you to ignore the value rank, and use other measures of value as screeners, if it doesn't suit your purpose.
I suppose that what you are seeking is the ability to build your own set of personalised Stockrank formulas with all the flexibility of a spreadsheet. It sounds like a bit of a tall order for a website to do all that and I'm wondering how many users actually want to go through all that work not knowing if their 30 factor formula is going to be any better than something much simpler. Adding complexity doesn't necessarily add accuracy just the illusion of it.
But I'm not wanting to say one way is better than another so the reason I asked you the question was so that if we all can see what you're suggesting then if it is appealing to people they can let the people that run the site know or give your message a thumbs up or something like that so Stockopedia can see the level of demand there is for your suggestion.
Hello again Graham and all,
If you would like visibility of how I screen stocks using individual spreadsheets 1 per stock and a common analysys spreadsheet to generate an overall investibility metric please drop me an e-mail on
peter.cra@btinternet.com.
At the moment I have only analysed 25 stocks. But Stockopedia could develop a similar stock screener with the capability to cover the whole market as they have access to a huge database.
Hi Ronald, I`m not familiar with I Ching or indeed the chart you are referring to. Many technical analysts have a rather all embracing and complex approach. A couple of years ago I had an opportunity to have an in depth discussion with an executive in IG Index. According to him as far as trading and spread betting is concerned only about 7% of clients actually made profits, possibly to do with the wealth of TA information available that many clients found confusing and contradictory.
Personally I only use about six indicators at the most. Volume is very important particularly On Balance Volume as well as the Accumulation/Distribution Index. One of the Stockopedia featured gurus William J. O`Neil is a volume fan amongst other metrics in his strategy. If you understand how volume relates to price action you may well find important entry as well as exit points to improve investment returns.
It's fascinating that you arrived at this set of parameters independently, and crafted them for convenient use; the more so that you limit them to six, which is also the number employed in the I Ching. Here is a link to a description of its hexagrams and trigrams - the latter corresponding to your chart, as can be seen: https://en.wikipedia.org/wiki/List_of_hexagrams_of_the_I_Ching
Hi Ronald, yes interesting that here are many ways to come to a similar view. I try to keep a balance between the fundamentals and the technicals. I`m not strong on fundamentals and that is why the Stockopedia approach is so important to me. I have about a yard of TA orientated books on my bookshelf accumulated over many years and feel much more confident in this discipline. I use graphs to study historical price and volume patterns in order to predict the future direction of share prices and favour liquid shares where the price/volume relationship is more valid.
When the `big boys` -- institutions and funds get involved there is no hiding place and they always leave their footprints behind.
The Accumulation/Distribution indicator as well as On Balance Volume indicator tell their story about current and future price action. I use both of these in a WEEKLY rather than DAILY setting to remove the static from the market.
I did look at I Ching on Wikipedia but I think it is too much for me to take onboard and as you say it may well simply duplicate my conclusions.
I am struck by the identity of the patterns in the chart - three-lined trigrams, with the strongest represented by three solid lines and the weakest by three broken lines - to the symbols in the chinese book of oracles, the I Ching, even down to the number of trigrams (8). As this set of symbols, devised over thousands of years of experience to symbolize the way everything changes into its opposite (and back again) is used to divine the future, it is oddly appropriate that it has a similar function here. Was the author influenced by the I Ching, or did he arrive at this pattern within the restrictions of stock analysis?
Interesting article, using StockRanks Stylesis helpful in selecting stocks for entries to avoid Sucker Stocks etc. However as for all entries the important factor is the timing. The only way I know how to time entries as well as exits is to use technical analysis as well as fundamentals. Stockopedia is the most reliable site that I know in assessing the fundamentals of equities and it has a proven track record to confirm this.
However even very basic technical indicators are very rarely referred to in Stockopedia and in my experience not using both disciplines particularlry for timing of entries as well as exits has the effect of reducing investors to one legged men in a butt kicking contest with predictable consequences. This applies for both trading as well as long term investing.
I look forward to comments from other subscribers.
I agree with the sentiments of the article, BUT, not with the Stockopedia system of stock rank based on Quality, Value and Momentum.
As I have commented previously, the overall framework for evaluating and documenting the rolling investability rank of a share needs to be based on fundamentals including the forecasts for dividends, company presentations and financial reports.
Investing on the basis of momentum and value is a mugs game.
Stockopedia need to develop a stock screener which is fully customisable by the user.
Hi Peter
The screening tool is pretty versatile. You can apply a large number of rules and arrange the columns on the results table to include or exclude whichever screenable parameters you want. And then you can sort rising or falling on any parameter you want.
What specifically is it that you feel is missing?
Your description of what you want, and say it can't do, is a literal description of the functionality Stockopedia offers, has always offered, and was designed for. Though having experimented with a variety of long screens, I have to say the built in long screens, especially the GARP and quality styles are better than any of my own attempts. I do use my own short screens, looking for unsustainable debt primarily. So without wishing to be rude, I don't think you understand the tool you have subscribed to.
Hi Andy,
What is needed is a user configurable stock screen which yields a single investability metric for each stock. Unfortunately, the Stockopedia tool nor any other the web based tools does not offer this capability.
The investor challenge is to identify which combination of parameters offer the best measure of a stocks investability. If we take the Stockopedia Value rank for example is has no predictive component except for the generic statistical characteristic that cheap stocks are more likely to perform better that expensive stocks.
Accordingly, I use broker ratings and dividend forecasts as the primary measures of the prospects for a stock. As I use spreadsheets for this purpose I have a fully documented rolling record of the shares I have analysed.
Using the metric of Growth At Reasonable Price (GARP) and unsustainable debt are excellent metrics to use. These metrics form part of the investors "Due Diligence" activity when forensically examining company balance sheets and looking at the wider fundamentals.
Hmm, I'm not sure I agree with your desired outcome. The future is inherently unpredictable and thus an absolute ranking score provides fake certainty. All that screening can do is provide a balance of probability that a stock may provide positive or negative returns. The rest is money management, diversification strategy and so on.
Use of broker forecasts is the Zacks approach.
Hi Andy,
As the future is inherently unpredictable an absolute ranking score provides fake certainty but, only if used on a stand alone basis. This applies equally to the Stockopedia Stock Rank and other metrics generated by Stockopedia.
Apart from this I agree with your comments
Peter
"Accordingly, I use broker ratings and dividend forecasts as the primary measures of the prospects for a stock."
I've yet to see any empirical evidence that broker ratings/recommendations have any more predictive accuracy than flipping a coin. There are at least two reasons for this:
(1) inherent optimism biases of brokers - the disclosures on the back of a recent Cannaccord Genuity broker note highlight this much discussed bias - 70% of recommendations are 'Buy', only 2% are 'Sell'. This seems optimistic, not least given that we're eight years into an economic recovery
(2) the sector specialisation of analysts - a UK house-building analyst may have a deep understanding of Persimmon, Bovis, Bellway etc, but his Buy/Hold/Sell rating is made relative to the overall local Equity index & therefore is exposed to both the over-bearing broad macro-economic forces as well as the relative merits of all of the other sectors.
I am completely in agreement with your note on broker buy ratings, but the interesting bit is the sell ratings. The 2% may be small in number but my experience ( not tested numerically) is that the "sell" ratings have a high probability of success and I view them as an extremely serious warning. I instantly sell any holding that turns up in this exclusive club and so far that has proved to be a good strategy.
Are you talking about just one broker with a sell rating? I do agree that sell ratings are rare but then the quality of brokers does vary quite considerably.
One broker sell rating is enough for me but that is specifically for small caps where often there is only a single broker following, since this is often a house broker for a small cap it is doubly disturbing.
For large caps with many brokers I would not necessarily jump so quickly but sell ratings are rare enough that I would look very closely at whether I would want to continue holding. For highly controversial stocks with both sell and buy ratings (such as Tesla for instance ) I would recognise them as intrinsically dangerous to my way of investing.
OK thanks. I did have a look at a few and most recent ones were down, is that because of the sell rating though? Only one I saw wrong was Purplebricks (LON:PURP), 13-Jul-16 UBS Sell - 115.00, it went up to 470.
If I have some time I may do some more work on it. I agree about TESLA, I read so many negative things about them.
Well timed arcticle - has given me food for thought.
I do in fact use the Styles in my filtration phase...
I agree that Purple Bricks is a momentum trap, and from my personal experience of the business, not one that I would buy at this time. In short, get lucky and sell quickly at a good price (my experience with a probate sale), but watch for service, both pre and post-sales (if you get a sale): my post-sales was so bad, I dropped them. Americans will not tolerate such admin. problems as on-line PurpleBricks dishes up, and they need America to get close to justifying the present (well overly high) share price, IMHO.
Generally, regarding momentum and high publicity shares, I only look at the type of business I'm au fait with, and won't jump in without waiting a while, and watching the price movement. Also, the fundamentals matter a lot too: hard with a new business not making profits, but revisiting over time gives a feel for what may happen, plus time to see how it's bedding down with real world business and commercial realities generally.
In short, don't get carried away. Take time and be patient: more hyped shares fall back than race away.
Hi, have only just joined Stockopedia in the last week, so am new to all of your systems. I have owned WANDISCO for some time. Looking it up on your StockRanks you classed it as a momentum trap, so I sold it at 652p using a stop loss, giving me approximately 40% profit. Its now gone up to 732.50. You could say I'v lost about 10% profit ? One needs a crystal ball to know what to do. Obviously there are many factors to take into account. I bought into the system to use as an aid to my investing. Hopefully using Stockopedia the numbers will stack up in my favour as this is very much a numbers game, one can only hope to end up on the plus side. But an interesting article, I will take note of it !
Now three years investing from a novice and on the plus side but need to improve my overall performance.
Hi caymans911M. Try not to dwell on lost profits or you will go mad, trust me. I made 50%+ returns on BooHoo last year and the share has continued to soar ever since!! 40% is an excellent return. Nobody will ever buy at the bottom and sell at the top, it just doesn't happen. Try not to mix up your investment strategy, be clear about whether you are investing quantitatively using the Stockopedia ranks and metrics because you can always find advice that supports your bias, e.g. run your winners. There is a lot of great advice on this site and so much to learn, but mostly you'll learn from your investing mistakes. I generally hold on to losers too long and convince myself they are value stocks. This is the hardest part of investing - when to sell. If you have system, stick to it and take the emotion out of it. Easier said than done, believe me. Good luck with your investing and well done with a 40% profit!!
This is a very good article because like many investors I have in the past fallen into this sort of trap with momentum stocks, however some have worked very well in my favour and I have managed to get out near to the top in all cases the key is knowledge and watching for warning signs , take a profit sell half on a double let the rest run for free or hold on for the 10 bagger white knuckle ride.