SIF Portfolio: easyJet could still be a high flyer

The price of a barrel of Brent Crude oil hit $80 last week, for the first time since 2014. So now may not be an obvious time to invest in airline stocks.
I’ve also only just got rid of one airline group from the SIF portfolio. Adding another one almost immediately might seem a little inefficient in terms of trading costs.
However, this sort of anomaly is an inevitable side-effect of rules-based investing. And this week’s stock, budget airline easyJet, is a very different business to the portfolio’s previous airline stock, British Airways owner IAG.
Still room for growth?
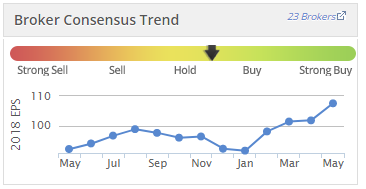
Happily we have the benefit of a very recent set of accounts from easyJet. The half-year report published on 15 May gave guidance for a headline full-year pre-tax profit of between £530m and £580m. That’s at least 30% above last year’s figure of £408m. It also seems to have prompted a round of broker upgrades:
The secret to the continuing growth and profitability of easyJet and other budget airlines seems to be strong demand. Once again, easyJet managed to increase both capacity and load factor during the first half:

easyJet admits that the failure of Monarch, Air Berlin and Alitalia has created growth opportunities. It’s expanding to fill some of these gaps and also selectively acquiring routes and aircraft, such as parts of Air Berlin’s former operations at Berlin Tegel Airport. In April, management also indicated an interest in buying some Alitalia assets.
With weaker airlines dropping out of the market, it’s a little hard to be sure how much market-wide capacity growth is taking place without more research. But easyJet’s total revenue per seat rose by 10.9% to £54.10 during the first half (+8.3% at constant currency). This was well ahead of a 2.2% increase in non-fuel costs, suggesting to me that the group’s pricing power remains healthy.
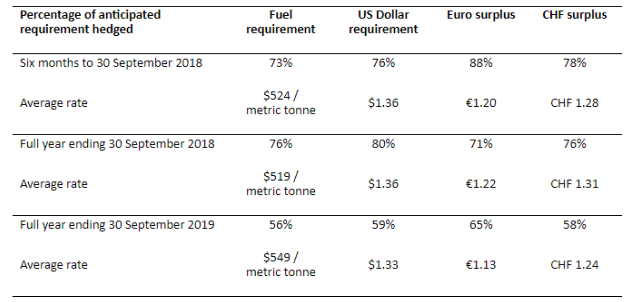
Interestingly, despite rising fuel prices, the airline expects its comparable fuel costs to fall by £60m-£70m to about £1,120m this year, thanks to a strong hedging profile:
What could go wrong?
As with all businesses, there’s a risk that easyJet’s management will mess things up. But leaving this aside, the main risks I can see are cyclical.
At some point, rising fuel costs seem likely to increase the airline’s fuel bill. Given that fuel accounts for about 20% of revenue, this could affect margins. Would easyJet be able to increase ticket prices to protect its margins, without affecting passenger numbers?
The other main risk I can see is a shift in the balance between supply and demand. Continued expansion could result in too much capacity, or demand growth could weaken.
As a low-cost operator, easyJet should fare relatively well in these scenarios. But relative outperformance could still mean a slump in profits.I do expect some cyclical risks to emerge eventually, but I have no idea when. So if the numbers stack up, I’m willing to give this highly-ranked stock a flight in the SIF portfolio.
Priced to perfection?
Stockopedia’s algorithms certainly likes easyJet, awarding it a StockRank of 97 and Super Stock status.

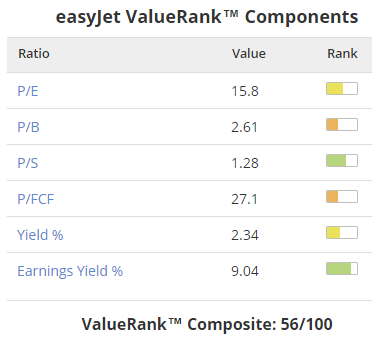
The weak spot seems to be valuation. There’s no doubt in my mind that this FTSE 100 group is very much priced for growth:
(You can see these breakdowns by clicking on the ranks from sector pages.)
Despite this, the earnings yield of 9% is comfortably ahead of my minimum requirement of 8%. Because this metric compares profit (EBIT) with valuation (Enterprise value), I find it a useful way to gauge affordability. In this case I’d suggest that easyJet’s valuation looks attractive, if it can maintain earnings growth.
One point worth mentioning here is that easyJet doesn’t really have net cash in the way the StockReport suggests. Airlines usually adjust their net cash position to take into account aircraft operating lease liabilities. This isn’t easy for use to calculate, but helpfully easyJet provides this figure, along with some explanation:

Net debt of £238m looks very comfortable to me, given that the airline generated a net profit of £305m last year. This level of debt is comfortably within my screening requirement for net debt of less than four times net profit.
Quality may be (even) better than it looks
easyJet’s QualityRank of 95 is the highest in its sector. It highlights a number of attractive characteristics:
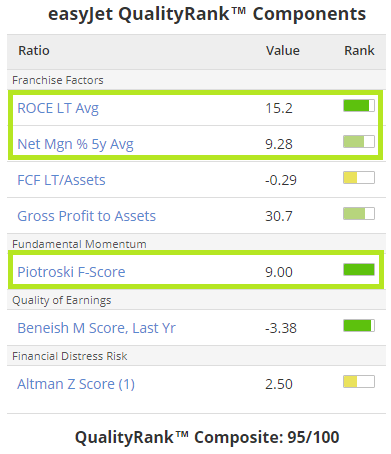
The only potential weakness here seems to be the lack of free cash flow, highlighted by FCF LT/Assets. The obvious explanation is that the group is constantly ploughing cash into growth. The StockReport numbers appear to support this conclusion, suggesting that capex absorbs most of the group’s operating cash flow:

However, after taking a look at the group’s cash flow statement, I think easyJet’s cash generation might be slightly better than the StockReport suggests. There are two reasons for this.
Dividends: For some reason, easyJet includes ordinary dividend payments in the operating activities section of the cash flow statement, rather than in financing activities where it normally belongs.
Dividends totalled £214m last year. My calculations indicate that adding dividends back in gives 2017 operating cash flow of about 220p per share and free cash flow of about 62p per share. That compares well with earnings of about 77p per share.
Sale and leaseback: Last year easyJet received £115m from selling and leasing back some of its aircraft. This is useful cash to fund growth, although it can mean that future lease liabilities pile up. Getting it right is a balancing act.
The Stockopedia measure of free cash flow only includes capital expenditure and excludes cash from sale and leaseback. Including this cash increases 2017 free cash flow by almost 50% to 91p.
I would add that my comments here are not intended to be critical of Stockpedia’s data. This is provided by Thomson Reuters and is generally excellent. But like any automated system, it can produce inconsistent output if the input is inconsistent. easyJet’s odd habit of accounting for dividends as operating cash flow is one such example. This is one reason why I always look at a company’s accounts before buying a share.
Improving momentum?
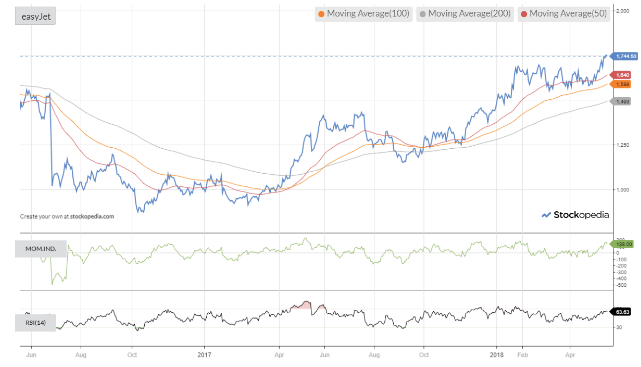
easyJet’s MomentumRank of 98 is fairly impressive. Starting with price momentum, the chart paints a fairly supportive picture for a medium-term entry point:
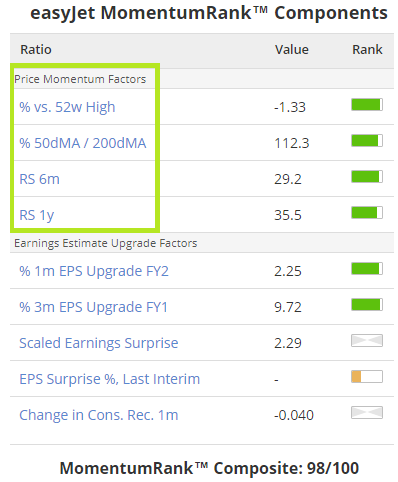
Here’s how this translates into the MomentumRank score:
What about earnings? Of course, price momentum is only half the picture. The other half comes from earnings forecasts. These have been rising steadily in recent months, both for the current year (FY1) and next year (FY2). We can this in more detail using the Broker Forecasts table:
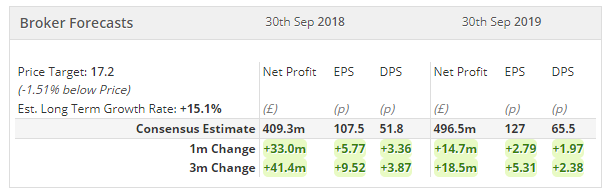
This is the kind of pattern you want to see when buying a growth stock - rising earnings and rising expectations.
My decision
After reviewing the figures, I’ve decided that I’m prepared to accept the cyclical risks of buying an airline stock in order to gain exposure to a proven growth story.
Trading on 14.5 times forecast earnings with a prospective yield of 3.5%, I don’t think the shares are too expensive yet.
I’ll add easyJet to the SIF portfolio this week and will also buy it for my own portfolio, once this article has been published.
Disclaimer
This is not financial advice. Our content is intended to be used and must be used for information and education purposes only. Please read our disclaimer and terms and conditions to understand our obligations.

1 comment
Just bought easyJet (LON:EZJ) myself as it's on a screen I've recently created. So interesting to read some very timely and rigorous research! - Thanks.
(I am trying very hard to just invest according to the factors)