SIF Portfolio: Up 19% and beating the market in year one

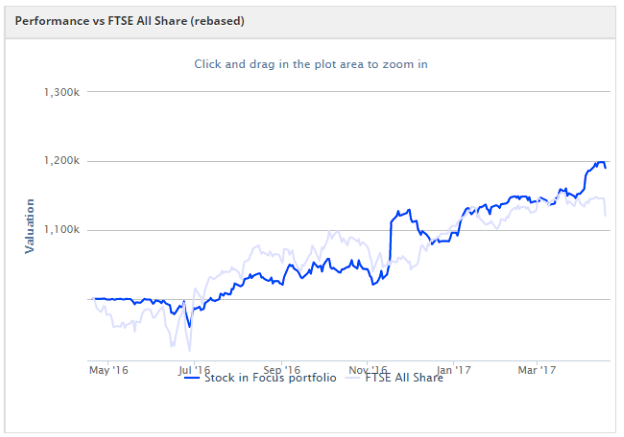
When I started the the Stock in Focus (SIF) portfolio a year ago, I wasn’t sure what to expect. But my fantasy fund has performed well. It’s delivered a 19.0% gain in its first year, versus a 13% increase for the benchmark FTSE All-Share index.
I don’t think that’s a bad start for my first year running this rules-based portfolio, which only takes a few hours a week to maintain. In this piece I’ll review what’s worked and what hasn’t. I’ll also consider whether to make any changes for the year ahead, when I’ll be investing my own cash in the SIF portfolio.
The story so far
I started the Stock in Focus Portfolio as a Stockopedia Fantasy Fund with the ticker SIF on 19 April 2016. You can see the current portfolio and full trading history here. My original article introducing the portfolio is here.
Stocks are selected for the fund from the Stock in Focus Screen results.
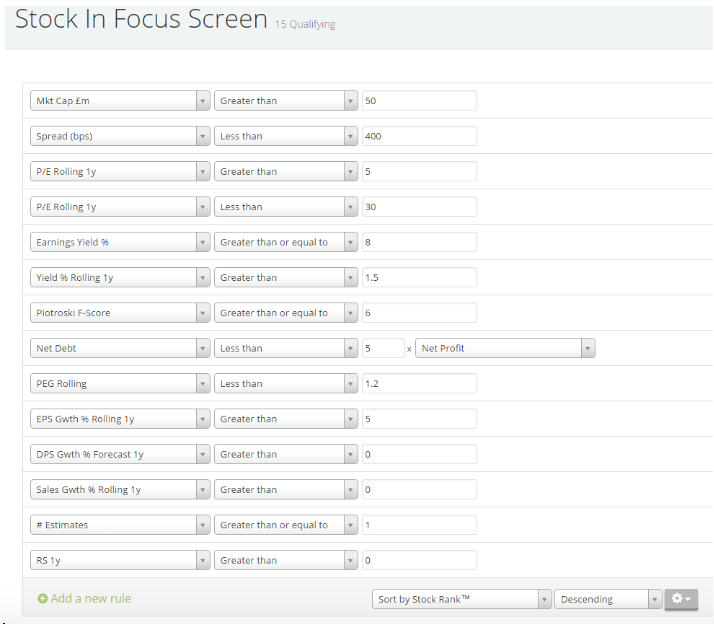
This screen is intended to capture good quality companies exhibiting the characteristics of affordable growth. Stocks are held for a minimum of six months and then sold if they no longer qualify for the screen. Target portfolio size is 15-20 stocks, with equally sized positions.
Stock selection is driven by the screen results, but I also apply some personal judgement and a basic set of diversification rules:
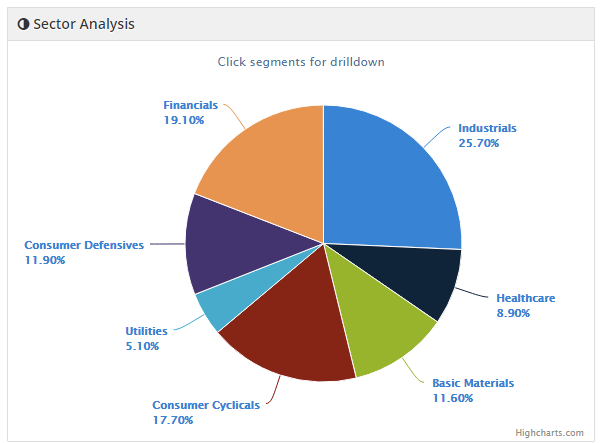
- Target an approximate 50:50 split between cyclical and defensive stocks (this has proved difficult)
- Ensure at least four of the 10 main stock sectors are represented
Has it worked?
Here’s how the portfolio has performed in its first year against its benchmark, the FTSE All-Share index:
- SIF Portfolio: +19.0%
- FTSE All-Share: +13.0%
- Outperformance: +6.0%
My six-month holding period has generated a fair amount of trading activity. Here’s a list of the stocks I’ve sold from the portfolio over the last six months, together with the total return achieved. Each company name is linked to my review of the stock at the time it was sold:
| Company | Total return after six months | Share price change since leaving portfolio |
| Go-Ahead Group | -22.6% | -16% |
| Persimmon | -16.4% | +32% |
| GlaxoSmithKline | +4.7% | +5.6% |
| Macfarlane | -10% | +4.7% |
| Somero Enterprises | +52% | +40% |
| Plus500 | -52.5% (sold early due to FCA announcement) | +15% |
| Avesco | +132% (takeover) | 0% |
| BAE Systems | +23% | +7% |
| Norcros | +0.9% | -4.5% |
| IG Design | +49.5% | +21.2% |
| Total Produce | +28% | +4.8% |
| Pan African Resources | +10.4% | +1.5% |
| Cambria Automobile | -4.1% | +11.3% |
| John Laing | +7.9% | +4.4% |
| Hogg Robinson | -1.0% | -1.8% |
| H&T | +12% | +4.5% |
| Average: | +13.4% | +8.1% |
Did I sell too soon?
I’m fairly happy with this result. An average total return per stock of 13.4% in six months isn’t bad at all. But it does beg the question of whether I’d have done better to hold these stocks for longer.
I’m not in a position to model different holding periods and the knock-on effects they might have on the portfolio’s other stockholdings. What I’ve done instead is to record the share price movement for each stock from the day it was sold, until 18 April 2017. This shows that the SIF stocks have risen by an average of 8.1% after they left the portfolio.
To put this into context, the FTSE All-Share index has risen by about 3.5% over the last six months. So these figures suggest that many of the sold stocks continued to outperform after they left the portfolio.
In some ways, that’s not a surprise. Quite often, the stocks I sold from the SIF portfolio were trading well with no apparent problems. There was no compelling reason to sell. A second problem is that six months isn’t long enough to be sure that a fresh set of results will be fed into the market during the holding period.
Which rules should I change?
Two rules have been flagged up repeatedly in reader comments and my own musings over the last year:
- The requirement for one-year relative strength (RS 1y) to be >0
- The six-month minimum holding period
Relative strength measures whether a stock has outperformed its index over a specified period. The RS 1y >0 rule caused me a lot of frustration in the wake of the sell off that followed the EU referendum. A number of good stocks that I believed would perform well didn’t qualify for the portfolio because they’d lagged the market over the last twelve months.
The problem in this unusual scenario was that the FTSE 100 kept rising after the referendum thanks to the rebound in commodity stocks. So even good quality stocks with a more domestic focus lagged the index for a while.
According to Stockopedia, research indicates that relative strength is a negative signal in the short term, but is often a positive indicator over a 6-24 month time frame. So my six-month holding period is likely to be too short to capture momentum effectively.
I can see two possible ways to address this:
- Hold stocks for longer;
- Use a more responsive measure of relative strength, such as RS 6m, which only needs six months of outperformance to turn positive so should flag up rising stocks more quickly.
I’ve decided to leave my relative strength rule unchanged as RS 1y >0. I’m going to increase the minimum holding period to 9 months.
There are three reasons for this decision:
- I’m fairly happy with the type of stocks being selected using the RS 1y >0 rule. After all, they’ve beaten the market by an average of 6% over the last year.
- I have some (sketchy) data to suggest that simply holding these stocks for longer might improve my returns.
- I’ve no way of backtesting a change from RS 1y to RS 6m. So this would be a fairly speculative change. The only thing I am able to do is to change the portfolio rules today and compare the current screening results for the two different time periods. Having done this, my initial impression is that RS 6m is less discerning and may flag up stocks with more uncertain momentum.
The year ahead
I’m not going to change any of the other rules in the portfolio this year. I want to get a clear idea of the effect of changing the holding period, which I’ll phase in gradually over the next three months.
During dry spells when the screen isn’t producing any results, I’ll continue using the Jim Slater-inspired relaxed version of my screen, which I introduced in February.
I’ll continue to target an even mix of cyclical and defensive stocks, although I expect this to remain difficult to achieve. I’ve no desire to add ‘expensive defensives’ to the SIF portfolio. As things stand, I believe overexposure to a well-diversified mix of cyclicals is preferable.
For me, it’s been a fascinating year that’s really opened my eyes to the potential of rules-based investing. I hope that you’ve found it worthwhile too. As always, I’d love to know what you think, so please share your thoughts in the comments below.
Disclaimer
This is not financial advice. Our content is intended to be used and must be used for information and education purposes only. Please read our disclaimer and terms and conditions to understand our obligations.

7 comments
Hi herbie,
Sorry for the slow reply. Re, outperformance, with a small number of stocks versus the market, I suppose gains (or losses) are likely to be lumpy. That seems to be how the portfolio has progressed over the last year.
As for selling, it's certainly true that developing rules for selling is probably harder than devising rules for buying. Certainly Pan African Resources (LON:PAF) didn't turn out as well as it might have done.
However, I think it's essential to have a defined plan for selling as part of a rules-based portfolio. Otherwise the risk (IMHO) is that selling would become very subjective, which could affect the success of the buying rules.
I'm extending my holding period to nine months this year, but an alternative approach might be to sell when certain valuation/performance criteria pass a specific threshold. I may consider something like this in the future.
Regards,
Roland
Thanks Roland, I did not mean no rules for selling but maybe some trigger points for reviews, such as a 10% share price fall or going under the 50MA, or M rank falling below a figure, rather than waiting for a set time to review for selling. I'm not keen on fixed times for selling.
Excellent write up Roland. The real test for any rules based portfolio is surely the performance in a flat or declining market - the next 6 months may be an interesting ride! Good luck.
Hi Patxi,
Very true. I'm conscious that market conditions over the last year have been favourable, with a steady upwards trend. By simply filtering out most of the dross, it's not been too difficult to outperform. We'll have to see what happens next!
Regards, Roland
Hi, Roland until the last month or so you were tracking the index but in the last month you have gone different ways, do you have any explanation for your out performance recently?
I have reservations about rules based portfolios, buying seems ok but I don't like the inflexible selling. Pan African Resources (LON:PAF) is a good example, that was up about 50% at one time but you had to wait for the review time to decide if to sell, I think you ended up with 10% profit in the end.
Still not sure about the "russian" shares.
Roland
This has been an excellent process to follow. Your writeups have taught me a lot about investing as well as utilising the powerful toolset within Stockopedia. I have read and enjoyed each post, so many thanks for your regular and consistent postings.
I too adopted a rule-based approach, inspired by you and the SNAPS postings from Ed. I have also, pleasingly, beaten my bench mark the FTSE 100 and am currently running at a 9%+ premium to it on a rolling annualised basis after 20 months.
I hope you will keep posting.
Regards
Howard
Thanks Howard, it's great to hear that rules-based investing is working for you too.
Regards,
Roland