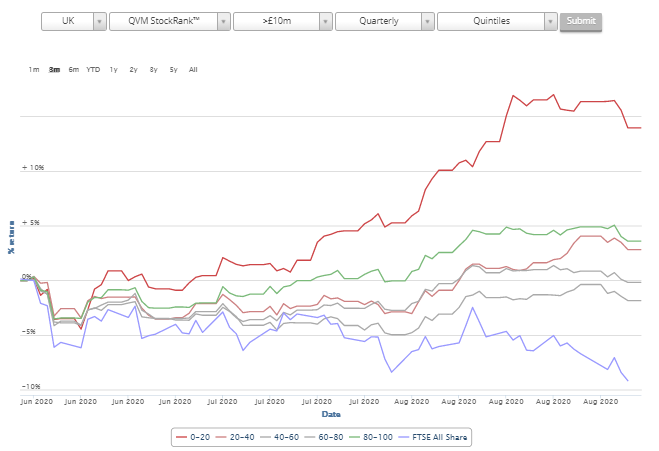
Has anybody analysed why the bottom two deciles have outperformed so dramatically over the last 6 months?


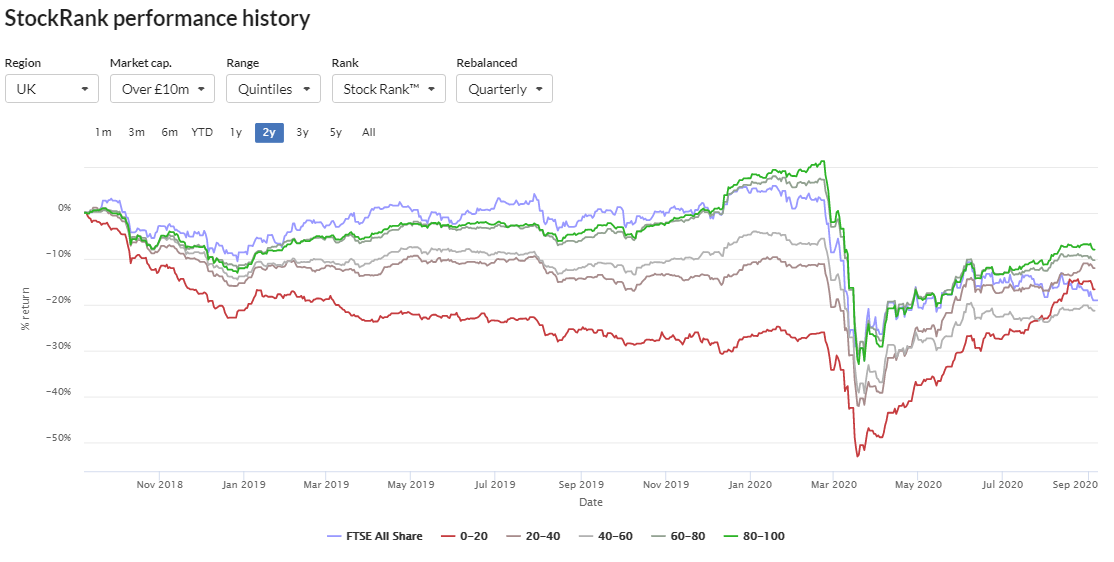
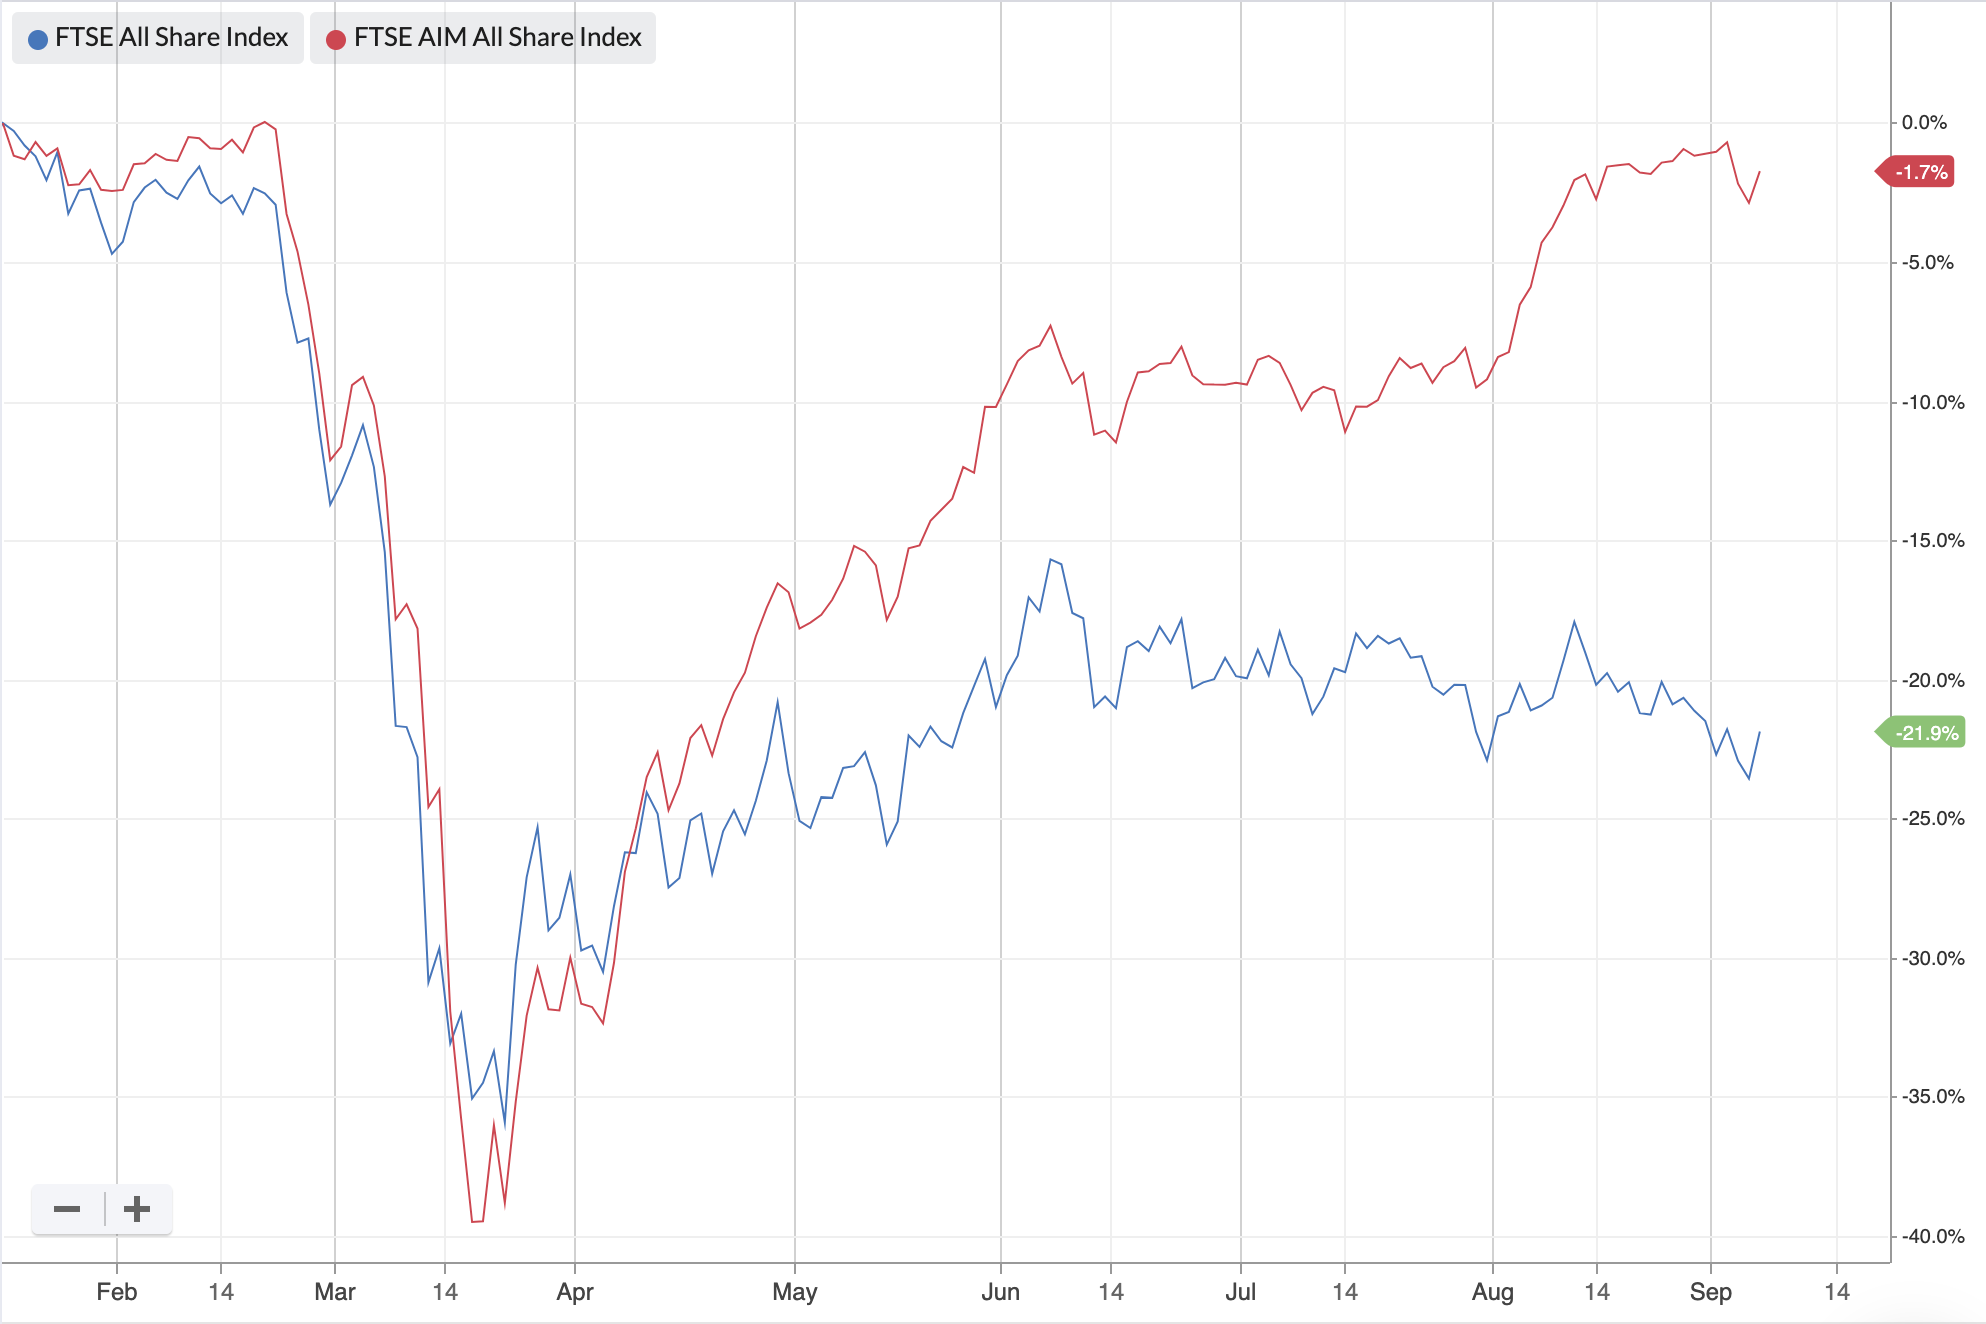
Interesting question. Looks to me, at a very superficial level, as being a combination of mean reversion and momentum. Zooming out to two years shows a widening gap for 0-20 possibly priming them for some mean reversion. With Covid they appear to have fallen proportionally less. They then bounced back at about the same rate, but as you say they then continued as the other quintiles flattened. I suspect that looking at sector proportions by quintile might give a clue.