StockRanks return over 100% in 4 years... how have you got on?

After a year of treading sideways, and mostly lagging the market, since June 2016 shares ranked 90+ by StockRank on the LSE have rocketed in price. Brexit was the trigger for a general surge in share prices on both sides of the Atlantic... but the top ranked set of stocks has significantly outperformed. The 90+ ranked set has risen 36% in this timeframe versus 22% for the FTSE All Share.
This recent move has now taken the price return for 90+ ranked UK shares to 109.7% in under 4 years - a 21% annualised return. These are for quarterly rebalanced portfolios, but even the annually rebalanced portfolios are up by more than 95% in the same timeframe. While transaction costs are not included in these calculations, neither are dividends which largely offset the transaction cost lag.
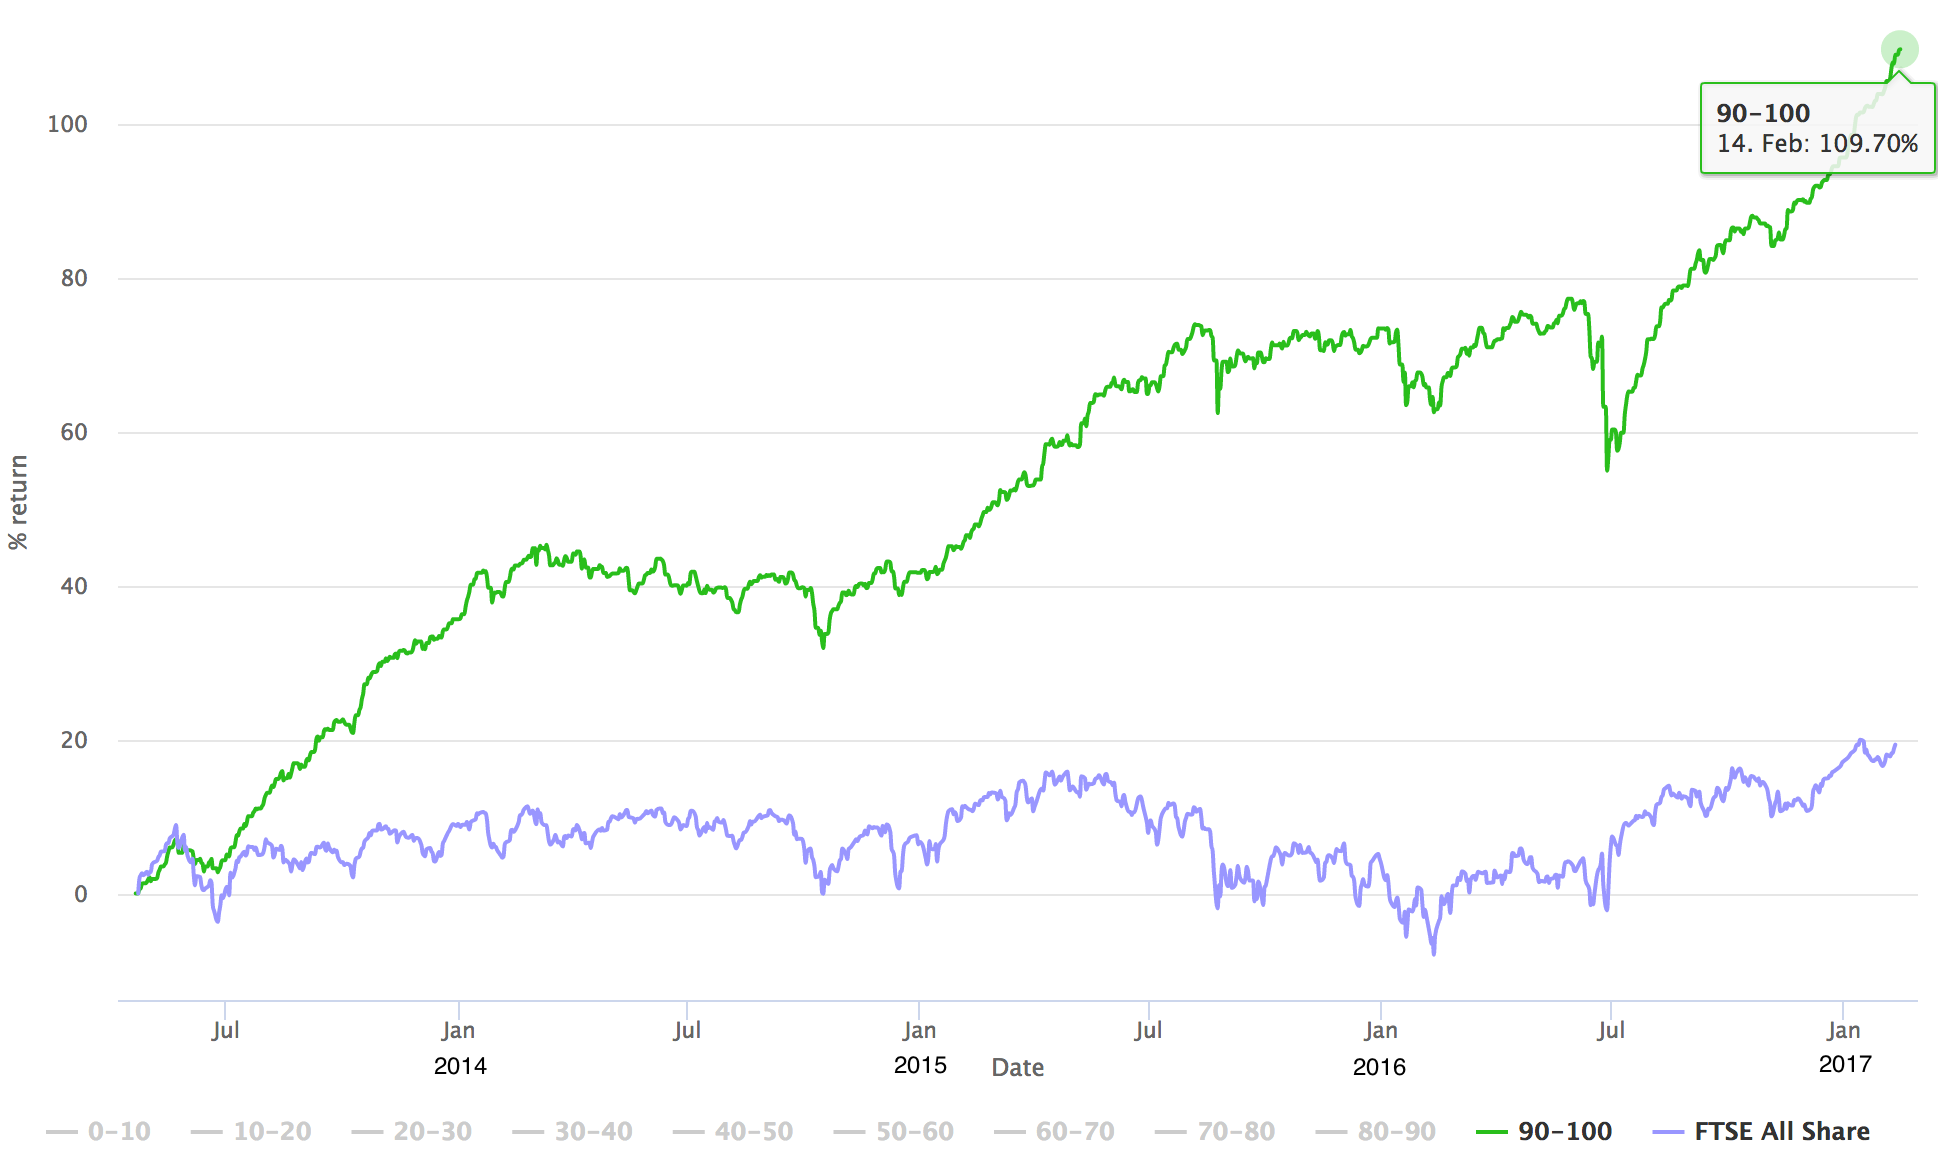
This is a significant milestone. The ranking strategy behind the UK StockRanks is a simple factor investing framework that analyses the quality, value and momentum of each share. Given that these factors are well described and understood in publicly available research papers on websites like ssrn, efficient market theory suggests that outperformance like this should be impossible.
Institutional investors have certainly struggled to attain results such as these, but the anecdotal evidence I hear from our subscribers illustrates that many have been matching or even beating these results.
If you've been implementing your own strategies and have been having some success please do let the community know in the comments below? Any war stories you can share may give others the confidence to start managing their own investments.
Disclaimer
This is not financial advice. Our content is intended to be used and must be used for information and education purposes only. Please read our disclaimer and terms and conditions to understand our obligations.
36 comments
Hi Ed,
Are you planning, or is there scope in the future to enable 'backtesting' of our own Stockopedia custom screens?
BW
Hederz
Subscriber since July '13
I've definitely been very struck by the performance so far o the stockranks. Given the market imperfections I think I understand it seems intuitive to me that factor investing would work, especially when you combine different factors. The really interesting (and never ending challenge) is how best to use factors in combination. I'd envisage methods of ever increasing sophistication for this becoming much more accessible to the private investor in the future. (Stockopedia has made this much more accessible for me already!)
I wanted to ask a general question about whether and how Stockopedia was thinking of developing its stockranks algorithm?
I have one main substantive thought on this: I think the stockranks are great in that they use a combined index ranking multiple factors. This can better exploit factors in combination than the simple screens (which can also be useful). I can see there is a very valuable bit of IP in how best to create this index. However, to me given the many different types of businesses on the stock market, I am surprised that this 'one size fits all' type of index appears to work so well e.g. treating cyclical and non-cyclical businesses the same. I would have thought that factors might be used differently or given different weight given the type business.
I think a useful development at some point in the future might be to combine a screening and ranking approach i.e. use screens on some factors to identify a category of businesses and then apply ranking (tailored to this type of business) using other factors to identify which were best to buy at a particular time. This seems intuitive to me and in line with how many professional investors think about selecting investments. You might then come up with a lot of different screening and ranking combinations (so there would be a lot of complexity). For instance I prefer to use 'quality' factors as a first stage screen (so I only invest in great businesses and as in principle quality should not vary much over time) while momentum and value factors are better at telling me when to buy a high quality share in the shorter term.
I think it's great that Stockopedia allows me the flexibility to come up with my own approach but borrowing the indexes you've developed - I just wondered whether there were any possible developments to the Stockranks in the pipeline (or possibly thoughts on how to generate data from slightly more complex approaches in the future)?
Hi Trigger.
Some interesting ideas discussed. I agree that it will be necessary for factor investing to evolve to continue to outperform other investment strategies. I think Stockopedia can be to the forefront of this.
To anyone long enough in the tooth, it reminds me of the early 1980s when the likes of Commadore and Sinclair introduced cheap home computers to the bedroom nerd generation and suddenly thousands of enthusiastic wannabe quants were learning to write code. The creativity released gave rise to a whole wave of innovation that "group think" big business would have missed out on.
I think it's a similar situation here as myriad home users now have access to an infinitely flexible investing tool kit and with personally invested pensions and ISAs the capital, to spawn many new investment strategies. Many will fail, but as with the million monkeys on a million typewriters, someone, somewhere will come up with the complete works of Shakespeare. For me, being able to "back test" strategies using various historic stock rank combinations would be an especially useful enhancement as a part of this process.
One observation on your comments. I'm not really sure that "one size fits all" does really apply, in that some sectors see share price performance less closely correlated to Stock Ranks than others. Purely anecdotally (no hard analysis to back up the hypothesis), I sense Stockopedia is very strong at analysing the historic but less effective with the forward looking speculative. Take for example, the O&G sector. Some huge winners over the past year but primarily from Stock Ranks of 30 or less. While M (essentially "market sentiment") in its many forms does seem to apply, V and especially Q don't seem able to cope with identifying the speculative winners which in turn drags down the aggregate Stock Rank score.
Recognising this, one either ignores these sectors for factor investing completely - which from comments on the board suggest is the case with many here - or alternatively take the tool kit provided and seek new ways to apply it more effectively. There is the challenge and the opportunity as crowding in to the "easy" sectors reduces returns.
Anyhow, enough rambling. The dog wants a walk ....
Best,
Gus.
Hi Gus
Yes I'm pretty excited about the idea of backtesting too - could result in a huge leap forward in evolving the more complex factor strategies I'm thinking about (especially if people share the results of their backtested strategies). There's some exciting opportunities for Stockopedia here!
Yes I agree with you on the 'one size fits all' - that's kind of what I was trying to say. I'm just surprised that the performance of Stockranks in aggregate is quite so high in spite of this. I'm particularly wary that the stockranks may be biased towards cyclical stocks at the wrong times because they do not consider that there may be cyclicality. I'm interested in exploiting a mechanical approach to work out how best to invest in very high quality shares so I'd want to know what ranking system worked best if you restricted your universe to a narrow universe of very high quality shares. This might be different to applying ranking in aggregate as Stockranks do.
Anyway maybe backtesting will be the answer!
Paul
We've a backtester in development, but no promises as to when it will be released.
It's true that different factors will work better for different sectors/industries, but also for different regions & countries. As an example, notoriously momentum has never worked in Japan.
I've long wanted to begin ranking individual sectors & countries by different ranking systems, but it can require a bit more detail in the data (e.g. more information on reserves for O&G stocks, or more info on advertising spend in some industries).
The ranks have performed quite robustly across sectors (see this blog from June last year) but the one sector that the ranks haven't worked so well in is the Energy sector. Of course the entire sector has underperformed for years, but this chart makes it clear that a lot more in-sector knowledge (or data) would help. The top Quintile (80+) ranked shares have performed pretty much the same as the bottom quintile.
If I was a dedicated Energy sector stock picker, I probably wouldn't rely on the StockRanks, but then again the NAPS portfolio process has uncovered a few excellent Energy selections - e.g. Glencore. I'm very comfortable using the StockRanks for the Energy sector as part of a diversified portfolio. There's been a 60% rally over the last year in this sector of course, and excluding the sector just because the StockRanks haven't worked so well would have been a mistake.
Ed,
An interesting contrarian view on momentum in Japan from a former student of Fama. Originally published in the Journal of Portfolio Management Vol. 37, No. 4: pp. 67-75.
Mike
https://www.aqr.com/library/journal-articles/momentum-in-japan-the-exception-that-proves-the-rule
Over the last four years, with a strategy that has evolved as my experience grows, I have averaged around 25% p/a, becoming more consistent in the last couple of years. Stockopedia is largely responsible for this. I am now planning to retire this year as a result. My approach can be summarised as:
1. Don't buy turkeys
2. Buy companies that already show real signs of success - no speculative/story stocks
3. If it starts to look like it might become a turkey, sell it.
These are my current guidelines for achieving the above:
* SR > 80 and QR > 80 (an analysis of earlier holdings showed that my significant losses were disproportionately among lower QR stocks). Exceptions apply where the case is compelling (e.g. BOO after their post-IPO warning, up over 500% since)
* No banks - ever. I have worked in several, don't understand their risks, and it is apparent to me that management doesn't either, so what chance does anyone else have.
* No overseas AIM stocks (thanks, Paul Scott, for that tip amongst many others). Exceptions apply if there is sufficient evidence that they are genuine - e.g. SOM
* Avoid oil or mining-related companies unless the case is particularly compelling - too volatile
* Sell immediately on profit warning or serious setback news
* Re-evaluate on any non-warning related significant price drop of high MR holdings
* Ride out any other price drop, either specific or market-wide. No stop-losses. This has worked out far more often than not, and most particularly after the Brexit vote.
* Ride the winners. Don't top-slice
* Only average down if the original buy case is still valid, on no news, or on obviously overblown minor setbacks.
* If a company changes direction significantly, sell it. Historical metrics are no longer valid
* Avoid excessive concentration in one sector.
* Avoid anything with excessive debt or pension liability (keep the latter in review if bond yields rise)
* Limit position size for less liquid shares.
* Don't over-research. The more time you spend on one company, the more you know and understand it, the more you are likely to favour it over others that you have spent less time on. Time is spent more productively evaluating a larger number of candidates to a shallower depth. Purely algorithmic approaches like NAPS are the epitome of this concept.
My portfolio is currently biased to high MR, as I find it difficult to identify high VR/low MR that are not value traps. Exceptions tend to be in out-of-favour industries, e.g. housebuilders post-brexit, recruitment agencies now, oil-related last year (I did find a compelling case to buy WG. last year and made about 50% on it). This is something I need to work on, I'd prefer to have a better balance between value and momentum to reduce risk.
Many thanks to all at Stockopedia, especially Paul Scott and Ed Croft whose writings have strongly influenced me.
One tool in the rank performance I would love to have is be able to vary the start date. Should be a simple add.
I have started a virtual portfolio using the stockranks strategy. I would like to know what market cap cut off is reasonable to be above as well as a BPS cut off.
"why the performance differentials are not simply arbitraged away once the details and studies are published.
I would be fascinated to hear anybody else's views on this, and the long term sustainability of StockRanks continuing this exceptional performance."
Yes, this is something I have been wondering about too Alan.
When you look at the chart of the stockranks performance they started with a massive run up of about 42% in less than a year. If you strip out that good start the performance is far less spectacular. In fact the initial performance is so good a cynical person might wonder if the start date is entirely random.
I wonder though if the publication of the stockranks and their success has already led to their being less effective.
When I first subscribed to Stockopedia in the Summer of 2016, I was hugely impressed with the performance of the stock ranks. One problem is that 4 years is a short time period to judge over, and a key question for me was whether the last four years' rate of return of >20% pa for the top decile was "lucky" , and would it all be different if applied to a different time periods?
Firstly, I must admit I take comfort from the consistency of the Ranks, in the way that top decile beats 9th decile beats 8th decile etc.
I did then read the 700 page "What Works on Wall Street" by James O Shaugnessy. A huge tome which presents analysis of stock market performance for periods going back to the 1920's, and looks at various factors separately, and then by combining them .. particularly Value & Momentum. Stocko's Ranks have more factors combined than anything else I have read, so nothing is exactly like it...but you can certainly see that the O Shaughnessy book is an inspiration for Stocko, and shows Factor performance by deciles in the same way. Its fair to say that the results shown in this book over a long period are similar in shape to those achieved by Stocko. It is, however, sobering to see that even top decile Value+Momentum factors had their periods of savage drawdown. While one on the combinations of Value and Momentum shows an average 22% pa return since 1928, such that $10k invested back then would be worth $9bn now. (What was my Grandad doing spending his dough on fags and booze when he could have put it away for me to spend now!!). However, its fair to say it was not a smooth ride over the last 90 years, and more characterised by stellar periods of growth and nasty drawdowns. You could be in it and the wrong time and lose a fortune! The message of the book is certainly about a consistent approach and taking the long view.
The simplest Factor book is the Joel Greenblatt "Little book that beats the Market", where he combines simple Value and Quality ratios, but shows a remarkable performance over the last 20 years or so. I have also more recently read the Berkin and Swedroe "Complete Guide to Factor Based investing", which summarises several historical studies, and goes further in trying to explain why such differences exist (ie why value stocks out-perform "story" stocks etc), and also tries to evaluate why the performance differentials are not simply arbitraged away once the details and studies are published.
I would be fascinated to hear anybody else's views on this, and the long term sustainability of StockRanks continuing this exceptional performance.
I've been the first to caution against over-optimism regarding StockRank performance. Downside volatility is to be expected. I would expect the top decile of StockRanks to correct harder and faster than the overall market and that's historically been the case. The top decile has an average market cap of around £200m (last time I looked), is a strong momentum subset, and has a larger proportion of industrials. There's a fair amount of risk taken in the search for stronger returns and most people find that hard to cope with when things reverse.
When bad drawdowns occur, - such as during Brexit - most individual investors get out of the market which normally proves to be an expensive mistake. I've written about the "Beast of Volatility" before ... fear of volatility is one of the main reasons that most private investors struggle to make considerable returns in the market.
So if the StockRank performance continues fanning the way it has (which is what's happened in all historical studies of ranking systems) I would expect two things to happen.
Regarding the long term sustainability of StockRank / Factor investing performance. I anticipate that global stock markets will continue to get more efficient. Every year there are more and more individuals waking up to the opportunities in factor investing, data gets more available and the tools improve. Within 10 years I think we'll see a severe flattening of the spreads available for these kinds of QVM strategies. My hope is that our systems can stay well ahead of the curve to squeeze the excess returns out of the markets for subscribers.
20%+ per annum is a very strong return but it's only a 4 year period. I would anticipate this number to decrease over time. I was hoping we'd see 12% annualised returns for the top decile which in a low yield world would be a very strong return. We're well ahead of my expectations.
Will some markets exchanges, such as AIM remain more inefficient for longer?
Thank you to Gus for the screening values. It makes fascinating viewing and lists all the stocks I should have bought. I have looked at the international results and there are lots of surprises but needless to say valuations are very high, which is the biggest issue with stock rankings. My NAPS for y/e 2016 was +12% on an international 20 share selection for those who are interest, which was ahead of my portfolio as a whole despite some dogs in the NAPS that I will rebalance out in future perhaps quarterly.
Huge appreciation to you, Ed, and the Stockopedia team. What a brilliant achievement. I started investing, mainly small cap stocks, from the start of April 2014 but I did not discover Stockopedia until early 2015, from a flyer in Investors Chronicle as far as I remember. Normally I would have chucked this out as some underhand attempt to separate a fool from his money but thank goodness a mysterious voice from on high seemed to inform me that this was precisely what I needed to transform my investment performance. I signed up immediately and have been glued to Stockopedia ever since. I invest through an ISA with TD Direct and have put the full ISA amount in each year since 1 April 2014, so £11,520 + £15,000 + £15,240 + £13,560 (so far this year - with a final investment of £1,680 still to make before the end of the current tax year) so £55,320 paid in to date. My TD ISA account balance on 5 April 2015 was £43,166 and by 5 April 2016 had increased to £50,810, a gain of 15% approx. (compared with only just over break-even the previous year to 5 April 2015 in spite of a big gain from investing in Kentz). Astonishingly, my ISA portfolio is today showing a balance of £100,007 after a spectacular period of growth this year of around 70% (having taken off the £13,560 paid in so far). I do have Paul Scott to thank for Avesco, Boohoo and Gear for Music, which have seriously turbocharged the portfolio. But the high stockranks alone have led me to numerous other selections which have performed exceptionally well over various periods - Safestyle, Sopheon, Brainjuicer, Empressaria, Trans Siberian Gold (did I really invest in that - what was I thinking?! but it's done pretty well), Liontust, Trifast. So I have treated Her Ladyship to a bit of a celebration tonight! I still think of myself as a complete amateur and am utterly amazed if one of my selections actually starts to show a profit. Also I am painfully aware that a savage bear market could occur at any moment and snatch my ill-gotten gains in a trice. I rely primarily on the stock ranks, but I try to combine that with strong earnings growth projections. I have been very influenced by Slater's Zulu strategy which is what makes most logical sense to me. If there is any hint of trouble I sell rapidly. I wondered whether Naked Trader was right about selling out when there is a profits warning. It was hugely reassuring to see the in-depth Stockopedia analysis vindicating selling out after a profits warning as the best strategy. I am living proof that Stockopedia can empower someone like me with very limited experience in equities to succeed. I think Ed and team have created something absolutely brilliant and unique. Good luck everyone.
I started using StockRanks to pick stocks for my portfolio in April 15. Previously, I had largely based my picks on Joel Greenblatt's Magic Formula, although I had refined this a lot mainly based on the book Quantitative Value by Gray an Carlisle. Nevertheless, I was having mixed results. Since concentrating on picks with high StockRanks (nearly all 90+}, I have made a profit of almost £17k (including 45% realised gains) on an average portfolio of about £44k (15 to 25 stocks). This includes trading costs and dividends. I always tried to diversify in terms of sector, but more recently, I have tried to diversify more in terms of market cap. (minimum £40M) as per the NAPS portfolio. I am also trading a lot less since I decided to buy and sell only one stock per month! I am getting to the stage where I am considering selling some of my tracker funds and picking stocks with this money too. So thanks and keep up the good work, especially Paul, Roland and Ed.
My 2016 performance for my UK equities performance was very good (38%). I followed a similar strategy to the NAPS, but I allowed myself some discretion and I did not force myself to include firms which didn't meet my criteria. (over 90 stock rank and a number of filtering rules to reduce instances of false positives e.g. P/E above 5) I would instead reinvest into US equities in the same sector. Also a big driver for my returns was to shift into stocks with high proportions of dollar earnings following the Brexit vote.
I don't know my absolute return but over the last 12m
My general filter is high SR and Piotrowski f score > 6 and FCF > 0. I then choose from this universe.
- my ISA (~50% based on high SR) has outperformed the FTAS by 10% in the last 12m
- my SIPP (~40% based on high SR) has outperformed the FTAS by 6% in the last 12m
I tend to hold until a stock underperforms the FTAS by ~17% from its peak - and then regret not sticking to this rule :) - no science here.
I'm a relatively new member to Stockopedia (joined November 2016) and I started my own fantasy fund which is based upon a Stock Rank system.
You can find a link to my fund below:
http://www.stockopedia.com/fantasy-funds/vm-dividend-fund-6803/
I've taken inspiration from the "Winning Growth & Income" screen but gave it a Stockopedia twist! The returns in 2 months have been very impressive, but time will tell whether this works out in the long run.
Any further thoughts on how to improve are most welcome!
I have enjoyed working with the worldwide versions of Stockppedia since they became available. It is very helpful to have companies all over the world pre-analysed by Stockrank, and Stockopedia has made it possible for me to enjoy considerable diversification in sectors, geographic areas and currencies. The overseas investments have tended to be turbocharged due to the recent fall in GBP, which has helped even more.
I would therefore suggest that the Stockopedia information on worldwide foreign companies is no less helpful than for local UK firms. I don't buy investment trusts, but prefer to make (or lose!) my own wealth, rather than paying someone to do it for me. Ultimately, every fund manager has to pick a holding and hope for the best. I'd rather do it myself, even in equities. Many management fees are incredibly high, and remain payable even when the portfolio is losing value. I say: DIY!
Tim S
My UK portfolio has for the last three or four years been largely based on the Stockranks with additional special situations based on ideas from Paul Scott et al (many belated thanks to Paul for Avesco!). I am not sufficiently organised to give an exact figure for performance but it has been more than satisfactory.
However, I would be interested to hear from members who are subscribed to ex-UK regions (eg US, Europe, Asia) who have been investing in those regions on a Stockrank-based system. Has their performance been as good as many are reporting for the UK Stockranks? A large part of my portfolio is invested in foreign equities but almost all of it in investment trusts as I don't have the confidence to choose individual foreign equities. Do those who have subscribed to foreign regions and invested using the Stockranks feel that that the results have been worthwhile?
Nick
I've been a Stockopedia subscriber since November 2013. For someone with a previous background in finance my portfolio is largely a product of research done through Stockopedia, both in terms of the data metrics, filtering tools and guru screens. I do follow up research reading Investors Chronicle and taking note of comments posted by Paul Scott. As a result I have achieved an annualised gain of >19% over last 3 years.This beats the performance of many active fund managers. My thanks to Ed and his team and look forward to the new interface being development for later this year.
Early days for me as I didn't start using Stocko until October 16 however signs are encouraging with a material outperformance versus Ftse all share (and consequently also those activity managed funds I have started to dump)
I've adopted a slightly different approach to NAPS and have two folios one focusing on high QVs with decent divis and a QM folio where I will probably end up having a shorter holding period. The tricky issue is deciding on my exit point on the upside. On the downside I had used stops which I now regret as in most cases the correction proved to be temporary.
As many followers will know I have published the £20K StockRanks portfolio which has been running now for just under 2 and a half years
I reported on the 24th October 2016 that while my fist year earned a staggering 39%, that the second year was flat at 0.57%. Annualised 19%
I am very pleased to say that since my last reporting the portfolio has increased by 10% from £29220 to £32309 (without applying any dividends paid since 24th October 2017)
I have been stopped out of KCOM (LON:KCOM) and looking for a replacement which I will report on when I have the time.
StockRanks - Leverage - Stop Losses is now my approach for going Long in my Spreadbet and CFD accounts.
In addition to stating the returns that have been achieved it would be helpful if contributors to this thread would include a brief description of what rules they follow E.G are you investing in only SR90+, minimum Mcap, sector diversification, how often rebalancing is done.
Hi Unwise2.
Here is a screen shot of the simple initial filter that I applied to select my original raw data for inclusion in my NAPs portfolio referred to in post 7 above, I also use it to benchmark the portfolio from time to time (any significant fails are replaced every 6 months or so) and to identify possible replacements. It currently shows up 35 stocks which if I was doing the exercise from scratch today would allow me to select my 25 sample by weeding out any obvious problem stocks (e.g. the overseas AIM listed for no good reason, stocks which get a bashing in the daily Paul Scott reports etc.) and looking to get industry and sector diversification where possible. Possibly a bit more "monkey brain" input than a strict factor based approach but works for me.
Best,
Gus.
Hi unwise2,
Personally I run a 10-15 stock portfolio. Maybe more diversification would be useful but time is my biggest constraint.
My base method for new investment ideas by going down the Stockrank (SR) list from high to low (cut-off at 90).
Within that I prefer companies that have a market cap of £30-200m as I was an auditor at Baker Tilly and that was the scale of companies I generally audited. I will go outside of this range sometimes but a good £1bn business seems to increase by >50% less often/quickly than a good £75m business in my experience (as we are looking at 90+ SR basically all the businesses will be good). With firms this size I hope to find companies where they are a major player in a niche business area, I get the feeling this gives them a kind of economic moat as a large well funded company (who would be the worst kind of competitor) would not bother starting from scratch in a market where the total potential profits are not huge, two examples that have done well are Somero Enterprises Inc (LON:SOM) and Avesco. As in the case of Avesco it would often be easier for a potential competitor to just buy them out, which of course ends well for current shareholders.
I will also look on all recent discussion posts for any candidate I like the look of. There have been multiple times where I like the first look of the numbers but, say, a recent SCVR highlighted a bunch of red flags.
Oh and I will never, ever, buy a Chinese company listed on AIM. There may be some great companies there but just far too many frauds so I cannot trust the numbers.
If there are multiple options I will pick the higher SR option.
For other ideas each day I also read the SCVR as well and if Paul or recently Graham see something really interesting that they repeatedly flag up I will look at it even if the SR is not in the 90's. In 2016 this has only really applied to the etailers: BOO (that I totally missed) & G4M (that I missed the early part but got the late part of 2016's gain). Maybe super high growth stocks will never be priced in a way that would give a 90+ SR.
Selling however is much more woolly. If the SR drops below 80 I will have a very good look at it (this has just happened to H&T for me) to decide if it is time to sell. If I really like it I will keep it unless the SR goes below 70, if it is more of a weak conviction I will sell earlier. I know this can be improved but am not sure how to attack this best.
If anything gives out a profit warning I now sell (following Ed's webinar), even if it has a high SR. I think a, say, 95 SR + profit warning will have a lower expected return than a 80 SR with no profit warning so there are suddenly better areas to look at.
All in all I find this way does not take a vast amount of time (and has produced exceptional returns so far), and I am naturally quite interested in this stuff so will happily give half an hour a day to it. Maybe that will change in a savage bear market, I hope not but it is certainly easier to log on in the morning to a nice green gain.
Hope that helps,
Pete
Hi Ed.
Another very satisfied customer here. I've been a Stockopedia subscriber since November 2015 and started a 25 stock NAPs type portfolio in January last year. (Despite some initial scepticism, I was brought into the fold after picking up on Paul Scott's freebie daily blog - so big tick in the box there for its marketing value). The subscription coincided with a decision to migrate away from generally poorly performing tracker funds and a desire to more actively manage my own funds.
To date the NAPs portfolio is up about 22% with relatively little ongoing maintenance and like many Stockopedia users, I suspect I am now invested in quite a number of companies I hadn't even heard of this time last year. Perversely, a distinctly non-NAPs, non-PC special situations portfolio I have been running in tandem has done significantly better (up about 90% over the same period), largely through riding the wave of O&G and Resource stocks recovery.
This said, even this non-factor based portfolio is largely a product of research done through Stockopedia, both in terms of the data metrics and the helpful discussion threads, guru screens and filtering tools. Having sufficient easily manipulative real time data on demand makes such a difference when compared to my former research methods of trawling through broker reports, annual reports, and RNS announcements etc., even for someone with a previous background in finance.
In aggregate, across my entire share portfolio I'm up about 40% since I started actively managing individual shares which compares very favourably to my residual fund/IT holdings which are up about a still creditable 15%.
It will be interesting to see how robustly the tool set works in the inevitable market correction.
Best,
Gus.
I am up just over 100% over the last 3 years. To reiterate PhilH this really is life changing; thank you to the Stockopedia team for both the academic research based quant part (vastly improving my investing process) and also providing a forum where a smart investor community can share and discuss ideas in an honest way, keeping me away from the frauds that will by definition get through a fully computer based system.
From Jan 2013 to Jan 2017 I'm showing an annualised return of 25% and to date my investments have increased by over 150%.
For me the most pleasing aspect is the consistency of 20%+ returns every year. Long may it continue.
It is also particularly pleasing to see others say "I don't have much idea about the companies I invest in" as this means that this strategy has the potential to be embraced by the naive stockmarket investor which for me is a big win. The more we can give autonomy to individuals to mange their wealth the better.
Once again many thanks to the Stockopedia team, these successes are truly life changing.
I have achieved an annualised >20% gain over last 4 years. I have not directly been focused on StockRanks although inevitably influenced by them. Low StockRank and I will halt my research there, Good (70+) StockRank and I may research further.
But my returns have fluctuated wildly each year from a 10% loss to >80% gain.
The consistency of 20%+ returns reported by Phil H are very attractive and probably less stressful if achieved by following a portfolio of very high StockRank.
Maybe I need to increase my focus on the StockRanks.
From 1/10/15 to 15/2/17 I have an annualised return of 22% choosing almost entirely StockRank shares over 90 and diversifying as much as possible.
Ed
I think mechanical Stockrank investing is great for time poor individuals and (as I now do) that Stockranks are a valuable aid to Stockpickers. I started investing in Jan 2013, evolving from buying tips, to a partial mechanical SR system and now to careful fundamental analysis which is heavily influenced by SR and QM considerations.
Just as the SR %gains have ebbed and flowed so has my portfolio which is now up just over 100% over the 4 year period. What is pleasing though is that each year has seen a %return improvement, so I am quietly confident that my Stockpick/Stockrank selection system will continue to outpreform the market. A high 5 to the Stocko team whose metrics have enabled this to happen. Ian
Congratulations on the fantastic results thus far for the stockranks. I took control of my own investments in Aug 2015 investing purely on stockrank with rules similar to the NAPS portfolio. Since then the FTSE All-share has increased 12.6%, the total return on my investments incl transaction costs and dividends has been 37.2%. I spent a bit of time deciding on my rules for buy/sell, diversification etc, when I started, but since the rules have been established and tweaked, I've probably spent about 4hrs total on all my investment decisions in the past 18 months. I do have to admit I only have the vaguest of ideas of what each of the 40 or so companies I have invested in over that time actually do!
Excel calculates XIRR at 24% since I started with StockRanks in August 2014