This time two years ago, one of the most popular ‘quality’ investment strategies tracked by Stockopedia was sitting on a three year return of just over 100%. After a strong run, the Screen of Screens drifted with the market in late 2015 and early 2016, but it’s recovered well since last summer. In that time it’s bounced back to the top of the 5-year ‘quality’ leaderboard, with a return of 113% - and it is doing even better in Europe.
To make it onto the Screen of Screens, a company has to be passing the rules of at least four of Stockopedia’s 60 long-only investing models. Those guru-inspired strategies are categorised as being either bargain, value, growth, quality, momentum or income. To make it onto the SoS, the precise style isn’t important - just the number of strategies passed. So, for example, one of the leaders in the list at the moment is the housebuilder Persimmon, which passes the rules of 12 strategies in the value, growth, quality and income categories.
A signpost to solid companies
The idea behind the SoS is that companies making it onto several different strategies should be a pointer to those with good fundamentals across a range of investing criteria.
Like all the investment strategies, the Screen of Screens portfolio is refreshed every quarter. That ensures it’s always holding stocks that are closely aligned with the strategy rules. Trading fees aren’t counted against the performance returns, but neither are the gains of dividend income.
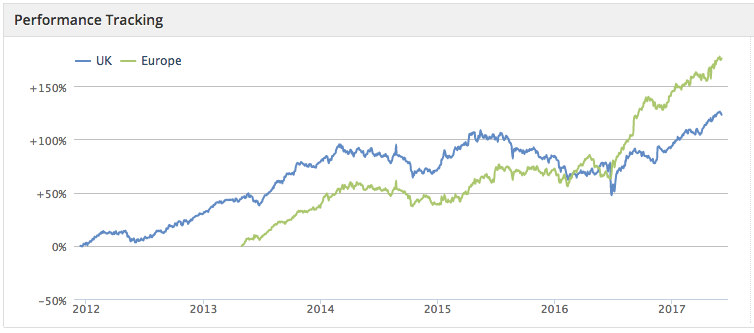
Over the past year - when markets have been pushing higher - the SoS strategy has returned 24.0% in the UK, and a really eye-catching 65.3% across Europe.
So what does a typical SoS stock look like? One observation since the launch of the StockRanks (Stockopedia’s calculation of each share’s quality, value and momentum) is that these companies do tend to score well against those investment ‘factors’.
Back in April 2015, Ed wrote that the average StockRank in the screen was 87 out of a possible 100. Right now, the median across the 54 UK qualifiers is slightly higher at 91. In Europe, the average StockRank for the 200 companies passing the screen rules is 92.
But while the average rankings are impressive, they do mask quite a wide spectrum…