Why you think there are more high StockRank profit warnings than there really are

On Thursday evening DX Group was ranked amongst the top 1% of stocks in the UK according to the Stockopedia StockRanks. Unfortunately for holders, the company announced a profit warning on Friday morning and was brutally punished by the market. It fell 73% from 85p to 23p on the day. As usual, Paul Scott was very quick off the mark with his analysis in a post which has drawn a wave of more than 60 responses from the community since.
Catching up this morning I discovered many, often rather angry, comments about the fact that DX Group had a 99 StockRank before the profit warning. For those who don’t know, the StockRanks grade all UK and international shares from zero (worst) to 100 (best) across a range of fundamental and technical factors, so when one of the top rated stocks falls out of bed it tends to cause a stir.
As one of the architects of the system, some of these comments were pointed in my personal direction, so I feel I have a duty to respond. While I’ve written extensively on how to think about high StockRank stocks before, there was one comment in particular that has prodded me to pick up the quill. Be warned - my response won’t be comfortable reading for some but I do hope though it will clear up some of the misinformation that has been shared on the discussion boards.
Have lots of high StockRank stocks really been “disasters”?
Whenever there’s a profit warning in one of our highly ranked stocks I often see this kind of comment:
Quite a number of high StockRank rated stocks have disappeared, gone bust or become disasters lately.
This is a very normal response to a painful situation such as a profit warning, but it is an observation driven by software bugs in the human brain rather than from rational investigation.
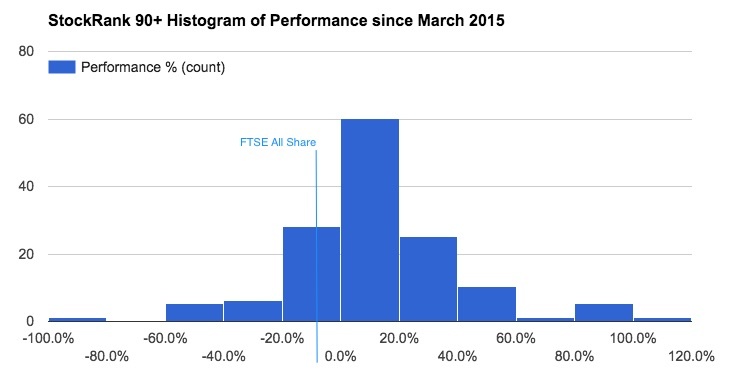
In order to analyse whether lots of high StockRank stocks have indeed ‘disappeared, gone bust or become disasters’ I have taken a closer look at the performance of the 142 shares that had a StockRank of 90+ on 31st March 2015.
- Performance In just over 7 months, the average performance of these 143 stocks has been a gain of 11.4%. For comparison the FTSE All Share has fallen by 8% in the same period. i.e. these 142 high ranked stocks have beaten the All Share by almost 22% since March. Not too shabby.
- Hit-rate - But averages can be deceptive, what about the distribution of the performance of the underlying stocks ? Well 70% have generated a positive return, 30% a negative return and only 15% have fallen by more than the FTSE All Share’s -8% return. Again, not too shabby.
- No. of Disasters - Looking more closely at the ‘disasters’ - there are 6 shares in the 90+ set which have lost more than 40% since March - IndigoVision (-41%), Plus500 (-47%), Entu (-48%), Volga Gas (-49%), EVRAZ (-58%) & China Chaintek (-100%). But on the other side there are 17 shares which have gained more than 40%. i.e. You were almost three times as likely to have picked a stock that gained 40% than you were to pick a stock that fell more than 40% using the StockRank 90+ set.
The following histogram shows the distribution of returns across the whole set and I hope settles this debate once and for all. If you want to go and dig through the numbers please do check out this Google Spreadsheet for yourself.
On shark attacks and falling airplane parts
So the reality is that the StockRanks have continued to be mighty good at finding winners and avoiding disasters. So why does it appear to so many of us that the StockRanks have highlighted so many losers?
There are a few reasons which all relate to pesky behavioural biases in the brain. The first of these bugs is known as availability bias which I first picked up on in David Dreman’s “Contrarian Investment Strategies”
What is a more likely cause of death in the US, being killed by a shark or by pieces falling from an airplane ? Most people will answer that shark attacks are more probable. Shark attacks receive far more publicity than deaths from falling plane parts… yet dying from falling airplane parts is thirty times more likely than being killed by a shark attack.
Kahneman and Tversky called availability bias the rule of thumb by which people “assess the probability of an event by the ease with which instances or occurrences can be brought to mind”.
Profit warnings are always high profile, highly discussed and very painful shock events - especially when they are in widely owned, stocks. As a result there’s normally an outpouring of grief in the comments section of the blogs, and the ensuing heated discussions are more likely to permanently wire up the synapses that lead to long term memory. Sudden impact events and our heightened emotional reaction to losses lead to much stronger memories.
Kahneman has also shown that we feel the pain of losses more than 2.5x as much as the joy of gains. As a result we never discuss our winners with quite as much passion, even though there have been almost four times as many of them. Stock market gains accrue slowly (over the course of the year) while stock market losses often happen all at once (often in market crashes or profit warnings). It’s for all these reasons that we just can’t remember the winners with quite as much vividness as the losers.
Over-excited and over-crowded ?
What subscribers really ought to be asking themselves is this. What guided them towards investing in shares like Entu, Plus500, ShoeZone, China Chaintek and Indigovision (which have been higher profile under performers), rather than investing in the high ranking shares that have done really well (like STM, JD Sports, International Greetings, Alliance Pharma, Empresaria, Adept Telecom, Redde, and all the other dozens on the attached spreadsheet) ?

Peter Lynch wrote a whole chapter about the ‘perfect stock’ in his classic book One Up on Wall Street. In Chapter 8 he explained how he loved dull and/or disagreeable stocks in “no-growth” industries. “I get even more excited when a company with a boring name also does something boring.”
But very few of us act like Peter Lynch. We appear to be hard-wired to favour stocks with more exciting or controversial stories. Stocks like ShoeZone, Plus500 and China Chaintek are examples of this. We ignore the boring dull companies that are also on the lists because we just can’t imagine getting rich in them.
More exciting stocks lead to more discussion, and this extra discussion creates a form of ‘herding bias’ into the kinds of stocks which may be the least likely to outperform. I have commented on this concept regularly and it seems the Stockopedia community is not immune to it either.
Getting beyond errors in statistical thinking
As I mentioned at the start of the post I’ve written an extensive guide titled “How to Think about High StockRank Stocks”. I wholeheartedly think everyone using the StockRanks should re-read it and re-read it again. DX Group calamitously profit warning does not mean there’s something wrong with the metrics. As shown above, the metrics are working just fine, it’s just that there’s something wrong with how we tend to use and react to them.
This phenomenon is not only isolated to Stockopedia - Joel Greenblatt found that investors using his Magic Formula website tended to pick the wrong stocks on the lists and ended up with worse performance as a result. While James Montier - in his epic post “Ode to Quant” linked to reams of academic research that showed:
The evidence is clear: quant models usually provide a ceiling from which we detract performance, rather than a floor on which we can build performance.
The StockRanks are statistical measures which work best for systematic investors across portfolios of stocks. They are not a short-cut for discretionary stock-pickers to do less research.
Ultimately everyone needs to understand that all stocks are speculative. Any stock, at any time, can be subject to sudden news that causes a calamitous fall in the share price. There is no magic formula in the world that can entirely weed out profit warnings from a portfolio. That's why it's so important to DYOR.In fact, dare I say it, but we should expect these kinds of occasional losers and structure our portfolio and risk management approach to handle them.
We’ve tried to structure the StockRanks to minimise the number of potential profit warnings amongst the highest ranked set, but it’s only through broad diversification (the one free lunch in investing) that we can diffuse their pain.
Disclaimer
This is not financial advice. Our content is intended to be used and must be used for information and education purposes only. Please read our disclaimer and terms and conditions to understand our obligations.
55 comments
Ed, I think Paul was right in his comment on DX to say that you may wish to fine tune what goes into StockRanks. I am surprised by some of the companies with high rankings.
DX operates in an awful industry, with all of the many players vying to get more marginal business to cover their high fixed costs. Remember Citilink which went bust last Christmas Eve?
Some sort of Porter style ranking would have highlighted this, and Paul's suggestion is to focus on balance sheet strength (? and free cash flow) and not just inexpensive looking PEs. I suggest that you include some more sophisticated factors.
Equally, a reading of their recent announcements and a study of their share price would have left you unsurprised by the warning.
At an office in Oxford a strangled scream was heard ...
Are any of these cashflow, balance sheet, profitability, trend, margin, earnings quality or leverage rankings sophisticated enough for you? http://help.stockopedia.com/knowledgebase/articles/182926-how-do-you-calculate-the-quality-rank
Paul was discussing the Value Rank. Let's not confuse the Value Rank conversation with the overall StockRanks.
This comment is actually brilliant. It really underpins one of the reasons why factor investing works. The StockRanks are just an implementation of factor investing (with the factors being Quality, Value and Momentum). The stocks most exposed to these factors are very psychologically hard for us to purchase. Good (quality) stocks are often too dull and boring to consider, cheap (value) stocks often have problems which we find repulsive, and stocks at new highs (momentum) have share prices that scare us off.
Who wants to buy dull businesses with problems that appear to be trading too high ?
We much prefer to buy the same kinds of familiar, popular stocks as everyone else. We have a psychological tendency to purchase stocks that offer average returns. But as John Templeton said...
I have tried to ensure that I do not invest in the low stock rank companies and for the most part the reason for the ranking becomes clear when you do the research.
But there also stocks where it appears that good companies are carrying surprisingly low rankings. Chesnara , stock rank 41 ,would be an example where it would appear that debt, which is part of its business model , is having an inordinate impact on its ranking for company that has shown a very respectable performance over many years.
Would you agree that some business models do not fit well with the rankings (wherever debt is at a fixed rate and matched to a fixed return as often happens in leasing for instance)? Or am I looking at Chesnara for example through rose tinted glasses and the ranking is seeing something I can't?
I tend to agree that the rankings do not always fit certain companies or its behind the times. I do hold Chesnara as it happens although I'm considering selling soon as its not performing. Another company that was lowly ranked was Inland Homes (LON:INL), performed very well but only ranked in the 40s, could not understand it but now since the latest figures its in the 90s but the share price has not moved up in fact its gone down but forecast EPS for next year is -59%.
I think stockopedia is a great tool for identifying stocks for further scrutiny and further investigation, it is not a tipster service, and shoukld not be treated as such. As they say frequently DYOR, it pays not to follow the crowd. I always try to think the worst scenario about a share. Another word of warning, beware of what I call professional NEDs. I have met a number in my time, and did not hold any of them in a high regard.
My apologies, some text got lost and jumbled in my previous post. I meant to write:
"But those rules still let you suffer a major shock in your portfolio. The performance of top decile StockRank stocks with market cap > £350m rebalanced every 3 months from May 2013 to November 2015 has been slightly worse, at +54%, than the +68% performance of top decile stocks with market cap > £10m, as can be seen on these graphs:"
I thought the following two sentences summed up the position brilliantly and should be written in large font across the top of every StockRank listings page:
That is such an important statement. Like others here, I'm using StockRanks as one element of a screen and seeking as much diversification as I can afford with decent position size - currently 17 holdings. That's fewer than I'd like but enough to avoid one or two under-performers pulling down the whole portfolio. A good spread of sectors also helps.
Hi - I am brand new to stock buying (bought my first ever individual stocks 2 weeks ago) and have had a baptism of fire by having DX in my portfolio.
After a lot of research on how to construct a portfolio, and building various different screens, I settled on a tweaked version of Ed's NAPS portfolio with the following criteria:
• The 25 highest SR stocks
• Cap >£20m
• Low spread <250bps
• No tobacco, pharma, oil or arms
• Diversified:
1. top SR stock from each of the 10 sectors with QR >80 and SR>80
2. if no stock over 80 in certain sector, skip that sector
3. then next top SR overall stocks, factoring:
? no more than 5 stocks <£150m
? no more than 5 AIM stocks
? no more than 5 stocks in any one sector
Based on my research the above feels like a balanced and diverse portfolio, but obviously based on Stock Ranks as my quant source. I plan to rebalance in 6 months.
Therefore, I was obviously quite surprised by what happened to DX, although I do understand Ed's article and many of the comments above. My hope is that by having a well balanced and diversified portfolio overall the performance across the 25 stocks will be positive. I do however have a few questions that have sprung from this:
- if I was to put in an additional filter (around Z score, current ratio etc) to try and weed out potential DXs in the future, is the feeling that this could as easily weed out some potential winners as well as losers? (think someone else asked this question)
- I understand the risks of stocks, but does a 73% fall in a single day represent a pretty severe punishment? Whilst the profit warning wasn't great, it doesn't sound DX is going out of business. (Please excuse my naivety)
- I kind of feel like I've lost most of my money on this stock now, if I sell I'm locking in those losses. Everything I've read though, says this kind of thinking is idiocy and is a common trap that investors fall into. However, whilst there were flags that my SR based approach didn't take into account, there is still some quality in this stock from the stock report I can see, and it certainly now represents very good value!! If I was coming to this stock afresh it looks like a decent QV play - is that just crazy thinking?!?! (Don't worry, I'm not asking for advice, just interested in opinions).
- On the day of the profit warning I was in meetings a lot of the day so before I knew what was going on it was nosediving. I had been led to believe that a terrible day was a 40% loss, so I didn't really understand what to do. Does anyone have any advice on how to approach similar situations? Not sure there is a right answer to this but having zero experience of owning stocks I'm unfamiliar with different tactics are on dealing with bad news
I guess as an investor you will inevitably experience bad times, but I just didn't expect to have one so soon and so severe. The good thing is that it's just one stock in my portfolio therefore not life threatening on its own. If it happens again soon though, I'll start to believe that Lady Luck has it in for me................
Cheers
Hi Nujonho,
I think your approach is a very sensible one. DX losing 73% of its value in one day was very unusual and very unlucky for you. However as you have 25 stocks in your portfolio, each stock represents just 4% of your portfolio's value, so a 73% fall in one stock means a fall of just 3% in the total value of your portfolio. That shows the benefit of diversification!
Your rules of having: "no more than 5 stocks <£150m and no more than 5 AIM stocks" are helpful in reducing the volatility of your portfolio, because small companies (and AIM stocks in particular) are much more likely to suffer such shocks than large companies. But those rules still let you suffer a major shock in > £530m rebalanced every 3 months from May 2013 to November 2015 has been slightly worse, at +54%, than the +68% performance of top decile stocks with market cap > £10m, as can be seen on these graphs:
http://www.stockopedia.com/stockranks/performance/?marketId=gb&field=_QVMScore_?=350&period=1&buckets=deciles
http://www.stockopedia.com/stockranks/performance/
However, those performance figures ignore the benefits of reinvesting dividends and the cumulative costs of trades when the portfolios were rebalanced every 3 months. Small companies tend to have lower dividend yields and higher bid-offer spreads than larger companies, so I suspect that taking those things into account would bring the cumulative performances close to each other. Therefore if you restricted yourself to stocks > £350m, I think you would greatly reduce the future volatility and risk of a 25-stock portfolio without much difference to your expected future returns.
Ed thanks for this article. It made me wonder whether boringness would be susceptible to quantification -- whether it cannot just be treated as another "factor". Q, V, M + B.
When I rank stocks using a spreadsheet, one of the things I look for it their "anti-glam" qualities. So, other things being equal, I'll be pointed away from stocks with a high CAPE, a high 5y and 3y price change, high beta, low dividend yield, and low rolling yield vs. 5y high. This nudges me towards boring stocks.
Could something along these lines (but much better, with proper empirical grounding) be calculated by Stockopedia? Presumably industry group, forecast growth, volume, and recent volatility might also be relevant.
It might be an idea to have an indication of short selling activity on the details page for each stock. The Financial TImes has this with an indicator for Low, Medium, or High short selling activity. High to Medium short selling would be a cause for concern. I don't know if they are good predictors of lower stock prices. A short look using Google and Google scholar did not produce any results.
The FCA publishes lists of companies being shorted at http://www.fca.org.uk/firms/markets/international-markets/eu/short-selling-regulations/notifications-disclosures
If you subscribe to IC, they also have a Low, Medium, High but I find the FCA one more useful as it also tells you how much stock is on loan and who by,
The FCA report only lists individual shorters > 0.5%.
A more accurate - but less timely answer can be found in the Euroclear stock lending report.
The free one is only updated once a month, but (I think) includes all stock lending.
I don't have references handy, but I've seen a few papers that looked at this and found out that short selling pressure indicators indeed do predict under-performance on average. It seems plausible: shorting is hard to do technically, with open ended downside and limited upside, so those who survive in that business have to be good at it (it's not an anomaly that's easy to arbitrage).
Re Stocko using the FT's indicator: it's a commercial product from MarkIt, so licensing cost would be an issue.
The FCA regulatory reports are free, though possibly a mixed bag in data quality terms (they don't necessarily show net positions, involve a possibly biased category of short sellers, and it's self reporting which can be error-prone).
It was I who suggested that a large number of high ranking StockRanks have had problems but of course I wasn't going back seven months. I wrote the following last week but as I couldn't find a suitable board to post it on decided not to bother but perhaps now is the time.
Chinese Disappearing Trick
Making mistakes is what stimulates the learning process in most of us, when everything is going in the right direction we sit back and reflect upon our brilliance no matter how minor. Losing money is just part of the investment game which we all have to endure but when it verges on theft it’s something else. There have been a number of occasions when I have suffered total loss, the one that always comes to mind was an EIS film company, chaired by a well-known and respected individual who spoke with Presidents, his name made it worth the risk, or so I thought at the time. On the scale of things the investment was small so I put it down to experience and did nothing. I also find it odd that there are a substantial number of VCT managers who having lost investors’ money are happy to claim a success based upon the tax relief given to the investor. Incompetence is what costs us all, but incompetence is not theft and we take the hit and move on.
I come from an investment world which is heavily regulated and the incompetence or dishonesty of others is paid for by the successful firms who are levied for all of the compensation meted out by the regulator, some of which is not entirely fair or balanced, but that is another story. It does of course lead one to the conclusion that all investment areas are regulated in the same way, but not so. That is a serious problem as ones guard can be dropped making for rich pickings for the unscrupulous or worse still the downright dishonest.
What I am about to say does not imply that Stockopedia or its owner managers are anything but honest hardworking individuals but:-
I subscribed to Stockopedia mid-2014 and was so impressed with the system that I immediately invested in two Aim stock with the highest StockRank, one of which, China Chaintek has disappeared and the other is down over 40%. The one that disappeared did so with a StockRank of over 80 and the figures looked good, so good in fact I bought more just days before the company delisted. Yes I feel foolish and thought my experience had taught me to know better. Fortunately I did heed the advice I once proffered and only invested an amount I could afford to lose but that is not the point.
This type of loss focuses the mind, so I searched the blogosphere and low and behold China Chaintek wasn’t the only Chinese company that had disappeared, there have been others and apparently it is a disease which is spreading fast. Many of you will recognise the pattern of events which appears to be that the company is launched on Aim and all is well until the Nomad resigns. A new Nomad cannot be found within the required 28 days and the company is delisted leaving the shareholders with zero.
How can this happen? The CV of the Non Exec Chairman on the company’s website is reassuring with a breadth of experience and international company board appointments. Additionally the most recent Stock Report, hence accounts, shows a large surplus of cash, plus profits and little or no debt.
Some of the wisest words I have read have been from Paul Scott the Small Company Guru on the Stockopedia site. But if he and others knew what was going on long before it imploded how come the Health Trend was 6, the Bankruptcy Risk Safe, the Traffic Lights all green and the Quality 98. I have recommended Stockopedia to a number of people and will continue to do so as I believe in what they are doing but it is essential that Stockopedia address this issue. It shouldn’t be necessary to have go to the blog to find what horrors lurk below the figures they produce or replicate.
We all know that the Nomad and non-execs are in place to protect the interests of the shareholders. But as I looked further into the blogosphere this is greeted with not only derision and suspicion but also with resignation that the investor having lost should move on. This appears to be the Wild West where instead of a gun for hire it is a name. Those who should be ordering the waggons to circle appear to simply resign the post and ride off into the sunset. It must stop.
I am not a Lawyer, I don’t know why this activity is not attacked by the authorities in the harshest manner, why Non Execs can wonder off unscathed, so perhaps one of you can tell me. Any information or help you can offer even if it is only to respond to the above will be appreciated.
Ken - I'm really sorry you got caught up in China Chaintek. We did try here to warn subscribers of the issues in the Chinese stocks as much as we could via the blogs but ultimately those warnings aren't in the table displays or on the main stock reports (yet).
Please though always remember the need to DYOR. We are doing everything we can on the quant side - but sadly there are some foreign companies that are so good at cooking their books that even the algorithms don't pick them up. China Chaintek is a classic example - in fact Chinese stocks in general seem to have a particular knack of skipping all the quant red flags.
The truth is that there may be a number of high ranking stocks that have issues, but there are an even larger number of lower ranking stocks that have issues. The difference is that the lower ranking stocks that have issues are less likely to be scandals - they are more likely to just be capital consuming junk stocks that go bust for normal reasons (e.g. running out of finance).
High StockRank stocks tend to be 'good, cheap' stocks. But corrupt/fraudulent companies will likely appear to be 'good' according to their books, and are most likely to be 'cheap' because smart investors will mistrust their books. So therein lies the issue... we may see a few scandals amongst high ranking stocks.
For part time private investors, there are only 2 ways to try to filter them.
Ultimately - the quant is a great broad brush... but it works from the top down. The need is there for bottom-up analysis too... We're trying to cover both sides... with the toolkit and the analysts. What we need is more of both and if we can grow the company the service will only get better - we'll find more solutions to highlight red flags manually on Stock Reports - or find more ways to use the 'social brain'.
Thanks for your comments - they are very helpful.
"Use rules of thumb - (mine are to invest in no foreign stocks, and avoid overly popular stocks) My own judgement about popular stocks & foreign stocks comes from painful experience - I got caught up in some popular Chinese AIM shares back in 2008 and lost a bundle."
I was fortunate to avoid Entu. I used the heuristic "no beards". And one of the management owned a rugby team (Sale Sharks?). Honestly that went into my decision making process. It took me 4 years to pass the CFA, but I think heuristics are more valuable.
I wouldn't just rely on heuristics, but stockopedia + heuristics. Great article Ed, big fan of stockopedia, keep it up.
"Use rules of thumb - (mine are to invest in no foreign stocks, and avoid overly popular stocks) My own judgement about popular stocks & foreign stocks comes from painful experience - I got caught up in some popular Chinese AIM shares back in 2008 and lost a bundle."
My own rules of thumb are to restrict myself to stocks that pay a dividend in the FTSE 100 or 250 indices and to avoid any stocks whose principal activity is in a dubious overseas country. I think my rules significantly reduce the risk of buying stocks in fraudulent companies (of which AIM seems to have a disproportionate number), although they do not completely eliminate the risk (e.g. Maxwell Communications). My rules might reduce the average return of my portfolio to some extent, but they help me to sleep better at night!
Thank you Ed for the advice it is accepted. Regarding the statement that set off this whole debate and which your title piece countered My experience of the SR system was in fact 100%, two out of two, these investments at the time of purchase appeared to be "wonder stocks" according to the SR and supporting statistics. Now that I know better and I am not really complaining about the loss, how can I trust the system in the future and without trust what is the value of any system? Not investing in non UK based managed and controlled stock is a given, so it must rank high as a problem to consider but this is not reflected in any of the rankings.In order to satisfy those who may be thinking, but not vocalising my fears, why not look to see how many stocks had a high ranking two years ago and what proportion of those stocks have disappeared gone bust or become disasters lately. Let us say that 20 stocks have a ranking between 95 and 100 and five fall into the category that makes 25% which is a high number. As I said in my piece 28 above I think the StockRank system is very useful and I want it to survive but the quiet majority is what decides if companies survive. Please take all of what I have said as constructive, we all want a system we can trust, it wont be perfect, nothing is, all I am doing is due diligence which is what you would recommend as a prudent investor.
Ken - it's incredibly unfortunate that you've selected 2 of the worst performers in a set of shares that have done remarkably well. I hope that this article does at least help restore your faith in the StockRanks and illustrates how best to use them. You can of course review the StockRank performance at any time at this link.
We offer tools, data and education here, not personal advice, it's up to each subscriber to DYOR and decide on the strategy/approach that suits them based on their own risk profile. That said, we have repeatedly stated our own view that the way to wealth in the stock market is to buy broadly diversified portfolios of shares that have strong exposure to the fundamental and technical factors that are shown to pay off. It's vital to focus on diversification - the only free lunch in investing - to ensure that the inevitable losers are outnumbered.
I have done as you asked. I've taken the 2013->2014 batch of original high StockRank stocks and looked at them over a 1 year holding period. That year was a good one for the market and the All-Share rose about 9%. The top decile of StockRank winners rose about 40% on average.
Of the 133 stocks above a £10m market cap... there were 120 winners and 13 losers. I don't think there was a single stock in that set that went bust. You can again review the spreadsheet at this link.
The truth is that 2015 has been an annus-horribilis for many in the stock market. This year we've seen many of the sinful companies washed away - there have been more frauds and dodgy stocks washed out than I can remember. We shouldn't extrapolate this year to the previous years - I do though imagine that a really bad bear market year such as 2008 could be far worse.
I've always thought of Stockopedia as a community project so all feedback is highly welcome. Given your feedback - I would like us to move towards 100% data transparency so that all of the above StockRank holdings data can be reviewed in the browser. I do though ask for patience as implementing this may take a long time. In the meantime I'll be as transparent as possible in posts such as this.
Ed , I joined you June 2014, so what happened before that date I know nothing about, I am sorry if an analysis of the last eighteen months doesn't help your case. As you say 13/14 was a good year. The industry is full of promoters who promote the right points on the graph, sadly that is not real life. Your original piece mentioned six disasters but there are more. My question is simple Since April 2014 to the present day, how many stocks with a ranking of SR 94 or better have gone bankrupt disappeared or been disastrous. You promote the SR system and of course the majority of the stock will follow the market trend, what I am getting at is - what percentage of those who are given the highest accolade don't. I have experienced the 1975 market collapse, 1987, 2000, 2008 but I have never seen a fall of 75% in one day as a result of a trading announcement. Paul Scott said last week that he believed many Aim shares were over valued I wonder how many stocks with a SR95 Paul would actually buy. Sadly not all your subscribers are as expert as some of those on this blog so human frailty being what it is why should they not buy the top twenty ranked SR stock? I can think of a good reason if it contains 25% that are disasters. Hindsight is always a winner..
Ken - I've really tried to answer your questions in as much detail as I can. I've put together a bunch of spreadsheets and shared them. But if you really want to know the hit-rates within each decile I suggest you read my latest blog which goes into a lot of detail. http://www.stockopedia.com/content/if-you-want-to-win-at-the-races-you-need-to-know-your-odds-112164/
The "natural' losers in the portfolio and, more specifically, the likelihood that the average investor will not be well-diversified across the spectrum of top-ranking stocks is probably the reason why the strategy will keep working.
Good article......
Ed - I going to say it for the nth time: please re-examine Value Rank. It ignores weak balance sheets - e.g. pension liabilities.
see my comments on Wincanton http://www.stockopedia.com/content/stockrank-movers-june-9th-wincanton-super-stock-or-false-positive-100734/
"Isn't value rank based on EV which ignores various liabilities - e.g. WIN's pension liabilites?
In my view Value rank needs to be re-examined in light of the balance sheet weakness of WIN still producing a high value rank. "
Please adjust your EV calc to include such liabilities:-
EV calc which includes e.g. pension liabilities to give a more representative/useful metric:-
Http://valueandopportunity.com/2012/07/03/how-to-correctly-calculate-enterprise-value/
note:-
"It is therefore no wonder that with a “standard” EV/EBITDA screener, often UK retail companies with huge (underwater) operating lease and pension commitments show up as “cheap” and then people are surprised that they go bankrupt soon (Game Group anyone ?)." - See more at: http://www.stockopedia.com/content/stockrank-movers-june-9th-wincanton-super-stock-or-false-positive-100734/#sthash.UO5k97Tr.dpuf
The value rank only looks at typical valuation metrics - PB, PS, PCF etc:
http://help.stockopedia.com/knowledgebase/articles/182732
The quality rank is the one that deals with areas such as poor balance sheets. In addition to considering factors such as sales growth and ROCE, it considers fundamental momentum (with the F-score) and bankrupcty risk through the Altman Z-score and leverage measures etc:
http://help.stockopedia.com/knowledgebase/articles/182926-what-is-the-qualityrank
Due the ranking methodology, a weakness in one area can be made up for by strength in another, leading to stocks with a poor balance sheet that have high value/momentum scores deserving higher ranks. The system does not claim to accurately identify all bad companies and never will. There will always be stocks in the top 90 that some people think are poor companies and equally there will always be companies in the bottom 10 that some people think are the next big thing....this is no reason to change the methodology though. It works (well) by being right on average...nothing more.
Tom
"There will always be stocks in the top 90 that some people think are poor companies and equally there will always be companies in the bottom 10 that some people think are the next big thing....this is no reason to change the methodology though."
Well this is self-evident - but since when was stockopedia about investor sentiment? I thought it was about screening, metrics, cold-hard data and basing investment decisions on the logic that there is a high probability that what has worked before will work in the future.
I am not asking to change the "methodology" (meaning: a set or group or methods). I am asking for Enterprise Value calculations as used in Value rank to take into consideration liabilities (e.g. pensions) which can distort massively the perceived book value or plain value of the stock.
Hi Dasv - There's always improvements we can make to our metrics. I will say that we are currently working on both operating lease and pension liability data - that will be addressed in due course.
You can vote on adding this data in the suggestions forum - pensions liabilities gets a lot of votes.
The ValueRank seems to get up people's noses the most. Paul Scott hates it too, but there's no doubting it's effectiveness.
When we analysed the impact adding the balance sheet liabilities to Wincanton's Value Rank we found that it would have dropped the overall StockRank down from 98 to 95 - so it's a bit of a storm in a teacup. Wincanton everyone hates - but there's no doubting that it's been a huge Value & Momentum winner - it's up another 25% year to date in a year when the average portfolio is very much down. For all I know it may go bust next year, but there's been money to be made in the meantime. Couple of quotes... "there's being right and there's making money" or Keynes "the markets can stay irrational longer than you can stay solvent".
Regarding operating leases... I remember back in 2012 JD Sports was coming top of the Screen of Screens and looking great across standard metrics. But all the Value Investing bloggers were fretting about how they couldn't buy it because if you capitalised the Operating Leases it was much more indebted than it first appeared. That's proven to be a rather expensive worry.
I do agree there's a lot of zombie companies lying around... and I do agree that we need to improve some of the core metrics. 2016 is going to be a big year of changes here - the data library will be evolving dramatically and the StockRanks composition is going to change. So please stay patient.
I'm glad these ranks are a work in progress. The problem I guess is that if you change them you will have to retrospectively re-compute historical ranks and add caveats to previous stock rank articles - that the article was based on the ranks as calculated at date x etc.
Which reminds me - is there any progress on back-testing on Stockopedia? I understand at least one screening platform offer this.
The example of JD sports rising does not prove that it is OK to have invalid ranks or ranks which omit pertinent data. To prove that point you'd have to make a statistical case and a single example doesn't cut it.
with regard to the quotes ""there's being right and there's making money" or Keynes "the markets can stay irrational longer than you can stay solvent". - yes the markets can be inefficient but you can't have it both ways: arguing that a methodological approach is superior (use screens, use stock ranks), but then argue that in fact we should be non-methodological and buy any old junk balance sheet just because it might go up.
So you either attempt to build the best metrics you can and or don't bother.
Personally speaking, sticking to my own custom screens on stockopedia has allowed me to consistently beat the market and also take much bigger positions in a smaller set of stocks. I believe in having a system. I don't say - well the system is correct some of the time but other times I will second guess it. If the system is wrong, then I fix the system.
I am struggling with the idea that the stockranks are wrong because of specific individual outcomes. Stockranks are a probalistic system of improving average results, not a garuntee of good outcomes for a specific stock. I don't think you can have a system that always avoids a turkey, the real world is too complex with a wide range of possible outcomes which are not possible to predict with 100% certainty - especially for an individual case.
The hypothesis (Ed please correct me if I am wrong) seems to be that as a group, high ranked stocks will out perform low ranked stocks (stock picking from amongst the best base case). So far this has been the case with the caveat that we have insufficient data and time period to conclude that Stockrank outperformance is statistically significant and it is probable that we can never be certain that Stockranks will continue to work even if they are proven to have worked in the past.
That said if there are evidence based examples of how the system can be tweaked - either for better total return - or other outcome (such as reduced volatility) I am all ears.
On that theme I would be keen to see Stockopedia to be looking for measurable factors to test out on a propective basis to keep the model improving.
I think that this maybe a helpful article for the basic concepts involved. https://learnandteachstatistics.wordpress.com/2013/12/16/deterministic-and-prob-models/
On this note - I'm always careful with wording - as one can never predict the future. I would say this:
There are good risk and behavioural based reasons why the premiums to value, momentum, quality (and other factors like low volatility, size etc) may continue... but it cannot be guaranteed.
Underperformance must be expected at some point and quite likely for an extended period of time. I'm bracing for it and the possible criticism that comes with it - but I'm quite determined that we remain steadfast in our philosophy.
Great article, but who is going to buy 142 shares? If you do buy them, what are the costs and the associated effect on your overall performance?
If you don't buy 142 shares, how are you narrowing down your selection? Are you doing this randomly? If you narrow down the selection completely at random and select only 20 shares (apparently an optimal figure), what is the performance over the period?
If you don't do the narrowing down randomly then is your choice not subject to some psychological biases?
Wherever you look you are influencing your choice based on subjective decisions. Does that not then make your performance figures unachievable.
Nice idea, but IMHO only on a spreadsheet.
Rgds
You don't need to buy 142 shares. I've just built a random portfolio generator in the 2nd tab of the same spreadsheet. It selects 25 stocks at random from the list of 142 and generates the portfolio return. I suggest you give it a go. I've just refreshed it 70 times and only found 2 portfolios that created a negative return, 10% of portfolios returned more than 20% - I've yet to find one that does worse than the FTSE All Share. The spreadsheet is here: https://docs.google.com/spreadsheets/d/1CtRPZcEwXK...
I've written previously about how many stocks to own in a portfolio to have good odds of earning the decile returns - you can read up here. I came to the conclusion that 25 is about right to be sure that your margin of error isn't too high... though there's good arguments to own up to 50 if you have a large enough portfolio.
Random portfolio construction actually does very well. In fact I think it does better than most people's picks. A monkey with a pin picking out of the set of high StockRank stocks actually is a pretty good strategy. The problem is that most feel they have to super-impose their own free-will onto the deterministic model.
Buying 25 shares is not going to be that expensive - but it does depend on the market cap and liquidity. The typical bid-ask spread varies quite a lot and can be investigated at this stock screen. The median spread is 1%... the mean is skewed upwards by the higher outliers to 2.1%. I think it's reasonable to expect a bid-ask spread of not much more than this in a random portfolio.
Yes I think it probably is. While I try and keep completely systematic, my own selections are invariably affected by my own biases. I feel that I shouldn't buy micro-caps as I've been burned in them before. I'm also something of an F-Score nerd, so I really don't like owning low F-Score stocks. I also won't touch foreign listed AIM shares due to some bad times in 2008 (that's a bias that is definitely helping though as it's kept me out of Globo and Plus500).
Not really. There are lots of subscribers having great success with systematic or semi-systematic processes. Check out GrinderTrader's posts or how Phil Hoffer's strategy has been doing - his Fantasy Fund mirrors his personal account - I wish more people would be willing to share their stories publicly. My own New Year NAPS portfolio is up 35% year to date. I've done better in my personal account YTD (+50%) but that's due to an extension of this approach both through extensive shorting and also the addition of international (US & European) shares.
I am though preparing for payback - the markets surely can't be this inefficient... can they ?
Hi Ed,
If I get the time I will write up my (limited) experiences and performances to date. It has taken me time to move over towards a systematic approach based on stockranks, and I have fiddled and over dealed since then. I am also struggling with how to manage monies allocated over 4 fractured pots SIPP and ISA for myself and my wife.
In my ISA which has benefited from the going sytematic first (April), I am up around 15% from April. Prior to the blow-out in DX, this was 21%. My SIPP is up 17% since Feb (a lot less systematic), but is horribly volatile due to its' small size and limited number of positions.
I would like to think that I am starting to learn, both theory and practise.
What if there were no profit warnings in the top Stockrank stocks? Wouldn't this actually be a cause for concern? i.e. the Stockrank was too good to be true.
Shouldn't the comparison be - what is the frequency of profit warnings in the top Stockrank cos versus those not in the top Stockranks?
And what if the Stockranks were that good that there were never some 'failures'? Wouldn't large numbers of people just simply start letting the Stockrank do all the work choosing stocks and you eventually end up with the edge that the Stockranks gives you diminishing down to near enough nothing?
Just out of interest over the same period, the small cap index was up 1.7% and the fledgling 12.9%
What have you identified in retrospect that would have led you to avoid purchasing Elementis? With DX it is easy, the Altman Z score is in the distress zone. It may be possible to explain the Z score and perhaps somebody will, but it would have given me pause for thought.
I suspect it may prove very difficult to identify conclusively what might have been a clear indicator that DX, or any other stock was "dangerous". It's easy to say in hindsight the Z (or any other indicator) would have shown it up. The problem is that if you analysed things fully, all possible indicators that you might consider over all possible purchases I'd be fairly certain you would find many with bad Z, or whatever, scores that went on to do very well. So you have to factor in that, yes, you might have avoided DX, but you would probably have avoided several winners to. Which leads to the only question that matters: would your portfolio performance have been improved or worsened by additional screening on Z?
Any attempt at back testing (or forward testing) the use of indicators can only be meaningfully done statistically on large samples of trades. You can never expect to eliminate all disasters unless you eliminate a lot of potential successes too. You have to accept that the use of such studies will never tell you anything about the performance of individual trades, other than as probabilities, and that any application of them can only be done through a portfolio approach, and the only result worth paying any attention too is the overall portfolio return.
Peter
There's much disagreement on this. Personally, in a recovering economy I'm happy to own 'distress zone' companies if they have high Quality Ranks in other regards. This has served me well in various controversial stocks like Wincanton etc. There's a theory that you can buy 'turnaround' shares with weak balance sheet indicators as long as they have improving fundamental and/or price momentum. That's the underpinning of the Piotroski F-Score research and most of the Value & Momentum strategies.
The book Quantitative Value goes into some research about whether to use the Z-Score or not as a quality factor. I don't have it at hand but they found it helped returns by a percent or so. Their basket was a large cap basket though - so presumably amongst small caps it could help even more.
The time to ditch distress zone Z-Score companies is whenever you think the economy is starting to stall and bank or market finance might dry up. Of course macro market timing is insanely difficult to do well.
China Chaintek is in the spreadsheet as -38.8% but it should be -100%.
What is significant about 31st March 2015 as a starting point ?
Johns - I chose 31st March as it's a preset in the StockRanks performance portal and I can export the data easily. Also 7 months is a good time period to be relevant to most people's recent purchases and enough time to see the spread in returns. I could have picked any 3 month or 12 month period since the StockRanks launch and we'd have seen the same kind of returns. I'm happy to run the exercise again.
DX wasn't a high ranked stock back in March so it didn't make the set - but in the last quarter it is by far the worst performer.
In defence of the Quality Score, I think it is dangerous to retrofit scoring criteria after the fact. You just end up with strategies that "work until yesterday". People are going to have to either accept that, like all systems, they are inherently "noisy"; or else they need to do their own overlay, like avoiding recent flotations or AIM.
Maybe the ranking system works better as an exclusion filter: reject where value is clearly poor and quality and momentum is low,
Hi Ed
A very fair rebuttal.
Although it is very early days, and hence we are dealing with a relatively short time period, what really astonishes me is the returns that one can produce using Stockranks as the basis for a diversified share portfolio. Antony Bolton and Neil Woodford (the UK's top "star" fund managers over the last thirty years) built there reputations by outperforming the Footsie All share by a few percent per annum To date, by comparison, stock ranks is proving exceptional .
Of course, any quantitive system depends on the reliability of the data input (garbage in, garbage out). I would suggest any serious investor has to view any share on the AIM market ultra critically, given the lack of regulation of the AIM market, and its history of producing negative investment returns since inception. A useful, additional methodology (when using stockranks and as the basis of a portfolio) would be is to examine with scepticism any suggested AIM stocks, particularly any foreign-based, AIM listed companies. Combining the seven "higher profile, underperformers" and "disasters" mentioned in your article, six are (or were) AIM listed and two were foreign-based, AIM listed companies.
One change I would request, and which should assist Stockopedia subscribers avoid small company investment "mistakes", is that you change your policy and allow Paul Scott to comment on shares in which he is short. You recently praised Paul (quite rightly) for his analysis of Globo. However, that analysis on Stockopedia was intermittent over time, given that Paul was unable to comment when he was short. There are several other examples of this past, intermittent reporting.
Keep up the good work.
David Talbot
David - I'm actually working on a big post for the site called "the StockRanks and the Christmas Turkeys" - where I explore whether we're all being fed giant sized returns ready for pending slaughter. There's certainly a small cap skew in the top StockRank decile returns and
a heavy cyclical/industrials skew too.
It's been an expansionary environment and just possibly the regime has been very kind to the StockRanks... if this reverses we could certainly see a reversal in the payoffs - where low ranking stocks have some time back in the sun and high ranking stocks suffer. I'll elaborate more on this in due course in a fuller blog post.
Regarding Woodford/Bolton et al... you have to remember that those guys run massive/giant funds. Due to their scale they are less able to pick up the great returns available at the smaller end of the market. They often can only build positions by taking contrarian positions in larger stocks and patiently accumulating. Being a good contrarian is immensely hard and takes far more due diligence as you have to be 100% sure you aren't buying a possible Tesco Value Trap - you need a good analytical team to be sure. Small investors have very minimal market impact so can ride the momentum generated by the larger players in the market - we should be able to achieve higher returns.
There's been lots of great research by Mark Carhart and others that have shown that the best fund managers didn't necessarily add any alpha (on average) - they just stick more closely to the factor payoffs. As Andrew Ang would say "How much of a manager’s performance is alpha and how much is factor exposure?". If these guys are right then I believe that as private investors we should be able to match or better the kind of returns that Bolton, Woodford, Hargreaves, Slater and others have managed systematically. Otherwise what's the point of all this effort? ;-) (I am seriously afflicted by confirmation bias).
I'd love to change the policy on short selling editorial if it weren't for the fact that it generates so much abuse and vitriol from the investor community at large. When we ran more shorting comments it became a huge time-sink and PR headache - the cost/benefit equation just didn't work out. I think we can look at this again in future. Certainly we'll be publishing a lot more commentary in future about the short selling positions of funds and other larger shareholders - so there's scope for the policy to change.
Hello Ed
Thank you for your reply to my earlier post.
I would very much hope that you do look again at your short selling editorial policy.
I find it quite baffling the abuse and vitriol generated by some vocal (but usually uninformed and blinkered) individuals holding shares which someone else suggests is a sell or a short. If necessary, such individuals can revisit their research and agree to disagree, but why the abuse?
Although their reactions are very distasteful, why should this vocal minority in effect censor Stockopedia and deprive the vast majority of Stockopedia subscribers of the unfettered opinions of contributors such as Paul Scott?
Best wishes
David Talbot
Great article Ed
What I've found dangerous is the extent to which stock rankings skew my attitude to in depth drains up research, for instance I purchased a modest slug of Elementis to act as precursor to a larger size position , it had a very high stock rank 98 or so I think , and rewarded me by promptly issuing a profit warning and losing me 25 % of my capital. In the gap between purchasing and profit warning I never ever quite got around to doing my full analysis as I'd always got other priorities ...and because in my sloppy muddle headed assumption it was "safe" as it had a high stock rank!
More fool me ..
rhomboid1,
What have you identified in retrospect that would have led you to avoid purchasing Elementis? With DX it is easy, the Altman Z score is in the distress zone. It may be possible to explain the Z score and perhaps somebody will, but it would have given me pause for thought.
Hi David
I was trying to diversify away from the oil and gas sector, unfortunately Elementis has significant end user markets in just that sector. So a basic failure on my part!
I second that JoeRussell.
Couldn't agree more, Ed.
Thanks for a very timely article Ed. The comment that stands out for me is this one:
"The StockRanks are statistical measures which work best for systematic investors across portfolios of stocks. They are not a short-cut for discretionary stock-pickers to do less research."
To my mind this is a critical point regarding use of the stock ranks but therein lies the dilemma: I'm not in a position to set up a portfolio containing all of the 90+ stocks and even if I was I probably couldn't bring myself to buy some of the shares in that group.
So instead I (like many others probably) try to narrow the field by only considering shares which pay a yield, have been listed for 5 years or more and also meet a few other criteria. I understand that this is likely to reduce my potential return (i.e. I'm detracting from the ceiling performance) but hopefully it'll winnow out some of the new-ish companies which have crashed and burned.
However what I would like to see Ed is a piece which compares the performance of the 90+ group with that of a smaller group filtered to include only those which pay a dividend or only those which have been listed for 5+ years. I'd find this interesting if only to indicate just how much potential return I could be losing.
Damian
Agreed that it would be nice to see some different groups like that although I think the differences over the few short years the StockRanks have been going wouldn't be sufficient to draw any kind of conclusion from.
For example, just now I was curious to see how the performance would have been impacted by only buying the smaller stocks (given that they tend to outperform). So I deleted the rows containing the companies with market caps over £1 billion....overall performance deteriorated to 10.4%!
I seem to recall reading about IPOs underperforming on average so maybe a minimum listing time could be worth considering. I would have thought that most of the worst IPOs/newer companies would not have made the top decile due to poor valuation/quality metrics though so it's hard to say if it would improve returns if simply added on top of the criteria already used by the StockRanks.
Tom
Good points Tom and of course I could just hack the spreadsheet about to see how these filters look.
On the IPO I tend to think that the reverse is true in that new listings are often window-dressed for sale and in some cases come loaded with a very attractive yield - so I think that they wind up with decent rankings despite the lack of history. Then again this could just be availability bias talking!
Damian
Two points:
I have noted that when punters make money from a share they always forget who gave them the tip and take the credit themselves: when they go wrong they always try to find someone else to blame.
Second, losing money is proportionally more painful than the pleasure of making it.
May I recommend to Ed to recall Churchill's comment to Roosevelt in the dark days of WW2: "KBO: Keep Buggering on", and sod the critics.