Final Results
The information contained within this announcement is deemed by the Company to constitute inside information as stipulated under the Market Abuse Regulations (EU) No. 596/2014 as imported into the laws of England and Wales by virtue of the European Union (Withdrawal) Act 2018 (as amended) and certain other enacting measures ("UK MAR"). With the publication of this announcement via a Regulatory Information Service ("RIS"), this inside information is now considered to be in the public domain.

28 May 2026
MicroSalt PLC
("MicroSalt", the "Company" or the "Group")
Final Results for the year ended 31 December 2025
MicroSalt Plc (AIM: SALT), a leading manufacturer of full-flavour natural salt with approximately 50% less sodium, is pleased to announce its final results for the year ended 31 December 2025 ("FY25").
During 2025, MicroSalt made significant progress in the commercialisation of its revolutionary low-sodium salt technology across North America, Canada, and Mexico. The Company secured recurring purchase orders for its bulk products across multiple food categories, while continuing to invest in R&D initiatives to further expand product applications and capabilities.
A key milestone was achieved in late 2025 with the establishment of recurring revenue streams tied to one of the world's most iconic international snack brands, in partnership with a leading global food and beverage company and a major international seasoning and flavour supplier.
Financial highlights:
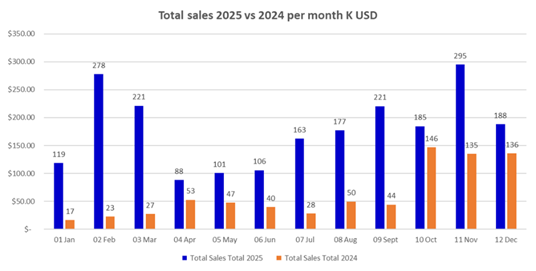
· Revenue of US$2.1 million during the year (FY24: US$0.75 million), an increase of US$1.4 million, primarily from higher B2B sales volumes.
· Net loss reduced to US$3.2 million (FY24: US$5.8 million), primarily as a result of increased revenue, improved operational efficiencies and reduced administrative expenses.
· Successfully strengthened the balance sheet with two equity fundraises during the year, raising in aggregate US$5.6 million. This has allowed for inventory build and continued R&D expenditure along with continuing sales and marketing efforts.
Business highlights:
· Repeat purchase orders totaling US$1.16 million were received from Customer 1, the Mexican division of one of the world's largest beverage and snack food companies, alongside an additional US$189k from its Canadian business unit and US$191k from its US operations. These recurring monthly deliveries demonstrate growing demand and are expected to increase further throughout 2026 and beyond. MicroSalt also secured repeat purchase orders totaling US$245k from the North American business unit of this leading global beverage and snack food company. These initial orders support a broader North American rollout planned for late 2026, with projected volumes expected to grow to approximately US$2.6 million in 2026 and US$8 million in 2027.
· Strong momentum continued with the world's largest spice and seasoning company, which placed repeat orders totaling US$54k for its Canadian division. Since volumes commenced in Q3 25, demand has continued to accelerate rapidly, with encouraging opportunities for MicroSalt adoption across additional international markets.
· Signed a 48-month Joint Development Agreement ("JDA") with Customer 3, one of the world's largest beverage and snack food companies, that that has allowed for a significant increase of MicroSalt exposure internally and has led to important long-term development opportunities worldwide.
· Selected for inclusion in two new frozen pizza products with a major food manufacturer, with launches targeted for retail distribution across the US in mid-2026. This represents a major development for MicroSalt into a new category.
· R&D initiatives continued to drive the expansion of the MicroSalt product portfolio through the development of new carriers and customised formulations designed to broaden application opportunities across multiple food categories. These innovations are helping to simplify and accelerate customer reformulation efforts, supporting faster commercial adoption.
· During 2025, successfully participated in 830 million servings of healthier food, demonstrating increased commercial adoption of our technology and reinforcing our commitment to lowering sodium worldwide.
Post-period end highlights
· Sales through April 2026 totalled US$1.0 million which is an increase of US$.3 million over the same period 2025, despite being impacted by severe weather during February that temporarily limited some shipment movements.
· Continued expansion with the addition of a strong regional seasoning company in the UK placing two initial orders for use with UK based food manufacturers.
· Rollout of MicroSalt Fibre as its next iteration. Fibre has become an increasingly important nutrient as GLP1 diets can be fibre deficient, allowing MicroSalt to have an enhanced impact on the nutritional properties of product by adding fibre, in addition to reducing sodium consumption.
· Continued pipeline strengthening with significant volume customer prospects at advanced stages with a range of national and multi-national companies with scope for MicroSalt to be nominated as a supplier on larger product lines once established with these key customers.
Rick Guiney, CEO of MicroSalt, commented:
"MicroSalt's strong progress is clearly demonstrated by the significant revenue growth achieved during 2025, momentum that we expect to accelerate further throughout 2026, 2027, and beyond. The successful reformulation work completed with several of the world's leading snack food brands provides the Company with increasing confidence in long-term revenue and commercial expansion.
Reflecting the rollout plans already underway, we are updating our FY 2026 sales guidance to US$4.5 million. This adjustment is driven solely by the anticipated timing of production associated with the 2027 launch schedule and does not reflect any change in the strength of the underlying demand outlook, customer commitments, or the 2027 revenue projections.
We are extremely encouraged by the continued growth of the MicroSalt product range and its expanding acceptance within the global food manufacturing community. Our growth trajectory is being demonstrated through increasing sales volumes, a growing number of product applications, expanding geographic reach, and broadening R&D initiatives designed to unlock even greater commercial opportunities.
In addition, continued regulatory focus and consumer demand for lower-sodium food solutions are acting as powerful catalysts for growth, positioning MicroSalt to capitalise on significant opportunities both in the US and internationally over the short and long term."
For more information, please visit www.microsaltinc.com, follow on X @MicroSaltPLC or contact:
MicroSalt plc
Via Gracechurch Group
Rick Guiney, CEO
Zeus (Nominated adviser and broker)
David Foreman / James Edis / Emma Burn (Investment Banking)
+44 (0)20 3829 5000
Dominic King (Broking), Rupert Wolfenden (Sales)
Gracechurch Group (Financial PR)
+44 (0)20 4582 3500
Heather Armstrong, Alexis Gore, Rebecca Scott
Notes to Editors
MicroSalt® produces a patented full-flavour, low-sodium salt for food manufacturers and consumers.
MicroSalt is a major potential disruptor in the food market, thanks to its micron sized particles which deliver the same sense of saltiness to a wide range of foods but with approximately 50% less sodium. Excess sodium consumption is a significant contributor to cardiovascular disease and MicroSalt's solution meets the rising demand for healthier alternatives to traditional salt. The WHO has set a target for reducing global sodium intake by 30% by 2025, which it estimates will save 7 million lives by 2030.
Each year, cardiovascular disease costs the UK £19 billion - if the average salt intake was reduced by one gram per day, it has been estimated that 4,147 lives and £288 million would be saved each year in the UK. As a nation, the UK consumes 183 million kilograms of salt each year, and 70% of the typical person's sodium intake is hidden in processed foods.
Operational since 2018, MicroSalt uses a patent-protected technology which helps create high barriers to entry within the reduced-sodium salt market.
The Directors believe that MicroSalt is well positioned to capture growth in the low sodium market, which is expected to grow exponentially, and that there is also scope to enter the larger salt market.
Chair's statement
I am delighted to announce, on behalf of the Board, MicroSalt's full year results for 2025. This was a transformational year for the Company as we secured large, recurring purchase orders for our bulk products and successfully completed the R&D for our new patent-pending product, MicroSalt Premium, designed specifically for the Quick Service Restaurants ("QSR") and Fast Service Restaurants ("FSR") sales channels. These milestones position MicroSalt strongly for accelerated commercial growth in the years ahead.
Strategy
At MicroSalt we are focused on commercialising new technologies that deliver full-flavour, low-sodium salt solutions for food manufacturers and consumers. The team has developed a patented process for producing micron-sized salt crystals that provide the taste consumers expect, with approximately half the sodium across a wide range of food applications.
These innovations arrive at an important time as the market increasingly responds to consumer demand for products that combine great taste with healthier nutritional profiles. Our products are now supporting both the reformulation of well-established products with proven commercial success, and the development of entirely new offerings. In several markets where sodium reduction initiatives have been in place for many years, MicroSalt is increasingly recognised as an effective and exciting new tool to help reinvigorate these efforts.
Board and Governance
As a Board, we remain committed to maintaining the highest standards of corporate governance and ensuring open and effective communication with shareholders. We continue to focus on executing the Company's long-term growth strategy while operating in a sustainable and socially responsible manner, supported by strong governance oversight from the Board of Directors.
Directors' responsibilities
The Directors' statement under Section 172 is included in the Annual Report and Financial statements for the year ended 31 December 2025.
Outlook
We are highly encouraged by the strong momentum heading into 2026, a year in which we expect continued growth in recurring commercial volume purchase orders for our bulk products. We have already received advance orders from Customer 3, along with additional confirmation that the 2027 rollout remains on track for an in-store launch in January 2027.
While the precise timing of full 2026 production volumes is still being finalised, we are updating our FY26 sales guidance to US$4.5 million. This adjustment reflects the anticipated production timing associated with the 2027 launch schedule, rather than any change in the underlying demand outlook. Importantly, we expect our monthly revenue run rate toward the end of 2026 to reflect the benefits of the full rollout, with continued acceleration anticipated throughout 2027. Based on the strength of current customer commitments and rollout plans, we continue to reaffirm our 2027 sales estimate of US$15 million.
Alongside the expanding application of MicroSalt across additional product lines for Customers 1 and 2, the Group has multiple significant product placement opportunities progressing at advanced stages with a range of national and multinational companies. The scale and nature of these customer relationships provide meaningful long-term potential, as approval on one product line can lead to expansion across multiple products and categories.
We also recognise the important role that leading brands play in driving innovation and shaping consumer expectations within their categories. In this regard, the breadth and diversity of our product application pipeline provide strong validation of the growing market interest in our technology and solutions.
Additionally, we announced the launched of MicroSalt Fibre, another important innovation in low-sodium technology. This advancement enables manufacturers to further reduce sodium while simultaneously adding functional nutritional benefits to end products, creating additional value for both customers and consumers.
We also anticipate additional growth of our MicroSalt products as a result of our continued groundbreaking research and development efforts, all targeted to accelerate the potential application of MicroSalt across numerous other sales channels. Included in this are methods for encapsulation and suspended MicroSalt in the delivery of bulk lipids.
Looking ahead, we believe the combination of our expanding commercial traction, differentiated intellectual property portfolio, and growing customer pipeline positions MicroSalt exceptionally well to capitalise on the increasing global demand for healthier food solutions. We remain confident that our technology platform, operational progress, and innovation roadmap will continue to create substantial long-term value for shareholders.
Key performance indicators
FY25 revenue increased significantly to US$2.1m (FY24: US$0.75m), reflecting strong momentum driven by a substantial acceleration in B2B sales beginning in Q4 24 and continuing throughout 2025. The net loss improved to US$3.2m (FY24: US$5.8m), underscoring the Company's disciplined investment strategy and progress toward scale. During the year, the Company made strategic investments in targeted R&D, including the successful testing of tapioca, gum arabic, potato starch and various fibres as alternative carriers, further strengthening its innovation pipeline. In addition, the successful launch of MicroSalt Premium in January 2025 and continued commercial efforts to build brand awareness within the B2B segment position the Company well for future growth.
I would like to take this opportunity to thank our longer-term shareholders for their ongoing support, and to welcome all our new shareholders. I would also like to thank our employees, suppliers, customers, and everyone who has, and continues to support our mission, our vision and the business.
Judith Batchelar
Chair
Chief Executive Officer's statement
Introduction
The Company's mission is to reduce excess sodium consumption, a major contributor to hypertension and heart disease, by delivering a full-flavour salt with approximately 50% less sodium than traditional salt for both food manufacturers and consumers.
To achieve this, the Group has developed a patent protected and scalable manufacturing process, producing a salt crystal that is approximately 100 times smaller than traditional salt. Due to its micron sized particles, MicroSalt demonstrates improved adhesion to food compared with traditional salt crystals and dissolves much faster on the tongue, delivering the same salty taste experience while using approximately half the amount of sodium.
In 2025, we continued to generate recurring revenues with one of the world's leading food and beverage companies across multiple countries, including Mexico, the United States, and Canada, as well as with a leading international seasoning and flavour supplier. At the same time, we continued to strengthen and expand our active B2B pipeline for future growth while introducing a groundbreaking product innovation that is already creating meaningful additional revenue opportunities for 2026.
During the year, MicroSalt positively impacted more than 830 million servings of healthier food, demonstrating the increasing commercial adoption of our technology and reinforcing our commitment to supporting lower sodium consumption globally. Specifically, we focused on two key initiatives:
· Working closely with existing and new B2B accounts to support the rollout of bulk MicroSalt across a growing number of product lines for international food manufacturers. This included expanding our presence within existing customer portfolios and increasing integration with seasoning and flavour manufacturers. Our go-to-market efforts continued to gain momentum across Asia, Australia, South Africa, the UK, Germany, Canada, Latin America, and South America, significantly strengthening our already substantial sales pipeline and contributing to increases in sales volumes.
· Completed R&D and final testing of our new patent pending product, MicroSalt Premium, designed specifically for the Quick Service Restaurant and Fast Service Restaurant channels. MicroSalt Premium expands our opportunity into foodservice applications including restaurants, hotels, hospitals, healthcare, and single-serve packaging, while also positioning the Company within broader lower-sodium initiatives across fast-food categories such as fries, bread, cheese, and chicken products. In the United States alone, over 4.5 billion pounds of French fries are consumed annually, including approximately 2 billion orders through the fast-food industry.
Looking ahead, we believe the Company is exceptionally well positioned for continued growth, supported by increasing sales volumes, broader application opportunities, expanding sales channels, and a growing international footprint. Continued regulatory and consumer focus on lower sodium food products is acting as a significant catalyst for growth both in the United States and internationally, further strengthening the long-term opportunity for MicroSalt as an enabling ingredient solution.
Financial summary
The Company generated revenue of US$2.1 million during the year (FY24: US$0.75 million), representing an increase of US$1.4 million, while reducing its net loss to US$3.2 million (FY24: US$5.8 million). These results reflect the Company's continued success in driving higher B2B sales volumes, improving operational efficiencies, reducing administrative expenses, lowering issuance costs associated with fundraising activities, and continuing to optimise the cost of goods sold. Importantly, our sales mix improved to 89% B2B, consistent with our long-term strategic focus on higher-volume bulk ingredient sales.
Additionally, the Company successfully strengthened the balance sheet with fund raises at the beginning of the year, in February and at the end of the period in December, totaling US$5.6 million. This has allowed for inventory build and continued R&D expenditure along with sales and marketing efforts.
Inventories decreased to US$0.6 million (FY24: US$0.7 million), predominately due to a decrease in finished goods due to B2B orders received in the latter part of 2025.
Trade and other receivables remained the same US$0.9 million (FY24: US$0.9 million), predominately composed by US$0.5 million of trade receivables.
Trade and other payables decreased to US$1.2 million (FY24: US$1.3 million), predominately due to delayed payments in the prior year as part of cash management required at the time.
Borrowings also increased to US$2.9 million (FY24: US$2.7 million), predominately due to increases in the interest related to the convertible loan notes issued by Tekcapital Group to MicroSalt prior to the IPO, offset by a repayment of the loan for $0.2 million in June 2025.
Operations summary
A major focus during 2025 was advancing several larger-volume B2B opportunities with multinational Fast-Moving Consumer Goods companies and food manufacturers. A number of these opportunities successfully progressed through R&D, production, and consumer testing phases during the year.
In particular, the Group continued as an approved supplier to Customers 1 and 2, which, while separate entities, operate under the same corporate group. Customer 1, which holds approximately 80% of the Mexican snack food market, continued using MicroSalt across three established snack products, generating approximately US$1.7 million in revenues during the year. Customer 2 also provided non-binding annualised volume targets across multiple product categories and geographic markets, reflecting growing confidence in the scalability of our technology platform.
Additionally, the Company finalised a four-year JDA with Customer 3, alongside additional product rollouts expected to commence in the second half of 2026. This partnership includes a new "tech stack" approach that positions MicroSalt as a foundational ingredient component supporting future flavour innovation and product development initiatives.
Sales and marketing
MicroSalt attended several major food industry trade shows in both the United States and international markets, which remains a core component of the Company's sales and outreach strategy. In addition to major U.S. industry events, the Company participated in trade shows and customer events in the UK, Canada, and Mexico.
These events provide valuable opportunities for live demonstrations of MicroSalt's capabilities and direct engagement with both prospective and existing customers. As a result, the Company continues to maintain a highly active and diverse sales pipeline spanning multiple geographies and customer segments.
The Company also continued investing in brand awareness through social media campaigns, LinkedIn engagement, newsletters, and customer education initiatives designed to showcase MicroSalt's technology and commercial capabilities.
During 2025, the Company implemented an integrated sales and lead follow-up system designed to maximise industry engagement and awareness.
Additionally, the Company appointed Gracechurch Group as its London-based investor relations firm to further enhance investor communications and outreach efforts. During 2025, the Company issued 27 press releases supporting increased market visibility.
Intellectual property
The additional patent application relating to the manufacturing process of MicroSalt Premium has also been filed and remains pending.
No other changes to our IP library occurred in 2025.
Political/regulatory update
The World Health Organisation ("WHO") has extended its target for reducing global sodium intake by 30% from 2025 to 2030, with estimates suggesting this initiative could save approximately seven million lives by 2030. WHO research also indicates that every US$1 invested in sodium reduction may generate approximately US$12 in healthcare cost savings related to cardiovascular disease treatment. Governmental pressure continues to increase across the UK, the EU, and Latin America with new regulations in Canada for 2026 regulatory efforts. Renewed High Fat Salt and Sugar efforts on the UK continue to focus attention of lowering sodium. Of the G20 countries, the following have active sodium reduction policies in place and are therefore natural target geographies for MicroSalt.
Canada
Mexico
Brazil
Argentina
Indonesia
United States
Saudi Arabia
Australia
United Kingdom
Turkiye
India
France
Germany
Japan
Italy
China
The U.S. FDA has issued initial guidance regarding proposed front-of-pack labelling related to sodium, fat, and sugar content. The FDA has also updated dietary guidance with increased focus on protein consumption and sodium reduction while eliminating petroleum-based food colouring as an approved ingredient.
We believe these developments will encourage food manufacturers to further evaluate sodium content across product portfolios, particularly as front-of-pack disclosure increases transparency for consumers. In addition, local dieticians, healthcare systems, and purchasing authorities continue to pursue sodium reduction initiatives independent of formal mandates, further supporting industry-wide momentum toward healthier food solutions.
Current trading and outlook
While 2025 represented a pivotal year of strategic execution and commercial expansion for MicroSalt, we believe the opportunities ahead are even more compelling as global focus on healthier food solutions continues to accelerate. In the 15 months to the end of Q1 26 we have impacted 1,137,452,302 serving of healthier foods.
· Q1 26 bulk sales reached a record US$710,000, including shipments into established markets such as Canada, Mexico, and the United States, as well as newly opened markets including the UK and Belgium. The Company expects that projected volume estimates provided by Customers 1 and 3 will contribute to increased volumes during Q3 26 and Q4 26. As the Company continues shifting toward higher-margin bulk ingredient sales, we expect additional margin improvements through scale efficiencies and to approach cash flow positive monthly performance sometime in Q4 26.
· Activity across our pipeline of prospective and existing customers remains strong, supporting our confidence in continued growth into 2027 and beyond. This includes expanded visibility and opportunities associated with the recently executed four-year JDA with Customer 3.
· The Company is also exploring the application of artificial intelligence ("AI") within quality control and product development processes to help reduce lead times, minimise production variability, and support customers in reformulating products as part of their sodium reduction initiatives.
· We have continued to add to our sales staff to specifically address the opportunities for MicroSalt Premium within the QSR/FSR market.
· Successfully launched MicroSalt Fibre. Fibre has become an increasing important nutrient as GLP1 diets can be fibre deficient, allowing MicroSalt to have an enhanced impact on the nutritional properties of product by adding fibre in addition to reducing sodium consumption.
The Group throughout 2025 and Q1 26 has continued to demonstrate strength across its operational structure, financing, intellectual property portfolio, market opportunity, and product acceptance, reinforcing our confidence in the Company's future growth potential and positioning as a leading supplier supporting the global shift toward lower sodium food solutions.
Finally, on behalf of the Board, I would like to express our sincere appreciation to all stakeholders who continue to support the business and contribute toward achieving our mission and long-term objectives.
Rick Guiney
Chief Executive Officer
Consolidated statement of profit or loss and other comprehensive income
Note
Year ended
31 December 2025
US$'000
Year ended
31 December 2024
US$'000
Revenue
4
2,069
750
Cost of sales
(1,982)
(1,188)
Gross profit/(loss)
87
(438)
Other operating income
5
-
3
Administrative expenses
(3,314)
(3,983)
IPO Costs
-
(1,430)
Operating loss
(3,227)
(5,848)
Finance income
8
6
Finance expense
10
(275)
(289)
Loss before taxation
(3,494)
(6,131)
Taxation
11
-
-
Loss for the year
(3,494)
(6,131)
Loss for the year attributable to:
Owners of the parent
(3,494)
(6,131)
(3,494)
(6,131)
Other comprehensive income
Items that may or may not be recognised in profit or loss:
Foreign currency translation differences
(252)
89
Total comprehensive income
(3,746)
(6,042)
Total comprehensive loss attributable to:
Owners of the parent
(3,746)
(6,042)
(3,746)
(6,042)
Loss per share for loss attributable to the owners
Basic and diluted loss per share (US$)
12
(0.07)
(0.13)
Consolidated statement of financial position
Note
As at
31 December 2025
US$'000
As at
31 December 2024
US$'000
Assets
Current assets
Inventories
15
591
714
Trade and other receivables
16
938
872
Cash and cash equivalents
17
1,908
261
Total current assets
3,437
1,847
Non-current assets
Property, plant & equipment
14
300
200
Intangible assets
13
525
498
Total non-current assets
825
698
Total assets
4,262
2,545
Liabilities
Current liabilities
Trade and other payables
18
1,176
1,348
Total current liabilities
1,176
1,348
Non-current liabilities
Borrowings
19
2,871
2,746
Total non-current liabilities
2,871
2,746
Total liabilities
4,047
4,094
Net (liabilities)/assets
215
(1,549)
Equity
Share capital
20
116
99
Share premium
20
11,842
6,183
Share-based payment reserve
1,174
1,340
Capital contribution reserve
500
500
Translation reserve
(157)
95
Accumulated losses
(13,260)
(9,766)
Total equity
215
(1,549)
Consolidated statement of changes in equity
Note
Share capital
Share premium
Share based payment reserve
Capital contribution reserve
Accumulated losses
Translation reserve
Total attributable to the company
Non - controlling interests
Total
equity
US$'000
US$'000
US$'000
US$'000
US$'000
US$'000
US$'000
US$'000
US$'000
At 1 January 2024
73
-
1,060
500
(3,635)
6
(1,996)
-
(1,996)
Loss for the year
-
-
-
-
(6,131)
-
(6,131)
-
(6,131)
Other comprehensive income
-
-
-
-
-
89
89
-
89
Transactions with owners
Issue of ordinary share capital
20
26
7,023
-
-
-
-
7,049
-
7,049
Cost of share issue
-
(840)
-
-
-
-
(840)
-
(840)
Share-based payments
21
-
-
280
-
-
-
280
-
280
At 31 December 2024
99
6,183
1,340
500
(9,766)
95
(1,549)
-
(1,549)
Profit for the year
-
-
-
-
(3,782)
-
(3,494)
-
(3,494)
Other comprehensive income
-
-
-
-
-
(252)
(252)
-
(252)
Transactions with owners
Issue of shares
20
16
5,685
-
-
-
-
5,701
-
5,701
Cost of share issue
-
(288)
-
-
-
-
(288)
-
(288)
Options exercised to Ordinary Shares
1
262
(263)
-
-
-
-
-
-
Share-based payments
21
-
-
97
-
-
-
97
-
97
At 31 December 2025
116
11,842
1,174
500
(13,260)
(157)
215
-
215
Consolidated statement of cash flows
Year ended
31 December 2025
US$'000
Year ended
31 December 2024
US$'000
Note
Cash flows from operating activities
Loss before income tax
(3,494)
(6,132)
Depreciation of property, plant and equipment
14
58
12
Amortisation of intangible assets
13
34
24
Share based payment expense
97
280
(Gain)/loss on foreign currency translation
(252)
89
Finance income
(8)
(6)
Finance expense
10
275
289
(3,290)
(5,444)
(Increase) / decrease in inventories
15
123
(146)
Increase in trade and other receivables
16
(66)
387
Increase in trade and other payables
18
(172)
(729)
Net cash used in operating activities
(3,405)
(5,932)
Cash flows from investing activities
Purchase of intangible assets
13
(61)
(201)
Payments to acquire property, plant and equipment
14
(158)
(204)
Interest received
8
6
Net cash used in investing activities
(211)
(399)
Cash flows from financing activities
Issue of shares
5,701
7,048
Proceeds from borrowings
23
(150)
267
Payment of share issue costs
(288)
(840)
Net cash from financing activities
5,263
6,475
Increase in cash and cash equivalents
17
1,647
144
Cash and cash equivalents at beginning of year
261
117
Cash and cash equivalents at end of year
1,908
261
Notes to the consolidated financial statements
1. General information
MicroSalt Plc (the "Company") is a public company limited by shares and registered and incorporated in England and Wales. The registered office is 12 New Fetter Lane, London, United Kingdom, EC4A 1JP.
The principal activity of the Company together with its subsidiary undertaking (the "Group") is that of the development and sale of low sodium salt and snack foods.
2. Accounting policies
2.1 Basis of preparation
These consolidated financial statements have been prepared in accordance with UK-adopted International Accounting Standards ("IFRS").
The financial statements have been prepared under the historical cost convention. The measurement bases and principal accounting policies of the Group are set out below.
New standards, amendments and interpretations
Standards and interpretations which are effective in the current year
None of the standards which became effective during the period which are applicable to the Group, have had a material impact.
Standards and interpretations that are not yet effective
Certain new standards, amendments to standards, and interpretations which have been issued by the IASB that are effective in future accounting periods that the Group has decided not to adopt early. These standards, amendments or interpretations are not expected to have a material impact on the Group.
IFRS 18 is effective for annual reporting periods beginning on or after January 1, 2027, with early adoption permitted. The Company is currently evaluating the impact that the adoption of IFRS 18 will have on its consolidated financial statements and disclosures.
2.2 Going concern
The Directors have assessed the Group's ability to continue as a going concern based on current cash flow forecasts. The Group continues to meet its daily working capital requirements through the B2B sales and capital raised on the AIM Market of the London Stock Exchange. In 2025, the Company successfully completed two fundraises on the AIM Market: approximately £2.4 million (US$3.3 million) in February 2025 and approximately £1.7 million (US$2.3 million) in December 2025. Additionally, growth in B2B sales is providing an increasing portion of MicroSalt's working capital. These funds support our aggressive growth strategy, including R&D, sales support, and production requirements.
The Directors are satisfied that the Group has sufficient resources to continue operations for the foreseeable future, covering at least 12 months from the date of signing these financial statements.
The Directors recognise that the Group's cash flow forecasts are dependent on the generation and timing of revenue from key customers, therefore a material uncertainty exists. These events or conditions indicate that a material uncertainty exists that may cast significant doubt on the Company's ability to continue as a going concern. Whilst these are uncertain, the Directors remain of the opinion that, should there be a delay in revenue compared to our forecasts, alternative sources of funds will be found, such as through further equity raises on the AIM market or debt finance secured on trade receivables and / or inventories. Therefore, the financial statements continue to be prepared on the going concern basis.
Notes to the consolidated financial statements (continued)
2. Accounting policies (continued)
2.3 Revenue recognition
IFRS 15 "Revenue from Contracts with Customers" is a principle-based model of recognising revenue from contracts with customers. The model comprises five steps with revenue being recognised when control over goods and services are transferred to the customer.
The Group's revenue consists of product sales. Revenue is recognised when the Group delivers a product to the customer. Payment of the transaction price is based in credit terms offered to customers and begins on the date the product is delivered.
Revenue is measured at the fair value of the consideration received, excluding discounts, rebates and sales taxes or duty.
2.4 Basis of consolidation
The consolidated financial statements present the results of the Company and its subsidiaries as if they form a single entity.
Profit or loss and each component of other comprehensive income are attributed to the equity holders of the parent of the Group and to the non-controlling interests, even if this results in the non-controlling interests having a deficit balance. When changes in ownership in a subsidiary do not result in a loss of control, the non-controlling shareholders' interests are initially measured at the non-controlling interests' proportionate share of the subsidiaries net assets. Subsequent to this, the carrying amount of non-controlling interests is the amount of those interests at initial recognition plus the non-controlling interests' share of subsequent changes in equity.
When necessary, adjustments are made to the financial information of subsidiaries to bring their accounting policies in line with the Group's accounting policies. All intra-group assets and liabilities, equity, income, expenses and cash flows relating to transactions between members of the Group are eliminated in full on consolidation.
2.5 Other operating income and grants
Other operating income represents all other income received by the Group. This includes R&D Expenditure Credits which are a form of government grant.
Government grants are recognised at their fair value where there is a reasonable assurance that the grant will be received, and the Group will comply with all attached conditions. Government grants relating to costs are deferred and recognised in the statement of profit or loss and other comprehensive income over the period necessary to match them with the costs that they are intended to compensate.
The grant income received has been accounted for in accordance with IAS 20 'Accounting for Government Grants and Disclosure of Government Assistance' and is shown in other operating income in the statement of profit or loss and other comprehensive income whilst research and development expenditure is shown gross of grant income.
2.6 Finance expense
Finance expense comprises of interest payable on convertible loan notes which are expensed in the period in which they are incurred and reported in finance costs.
2 Accounting policies (continued)
2.7 Foreign currency translation
The functional currency of the Company is GB Pounds Sterling. For the purposes of the consolidated Interim Financial Information, the results and financial position of the Company and its subsidiary are presented in US Dollars which is the Group's presentational currency, as the main operating subsidiary operates mainly in US Dollars.
Transactions in foreign currencies are recorded at the rate ruling at the date of the transaction. Monetary assets and liabilities denominated in foreign currencies are retranslated at the rate of exchange ruling at the end of the reporting period. All differences are taken to the statement of profit or loss and other comprehensive income.
Exchange differences arising on the settlement of monetary items and on the retranslation of monetary items are included in the statement of comprehensive income for the period.
The assets and liabilities of the Group are expressed in US Dollars using exchange rates prevailing at the balance sheet date. Income and expense items are translated at the average exchange rates for the period. Exchange differences arising, if any, are classified as other comprehensive income and are transferred to the Group's translation reserve.
2.8 Current and deferred taxation
The tax expense for the period comprises current and deferred tax. Tax is recognised in the statement of profit and loss, except that a charge attributable to an item of income or expense recognised as other comprehensive income or to an item recognised directly in equity is also recognised in other comprehensive income or directly in equity respectively.
The current income tax charge is calculated on the basis of tax rates and laws that have been enacted or substantively enacted by the reporting date in the UK where the Group operates and generates taxable income.
Deferred tax balances are recognised in respect of all temporary differences that have originated but not reversed by the reporting date, except:
- The recognition of deferred tax assets is limited to the extent that it is probable that they will be recovered against the reversal of deferred tax liabilities or other future taxable profits; and
- Any deferred tax balances are reversed if and when all conditions for retaining associated tax allowances have been met.
Deferred tax balances are not recognised in respect of permanent differences except in respect of business combinations, when deferred tax is recognised on the differences between the fair values of assets acquired and the future tax deductions available for them and the differences between the fair values of liabilities acquired and the amount that will be assessed for tax. Deferred income tax is determined using tax rates and laws that have been enacted or substantively enacted by the reporting date.
2.9 Property, plant and equipment
Items of property, plant and equipment are stated at historical cost less accumulated depreciation.
Depreciation is provided at the following annual rates in order to write off each asset over its estimated useful life.
Plant and equipment
-
20 per cent straight-line
Computer equipment
-
20 per cent straight-line
The assets' residual values and useful lives are reviewed, and adjusted if appropriate, at each reporting date.
2. Accounting policies (continued)
2.10 Intangible assets
Intangible assets that are acquired by the Group are stated at cost less accumulated amortisation and accumulated impairment losses.
Amortisation is charged to the administrative expenses in the statement of profit or loss and other comprehensive income on a straight-line basis over the estimated useful lives of intangible assets unless such lives are indefinite. Intangible assets with an indefinite useful life are systematically tested for impairment at each balance sheet date.
Intangible assets are amortised from the date they are available for use. The estimated useful lives are as follows on a straight-line basis:
Patents
-
Length of the patent
The estimated useful lives are based upon management's best estimate of the expected life of the asset. Useful lives are reconsidered if circumstances relating to the asset change or if there is an indication that the initial estimate requires revision. Trademarks are also classified as intangible assets; however, they are not amortized because they are considered to have indefinite useful lives.
2.11 Inventories
Inventories are initially recognised at cost, and subsequently at the lower of cost and net realisable value. Cost comprises all costs of purchase, costs of conversion and other costs incurred in bringing the inventories to their present location and condition.
Weighted average cost is used to determine the cost of ordinarily interchangeable items.
2.12 Cash and cash equivalents
Cash and cash equivalents comprise cash at bank and in hand and short term highly liquid deposits which are subject to an insignificant risk of changes in value.
Notes to the consolidated financial statements (continued)
2. Accounting policies (continued)
2.13 Financial assets
The Group classifies its financial assets at amortised cost. Management determines the classification of its financial assets at initial recognition.
The Group's financial assets held at amortised cost comprise trade and other receivables and cash and cash equivalents in the consolidated statement of financial position.
These assets are non-derivative financial assets with fixed or determinable payments that are not quoted in an active market. They arise principally through the provision of goods and services to customers (e.g. trade receivables) but also incorporate other types of financial assets where the objective is to hold their assets in order to collect contractual cash flows and the contractual cash flows are solely payments of the principal and interest.
They are initially recognised at fair value plus transaction costs that are directly attributable to their acquisition or issue and are subsequently carried at amortised cost using the effective interest rate method, less provision for impairment.
Impairment provisions for trade receivables are recognised based on the simplified approach within IFRS 9 using the lifetime ECLs. During this process the probability of the non-payment of the trade receivables is assessed. This probability is then multiplied by the amount of the expected loss arising from default to determine the lifetime ECL for the trade receivables. For trade receivables, which are reported net; such provisions are recorded in a separate provision account with the loss being recognised within administrative expenses in the consolidated statement of comprehensive income. On confirmation that the trade receivable will not be collectable, the gross carrying value of the asset is written off against the associated provision.
2.14 Financial liabilities
The Group measures its financial liabilities at amortised cost. All financial liabilities are recognised in the statement of financial position when the Group becomes a party to the contractual provision of the instrument.
The Group's financial liabilities held at amortised cost comprise trade payables and other short-dated monetary liabilities, and borrowings in the consolidated statement of financial position.
Trade payables and other short-dated monetary liabilities are initially recognised at fair value and subsequently carried at amortised cost using the effective interest rate method.
Borrowings are initially recognised at fair value net of any transaction costs directly attributable to the issue of the instrument. Such interest-bearing liabilities are subsequently measured at amortised cost using the effective interest rate method, which ensures that any interest expense over the period to repayment is at a constant rate on the balance of the liability carried in the consolidated statement of financial position.
For the purposes of each financial liability, interest expense includes initial transaction costs and any premium payable on redemption, as well as any interest or coupon payable while the liability is outstanding.
Unless otherwise indicated, the carrying values of the Group's financial liabilities measured at amortised cost represents a reasonable approximation of their fair values.
Notes to the consolidated financial statements (continued)
2. Accounting policies (continued)
2.15 Impairment of assets
Assets that are subject to depreciation or amortisation are assessed at each reporting date to determine whether there is any indication that the assets are impaired.
Where there is any indication that an asset may be impaired, the carrying value of the asset is tested for impairment. If any such indication exists, the recoverable amount of the asset is estimated in order to determine the extent of the impairment loss (if any). Where the asset does not generate cash flows that are independent from other assets, the Group estimates the recoverable amount of the cash-generating unit to which the asset belongs.
An impairment loss is recognised for the amount by which the asset's carrying amount exceeds its recoverable amount. The recoverable amount is the higher of an asset's fair value less costs to sell and value in use. Non-financial assets that have been previously impaired are reviewed at each reporting date to assess whether there is any indication that the impairment losses recognised in prior periods may no longer exist or may have decreased.
2.16 Equity instruments
Equity instruments are classified according to the substance of the contractual arrangements entered into. An equity instrument is any contract that evidences a residual interest in the assets of the Company after deducting all liabilities and comprises the following:
· "Share capital" represents the nominal value of equity shares;
· "Share premium" represents the excess value of equity shares above the nominal value;
· "Share-based payment reserve" represents the cumulative fair value of options;
· "Capital contribution reserve" represents non-cash contributions from equity holders;
· "Accumulated losses" represents retained earnings less retained losses;
· "Translation reserve" represents the Cumulative gains and losses on translating the net assets of the Company to the presentation currency of the Group" and
· "Non-controlling interests" represents the cumulative net profits/(losses) in relation to non-controlling interests.
2.17 Convertible loan notes
Convertible loan note instruments issued by the Group are assessed to whether the transaction price relates to both the underlying financial instrument and the warrants issued representing the same economic arrangement, and therefore fair value of the whole arrangement. The Group assesses whether the underlying financial instrument (loan notes) and the conversion feature should be classified as a liability or equity instrument. As part of this assessment, the Group considers whether the conversion feature is closely related to the host contract, requiring a separate assessment of the host contract and the conversion feature. It was determined that the conversion feature was not closely related to the host contract, meeting the criteria for recognition as a separate embedded derivative.
Conversion feature: There is an obligation to convert the loan notes into variable number of ordinary shares of MicroSalt Inc. on conversion events. The conversion feature is at market price as there is no discount against future equity placement offered. Therefore, the conversion feature is not a derivative because the value of the conversion feature does not change in response to the share price, and as such the conversion feature is a financial liability.
Therefore, the fair value of the overall transaction price is initially recognised as a financial liability and subsequently measured at amortised cost.
2. Accounting policies (continued)
2.18 Share-based payments
Equity-settled share-based payments are measured at fair value at the date of grant by reference to the fair value of the equity instruments granted. The fair value determined at the grant date is expensed on a straight-line basis over the vesting period with a corresponding adjustment to equity. The amount recognised as an expense is adjusted to reflect the number of awards for which the related service and non-market performance conditions are expected to be met.
Non-market vesting conditions are taken into account by adjusting the number of equity instruments expected to vest at each statement of financial position date so that, ultimately, the cumulative amount recognised over the vesting period is based on the number of options that eventually vest. Market vesting conditions are factored into the fair value of the options granted. The cumulative expense is not adjusted for failure to achieve a market vesting condition.
The fair value of the award also takes into account non-vesting conditions. These are either factors beyond the control of either party (such as a target based on an index) or factors which are within the control of one or other of the parties (such as the Group keeping the scheme open or the employee maintaining any contributions required by the scheme).
When the terms and conditions of equity-settled share-based payments at the time they were granted are subsequently modified, the fair value of the share-based payment under the original terms and conditions and under the modified terms and conditions are both determined at the date of the modification. Any excess of the modified fair value over the original fair value is recognised over the remaining vesting period in addition to the fair value of the original share-based payment at date of grant.
3. Significant accounting judgements, estimates and assumptions
The preparation of the financial statements requires the use of certain critical accounting estimates. It also requires the Group management to exercise judgement and use assumptions in applying the Group's accounting policies. The resulting accounting estimates calculated using these judgements and assumptions will, by definition, seldom equal the related actual results but are based on historical experience and expectations of future events. Management believe that the estimates utilised in preparing the financial statements are reasonable and prudent.
Estimates and judgements are continually evaluated based on historical experience and other factors, including expectations of future events that are believed to be reasonable under the circumstances. In the future, actual experience may differ from these estimates and assumptions. The judgements and key sources of estimation uncertainty that have a significant effect on the amounts recognised in the financial statements are discussed below:
Critical judgements
Information about critical judgements that may have most significant effect on recognition and measurement on assets, liabilities and expenses is provided below:
Going Concern
The Group liabilities as at 31 December 2025, mainly consist of US$2,871,000 in convertible loan notes (CLN) issued by Tekcapital, including accrued interest. Management knows that the CNL holder is our most significant shareholder which considerably mitigates the risk associated with these CLN. The going concern basis is being upheld by future cashflow forecasts which involves significant management judgement.
Investment in subsidiary (company only)
The valuation of the investment in subsidiary is supported by the company delivering on its future business plan. The future business plan is underpinned by forecast cash flows which involve significant management judgements. If the Group was to underperform the forecast performance of the business plan, there is a risk that this balance might be impaired.
4. Revenue from contracts with customers
All Group revenue was generated from the sale of goods across North America and recognised at the date the goods were delivered. 3 customers make up 76% or more of revenue in the period ended 31 December 2025 (2024:65%).
31 Dec
31 Dec
2025
2024
US$'000
US$'000
Customer 1
1,141
209
Customer 2
241
-
Customer 3
181
-
5. Other operating income
31 Dec
31 Dec
2025
2024
US$'000
US$'000
Other income
-
3
-
3
6. Segmental reporting
Factors that management used to identify the Group's reportable segments:
The Chief Operating Decision Maker ("CODM") has been identified as the Directors. The CODM reviews the Group's internal reporting in order to assess performance and allocate resources. The CODM has determined that there is one single operating segment, the development and sale of low sodium salt and snack foods.
7. Operating loss
31 Dec
31 Dec
2025
2024
US$'000
US$'000
Amortisation of intangible assets
33
24
Research and development expense
67
247
Share-based payment expense
97
280
Expected gain credit
(7)
14
8. Auditors' remuneration
During the year the Group obtained the following services from the Group's auditors:
31 Dec
31 Dec
2025
2024
US$'000
US$'000
Fees payables for the audit of the Group and Company's annual accounts
105
94
Fees payables for all other pre-IPO non-audit services
-
47
105
141
9. Employees and directors
2025
2024
US$'000
US$'000
Wages and salaries
605
670
Social security costs
208
227
Share-based payment expense
97
280
910
1,177
The average monthly number of employees and Directors during the year was as follows:
2025
2024
Number
Number
Management and administration
6
7
6
7
Directors' remuneration is as follows:
2025
2024
US$'000
US$'000
Directors' emoluments, including salaries and fees
332
433
Social security costs
32
23
Share-based payment expense
97
280
461
736
Key management personnel include all of the Directors, who together have authority and responsibility for planning, directing, and controlling the activities of the Group's business. There are no key management personnel other than the Directors of the Group.
The remuneration of the highest paid Director who served during the year was Rick Guiney which consisted of base salary of US$200,000 (FY24: US$200,000), paid by MicroSalt Inc.
10. Finance expense
31 Dec
31 Dec
2025
2024
US$'000
US$'000
Finance costs:
Interest on convertible loans
275
289
275
289
11. Taxation
Analysis of tax expense
No liability to UK corporation tax arose on ordinary activities for the year ended 31 December 2025 or for the year ended 31 December 2024.
Factors affecting the tax expense
The tax assessed for the year is lower than the standard rate of corporation tax in the UK. The difference is explained below:
31 Dec
31 Dec
2025
2024
US$'000
US$'000
Loss on ordinary activities before tax
(3,494)
(6,131)
Tax using the Group's domestic tax rates
(873)
(1,533)
Effects of:
Deferred tax adjustment - remeasurement of current year losses at future tax rate
-
-
Unutilised tax losses carried forward
873
1,533
Total taxation credit
-
-
The main rate of UK corporation tax for the year ended 31 December 2025 and 2024 was 25%.
No provision has been made for the 2025 deferred taxation as no taxable income has been received to date, and the probability of future taxable income is indicative of current market conditions which remain uncertain.
At the Statement of Financial Position date, the Directors estimate that the Group has unused tax losses of US$13,257,000 (FY24: US$9,763,000).
Losses may be carried forward indefinitely in accordance with the applicable taxation regulations.
12. Basic and diluted loss per share
Basic and diluted loss per share is calculated by dividing the result attributable to equity holders by the weighted average number of ordinary shares in issue. Loss per share is presented based on the number of shares outstanding in the Company.
31 Dec
31 Dec
2025
2024
Loss used in calculating basic and diluted loss per share (US$)
(3,746,000)
(6,042,000)
Weighted average number of shares
52,411,452
45,851,697
Basic and diluted loss per share (US$)
(0.07)
(0.13)
The diluted earnings per share is identical to the basic loss per share as the exercise of warrants and options would be anti-dilutive.
13. Intangible assets
Patent
Trademark
Total
US$'000
US$'000
US$'000
Cost
At 1 January 2024
303
31
334
Additions
197
4
201
At 31 December 2024
500
35
535
Amortisation
At 1 January 2024
13
-
13
Charge for the period
24
-
24
At 31 December 2024
37
-
37
Net book amount
At 31 December 2024
463
35
498
Cost
At 1 January 2025
500
35
535
Additions
58
3
61
At 31 December 2025
558
38
596
Amortisation
At 1 January 2025
37
-
37
Charge for the period
34
-
34
At 31 December 2025
71
-
71
Net book amount
At 31 December 2025
487
38
525
14. Property, plant and equipment
Computer Equipment
Plant & equipment
Total
US$'000
US$'000
US$'000
Cost
At 1 January 2024
-
9
9
Additions
23
181
204
At 31 December 2024
23
190
213
Depreciation
At 1 January 2024
-
1
1
Charge for the period
2
10
12
At 31 December 2024
2
11
13
Net book amount
At 31 December 2024
21
179
200
Cost
At 1 January 2025
23
190
213
Additions
127
31
158
At 31 December 2025
150
221
371
Depreciation
At 1 January 2025
2
11
13
Charge for the period
30
28
58
At 31 December 2025
32
39
71
Net book amount
At 31 December 2025
118
182
300
15. Inventory
2025
2024
US$'000
US$'000
Raw materials
234
226
Finished goods and goods for resale
357
488
591
714
16. Trade and other receivables
2025
2024
US$'000
US$'000
Trade receivables
461
492
Other receivables
330
245
Prepayments
147
135
938
872
Trade receivables are amounts due from customers for goods sold in the ordinary course of business. They are generally due for settlement immediately or within 30 days for certain credit customers and therefore are all classified as current. Trade receivables are non-interest bearing. The carrying amount of trade and other receivables approximates fair value.
Analysis of trade receivables based on age of invoices:
< 30
days past due
US$'000
31 - 60 days past due
US$'000
61 -90 days past due
US$'000
> 90
days past due
US$'000
Total gross
US$'000
ECL
US$'000
Total net
US$'000
31 December 2025
266
96
3
141
506
(15)
491
31 December 2024
220
89
37
168
514
(22)
492
The Group applies the IFRS 9 simplified approach to measuring expected credit losses (ECL) which uses a lifetime expected loss allowance for all trade receivables. The ECL balance has been determined as US$15,000 (FY24: US$22,000) based on historical data available to management in addition to forward looking information utilising management knowledge. The ECL is based on 90% of trade receivables over 60 days past due being recoverable and therefore an ECL of 10% of trade receivables has been recognised. Based on the analyses performed there is no material impact on the transition to ECL from previous methods of estimating the provision for doubtful accounts.
17. Cash and cash equivalents
2025
2024
US$'000
US$'000
Cash at bank
1,908
261
1,908
261
18. Trade and other payables
31 Dec
31 Dec
2025
2024
US$'000
US$'000
Amounts falling due in one year:
Trade payables
938
1,196
Other payables
98
47
Accruals
140
105
1,176
1,348
Other payables include amounts owed to related parties (see note 25).
19. Borrowings
31 Dec
31 Dec
2025
2024
US$'000
US$'000
Non-current
Convertible loan notes
2,871
2,746
2,871
2,746
The Group issued CLNs on 1 March 2023 and 1 October 2023, with principal amounts of US$2,000,000 each, of which US$1,523,000 (FY24: US$1,673,000) and US$656,000 (FY24: US$656,000), remain outstanding at 31 December 2025, respectively. On 5 June 2025, the Company completed a repayment of $150,000.
The CLNs incur interest of 10% per annum and are repayable four years after commencement or can be converted into ordinary shares of MicroSalt Inc. upon certain conversion events at the option of the noteholder. During the year ended 31 December 2025 and 2024, none were converted into ordinary shares of MicroSalt Plc.
20. Share capital
31 Dec
31 Dec
31 Dec
31 Dec
2025
2025
2024
2024
Shares
US$
Shares
US$
Allotted, called up and fully paid
Opening number of £0.001625 ordinary shares for 2025 and 2024
48,217,134
98,597
35,245,729
72,926
Issue of ordinary shares
7,419,641
16,235
12,971,405
25,671
Exercise of Stock Options
507,118
1,110
-
-
Closing number of £0.001625 ordinary shares
56,143,893
115,942
48,217,134
98,597
All issues are for cash unless otherwise stated.
31 Dec
31 Dec
2025
2024
US$'000
US$'000
Share premium
Opening balance
6,183
-
Issue of shares
5,685
7,023
Exercise of Stock Options
262
-
Cost of share issue
(288)
(840)
Closing balance
11,842
6,183
On 3 February 2025, the Company issued 3,580,551 shares at £0.70 per new share; also on 15 December 2025, the Company issued 3,839,090 shares at £0.45 per new share.
On 5 February 2025 and 21 November 2025, the Company announced that a total of 165,591 and 341,527 ordinary shares respectively, have been allotted to shareholders to satisfy the exercise of options over Ordinary Shares. The exercise prices of the Option Shares were US$0.25 and US$0.545.
On 1 February 2024, the Company issued 7,871,423 shares at £0.43 per new share; also on July 01, 2024, the company issued 4,799,981warrants at £0.473 per new share. The cost associated to the IPO process included legal, financial and advisory services for about US$840,000.
On 1 February 2024, the Company completed its IPO on the AIM Market of London Stock Exchange plc raising approximately £3.1 million (US$3.9 million).
21. Share-based payments
The Group operates an equity settled share-based remuneration scheme for employees. Options are granted for nil consideration and carry no dividend or voting rights. The terms and conditions of the grants are detailed below:
Date of grant
No. of options
Exercise price
Vesting conditions
Expected life of options
Share price at grant date
Expected option life
Risk free interest rate
21 September 2020
56,284
US$0.000025
Time-based1
1 year
US$0.0001
0 years
4,87%
1 January 2021
56,000
US$0.000025
Time-based3
3 years
US$0.0001
0 years
5.00%
28 February 2021
268,800
US$0.2500
Time-based4
1 year
US$1.00
0 years
0.05%
16 November 2021
604,800
US$0.2500
Time-based2
3 years
US$1.00
0 years
0.50%
29 November 2021
228,000
US$0.2500
Time-based2
3 years
US$1.00
0 years
0.50%
1 September 2021
300,000
US$0.2500
Time-based2
1 year
US$1.00
0 years
0.18%
1 January 2022
56,000
US$0.2500
Time-based1
1 year
US$1.00
0 years
0.87%
24 February 2022
228,000
US$0.2500
Time-based3
3 years
US$1.00
0 years
1.07%
23 November 2021
1,000,000
US$0.2500
Time-based2
3 years
US$1.00
0 years
0.50%
1 August 2022
400,000
US$0.3225
Time-based3
2 years
US$1.29
0 years
2.87%
27 October 2022
804,800
US$0.3225
Exit event5
3 years
US$1.29
0 years
3.45%
18 November 2022
1,680,000
US$0.5450
Time-based2
3 years
US$2.18
0 years
3.26%
30 April 2024
351,000
US$0.8804
Time-based3
3 years
US$0.88
3 years
4.36%
1100% of the share options vest in one annual instalment 12 months after the grant date.
22.78% of the share options vest in equal monthly instalments over 36 months from the grant date.
333.33% of the share options vest 12 months after the grant date, 33.33% of the share options vest 24 months after the grant date and the remaining 33.33% of share options vest 36 months after the grant date.
450% of the share options vest six months after the grant date and 50% of the share options vest 12 months after the grant date.
5These options vest on an exit event, such as a sale, takeover or IPO.
The number of options and exercise price for the Options granted before 2023 have been adjusted for the effect of a 3200:1 share subdivision and subsequent 1:520 share consolidation which occurred in 2023.
All options granted have an expected volatility of 80%.
On 30 September 2023, all of the options held with MicroSalt Inc. were cancelled and reissued with the Company on the same terms as the existing agreements. As such, the fair value of the options did not increase as a result of the modification and therefore no adjustment was made to share-based payment expense in 2023.
Details of the number of share options granted, exercised, lapsed and outstanding at the end of each period as well as the weighted average exercise prices in US$ ("WAEP") are as follows:
2025
No.
2025
WAEP
2024
No.
2024
WAEP
Outstanding at the beginning of the year
7,061,684
0.37
6,710,684
0.37
Granted during the year
-
-
351,000
0.88
Exercised during the year
(1,028,000)
0.48
-
-
Outstanding at the end of the year
6,033,684
0.38
7,061,684
0.39
Exercisable at the end of the year
5,892,517
0.57
6,031,897
0.37
22. Financial instruments
The Group's financial instruments comprise cash and cash equivalents, trade and other receivables, trade and other payables, accruals, and convertible loan note liabilities, that arise directly from its operations.
Financial assets
31 Dec
31 Dec
2025
2024
US$'000
US$'000
Trade receivables
461
492
Other receivables
330
245
Cash at bank
1,908
261
2,699
998
Financial liabilities
31 Dec
31 Dec
2025
2024
US$'000
US$'000
Trade payables
938
1,196
Other payables
98
47
Accruals
140
105
Convertible loan note liabilities
2,871
2,746
4,047
4,094
The carrying values of the Group's financial liabilities measured at amortised cost represents a reasonable approximation of their fair values.
Financial risk management
The Group is exposed through its operation to the following financial risks: credit risk, interest rate risk, foreign exchange risk and liquidity risk. Risk management is carried out by the Directors. The Group uses financial instruments to provide flexibility regarding its working capital requirements and to enable it to manage specific financial risks to which it is exposed.
The Group finances its operations through a mixture of debt finance, cash and liquid resources and various items such as trade debtors and trade payables which arise directly from the Group's operations.
a) Foreign exchange risk
The Group operates internationally and is exposed to currency risk arising on cash and cash equivalents, receivables and payables denominated in a currency other than the respective functional currencies of the Group entities, which are primarily US Dollars and Sterling. The Group's manages foreign currency risk by, where possible, settling liabilities denominated in a currency other than its functional currency with cash already denominated in that currency.
22. Financial instruments (continued)
The carrying amounts of the Group's foreign currency denominated monetary assets and monetary liabilities at the reporting date are as follows:
31 Dec
31 Dec
2025
2024
US$'000
US$'000
Net foreign currency liabilities
GBP
1,216
153
Sensitivity analysis
A 10% strengthening of sterling against the Group's primary currencies at 31 December 2024 would have decreased equity and profit or loss by the amounts shown below:
31 Dec
31 Dec
2025
2024
US$'000
US$'000
Effect on equity
122
15
Effect on profit or loss
122
15
A 10% weakening of sterling against the Group's primary currencies at 31 December 2025 would have an equal but opposite effect on the amounts shown above.
b) Interest rate risk
Interest rate risk is the risk that the fair value of future cash flows associated with the instrument will fluctuate due to changes in market interest rates. The Group's only interest-bearing borrowings are at a fixed interest rate of 10%, therefore interest rate risk exposure for the Group is minimal.
It is the Group's policy to settle payables within the credit terms allowed and the Group does therefore not incur interest on overdue balances.
c) Credit risk
Credit risk is the risk of financial loss to the Group if a customer or counterparty to a financial instrument fails to meet its contractual obligations. In order to minimise the risk, the Group endeavours only to deal with companies which are demonstrably creditworthy and this, together with the aggregate financial exposure, is continuously monitored. The maximum exposure to credit risk is the carrying value of its financial receivables, trade and other receivables and cash and cash equivalents as disclosed in the note above.
The receivables age analysis is evaluated on a regular basis for potential doubtful debts, considering historic, current and forward-looking information. The Group applies the IFRS 9 simplified approach to measuring expected credit losses (ECL) which uses a lifetime expected loss allowance for all trade receivables The ECL is based on 90% of trade receivables over 60 days past due being recoverable. Further disclosures regarding trade and other receivables are provided within note 16.
Credit risk also arises on cash and cash equivalents and deposits with banks and financial institutions. For banks and financial institutions, only independently rated parties with minimum rating "B+" are accepted. Currently the financial institution whereby the Group holds significant levels of cash is JP Morgan Chase Bank, N.A. which is rated AA-.
22. Financial instruments (continued)
d) Liquidity risk
The Group seeks to maintain sufficient cash balances. Management review cash flow forecasts on a regular basis to determine whether the Group has sufficient cash reserves to meet future working capital requirements and to take advantage of business opportunities.
A maturity analysis of the Group's total liabilities is shown below:
Group
31 Dec
31 Dec
2025
2024
US$'000
US$'000
Within 1 year:
Trade and other payables
1,036
1,243
Accruals
140
105
Total within 1 year
1,176
1,348
Convertible loan note liabilities
2,871
2,746
Later than 1 year and less than 2 years
2,871
2,746
Total including interest cash flows
4,047
4,094
Less: interest cash flows
(275)
(289)
Total principal cash flows
3,772
3,805
The convertible loan notes issued by Tekcapital Group and its interests are repayable US$1,988,000 on March 2027 and US$883,000 on November 2027.
23. Related party disclosures
Key management personnel remuneration is disclosed in note 9 above.
Transaction amount
Balance owed
Related party relationship
Type of transaction
2025
US$'000
2024
US$'000
2025
US$'000
2024
US$'000
Tekcapital plc
Convertible loan notes issued (Repayment)
(150)
(67)
2,871
2,746
Tekcapital Europe Ltd
Related party loan
-
(642)
-
-
On 5 June 2025, the Company completed a repayment of $150,000.
24. Changes in liabilities from financing activities
At 1 January
2024
US$'000
Financing cash flows
US$'000
Interest
US$'000
Non-cash changes
US$'000
At 31 December 2024
US$'000
Convertible loan notes
2,524
267
289
(334)
2,746
Total liabilities from financing activities
2,524
267
289
(334)
2,746
At 1 January
2025
US$'000
Financing cash flows
US$'000
Interest
US$'000
Non-cash changes
US$'000
At 31 December 2025
US$'000
Convertible loan notes
2,746
(150)
275
-
2,871
Total liabilities from financing activities
2,746
(150)
275
-
2,871
The non-cash change in 2024 relates a balance due to the ultimate controlling party that was settled by issue of convertible loan note.
25. Events after the reporting date
At the time this report was issued, there were no significant events to report.
This information is provided by RNS, the news service of the London Stock Exchange. RNS is approved by the Financial Conduct Authority to act as a Primary Information Provider in the United Kingdom. Terms and conditions relating to the use and distribution of this information may apply. For further information, please contact rns@lseg.com or visit www.rns.com.
RNS may use your IP address to confirm compliance with the terms and conditions, to analyse how you engage with the information contained in this communication, and to share such analysis on an anonymised basis with others as part of our commercial services. For further information about how RNS and the London Stock Exchange use the personal data you provide us, please see our Privacy Policy.ENDFR GLGDUBGDDGLI