
Good morning from Paul & Graham!
Explanatory notes -
A quick reminder that we don’t recommend any stocks. We aim to review trading updates & results of the day and offer our opinions on them as possible candidates for further research if they interest you. Our opinions will sometimes turn out to be right, and sometimes wrong, because it's anybody's guess what direction market sentiment will take & nobody can predict the future with certainty. We are analysing the company fundamentals, not trying to predict market sentiment.
We stick to companies that have issued news on the day, with market caps up to about £1bn. We avoid the smallest, and most speculative companies, and also avoid a few specialist sectors (e.g. natural resources, pharma/biotech).
A key assumption is that readers DYOR (do your own research), and make your own investment decisions. Reader comments are welcomed - please be civil, rational, and include the company name/ticker, otherwise people won't necessarily know what company you are referring to.
What does our colour-coding mean? Will it guarantee instant, easy riches? Sadly not! Share prices move up or down for many reasons, and can often detach from the company fundamentals. So we're not making any predictions about what share prices will do.
Green (thumbs up) - means in our opinion, a company is well-financed (so low risk of dilution/insolvency), is trading well, and has a reasonably good outlook, with the shares reasonably priced.
Amber - means we don't have a strong view either way, and can see some positives, and some negatives. Often companies like this are good, but expensive.
Red (thumbs down) - means we see significant, or serious problems, so anyone looking at the share needs to be aware of the high risk.
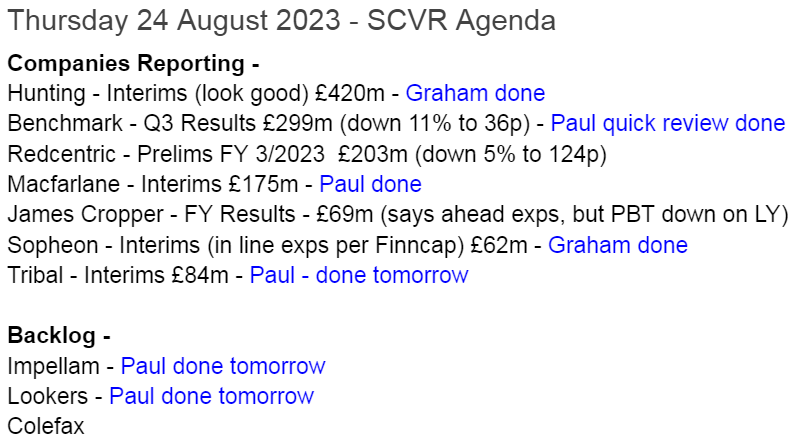
Summaries of main sections
Sopheon (LON:SPE) - down 2% at 575p (£58m/$74m) - Interim Results (in line) - Graham - AMBER
These results are in line. As usual, this software company shows limited organic growth, capitalises a few million dollars of its costs, and has to deal with some contract lumpiness. However the valuation is getting close to value territory in my view. It may already be there.
Macfarlane (LON:MACF) - 110p (pre market) (£174m) - Interim Results (in line) - Paul - GREEN
I have a really good rummage through the interim results from this packaging distribution group, and can't really find any negatives. Shares look cheap, it's performing well, with improved margins. The balance sheet stands up to scrutiny, cashflow is good. Acquisitive growth has doubled earnings over the last 3-4 years. It looks as if 2023 forecasts should be met/beaten. Lots to like here, a thumbs up from Paul.
Hunting (LON:HTG) - down 6% at 240p (£393m/$498m) - Interim Results (in line) - Graham - AMBER
This supplier to oil and gas reports EBITDA in line with expectations and an order book at the lower end of the range. The shares sell off as it moves into net debt and announces some restructuring initiatives. The shares offer a good way to bet on an oil and gas boom.
Benchmark Holdings (LON:BMK) - Down 7% to 37.8p (£280m) - Q3 Results - Paul - RED
[Quick review, no section below]
In compliance with the terms of the Company's unsecured Green bond, which requires it to publish quarterly financial information, Benchmark, the aquaculture biotechnology business, announces its unaudited results for the three months ended 30 June 2023 (the "Period"), which constitutes the third quarter for the fiscal year ("FY") 2023, and its year to date unaudited results for the nine months ended 30 June 2023.
It sounds in line -
the Group is trading within market expectations for the full year. [Paul: FY 9/2023]
A note from Equity Development (May 2023) forecast an adj PBT loss of £(5.6)m for FY 9/2023. It’s been heavily loss-making in the past too.
That is forecast to improve to a small, maiden profit of £1.6m adj PBT next year.
Hence I’m puzzled as to why the stock market is valuing BMK shares at £280m market cap?
The balance sheet seems to be carrying a lot of gross debt at £80m (excl leases). See note 10 for terms of the debt, including some bonds. Partly offset by £33m cash.
Paul’s opinion - on a brief review of the figures, I can clearly see this doesn’t interest me at all, and seems impossible to value on conventional grounds.
There might be a more involved reason as to why the company is valued at £280m, but it’s not obvious from the numbers. It might be a growth company with great future potential, which is what the valuation implies, but that sort of thing is outside the scope of our reviews here.
Note that 3 large shareholders dominate, with almost three-quarters of the shares.
Given the long history of disappointment and losses, plus too much debt, I can only view this as RED.
If any subscribers have looked into it in more detail, it would be interesting to hear your views in the reader comments.
Paul’s Section:
Macfarlane (LON:MACF)
110p (pre market) (£174m) - Interim Results - Paul - GREEN
Macfarlane Group PLC has been listed on the Premium segment of the Main Market of the London Stock Exchange (LSE: MACF) since 1973 with over 70 years' experience in the UK packaging industry. Through its two divisions, Macfarlane Group services a broad range of business customers, supplying them with high quality protective packaging products which help customers reduce supply chain costs, improve operational efficiencies and enhance their brand presentation…
RESILIENT H1 2023 PERFORMANCE - PROFIT EXPECTATIONS FOR THE FULL YEAR UNCHANGED
Checking my previous notes this year, for background, we like this packaging distribution group, as a GARP share -
23/2/2023 - GREEN - 108p - Strong results FY 11/2022, ahead mkt exps. Nice co, but whole sector is cheap.
9/5/2023 - GREEN - 116p - In line exps TU. 2 more acqns. Little net debt. Attractive valuation.
Track record is good as you can see below - with EPS having doubled in the last 3 years. Despite this, the market gives it no credit for a strong performance in difficult times, as graph 4 shows the PER in a declining trend, despite the growth track record in profits. Graph 5 shows the dividend yield improving. All this looks attractive to me, as a potentially good buying opportunity, for a possible re-rating at some stage in the next bull market?

Although investors need to be patient! The 5-year share price chart below shows MACF shares have been a safe place to hide since last autumn, in the current small caps bear market, which I find encouraging -

The Stockopedia computers consistently like it, being in the green section above for StockRank in the whole of the last 5 years, and currently rated at 93 -

The forward PER seems strikingly low for a decent quality business - the market is pricing in a recession, by the looks of it -

.
The above has set the scene, and motivated me to go through these numbers in detail (since they’re only in line, we would usually gloss over them, to focus on above/below reports elsewhere, which are price sensitive).
Good increases in profitability, despite revenues only being up 2%, so margins have improved (gross margin is 36.2%, usefully up on 33.8% in the last year comparative period).
Figures also boosted by acquisitions, offsetting lower demand in the UK, the commentary says -

.
Amortisation & forecasts - this is an important point with MACF, it doesn’t adjust out the goodwill amortisation charge from acquisitions, when reporting PBT and EPS. It does adjust out amortisation in the table above, but only for operating profit. Lower down, PBT and basic EPS are not adjusted. That’s different to what other companies do, where it’s normal to adjust out goodwill (and similar) amortisation charges. The amount is quite material too, a £2.0m charge in H1.
So adj PBT would be £12.0m in H1, and using the same 24.8% tax charge, adj PAT would be £9.0m, and referencing note 8 for the weighted average number of shares in issue of 159.9m (including only modest, c1% dilution from LTIP awards in issue), gives me an adj EPS for H1 of 5.63p, usefully higher than the 4.70p diluted EPS for H1 that the company reports. In fact that’s 20% higher, so this is material to how we value the shares.
This matters, because the company’s reported EPS numbers are really about 20% below how everyone else reports their EPS. You can see that on the StockReport, with 9.84p EPS reported for FY 12/2022, and then an apparent jump to broker forecast of 11.8p for FY 12/2023. Yet a helpful note from Shore Capital (many thanks) shows the adj EPS for 2022 as 12.1p, 23% above the company’s reported 9.8p.
Therefore this year’s forecast of 11.9p aEPS from Shore is actually a 2% drop against what was achieved in 2022. Since H1 actual EPS is up about 9% vs LY, then this suggests to me there’s probably a good chance MACF could beat forecasts for 2023. Hence risk of a profit warning seems low, and it’s more likely to be a profit beat than a miss for 2023, providing macro doesn’t go disastrously wrong, which is one of many possibilities.
Outlook - this sounds fine to me, given tough macro conditions at the moment -
"Whilst we expect the second half of 2023 to remain challenging, our good progress in Europe, diverse customer base, strong new business momentum and effective management of pricing and costs mean that our profit expectations for the full year remain unchanged."...
There will continue to be challenges in 2023, with rising costs and weak demand. However, our strategy and business model have proved to be resilient and we expect to deliver further growth in 2023 and beyond.
Valuation - using the adjusted EPS figures, as explained above, I reckon we’re probably looking at 12-13p aEPS this year FY 12/2023. That puts the PER at just 8.6x the mid point of my earnings range, using a 108p share price currently.
This strikes me as a very attractive valuation for what seems a decent, and growing business. However, it’s the type of share that always looks cheap, and remains so. Hence one for patient investors only I’d suggest.
Balance sheet - being an acquisitive group, the stand-out figure is £86.5m in goodwill & similar, at the top of the balance sheet.
Tangible fixed assets seem low at £9.1m, which thinking about it is probably because MACF is mainly a distributor, rather than manufacturer, hence it wouldn’t need a lot of fixed capital. Just lots of warehouses - indeed the risk section mentions that it has 1 owned site, and 52 leased sites - suggesting to me there might be inefficiencies from having acquired lots of smaller businesses, all with their own smallish warehouses perhaps? That would be a good question to ask on any webinars - in fact I’ve just pre-submitted that question on InvestorMeetCompany for the Interim results webinar, scheduled for 11:30 on 29 August.
Pension surplus of £12.8m is shown on the balance sheet, but as we know, surpluses are usually deficits. Note 11 indicates that it is indeed paying £1.25m pa in deficit recovery payments. So at the very least, we should remove the £12.8m asset from the balance sheet, and probably replace it with a £5.0m liability, which reflects the 4-year deficit recovery period. Oh actually, that was 4 years from 2020, so maybe just a £1.25m liability is needed. This could change up or down, when the 2023 actuarial calculations are done.
NAV is £111.0m, and I’ll adjust it as follows: remove £86.5m goodwill/similar, remove £12.8m pension surplus. Add £1.25m pension deficit liability. That gets me to NTAV of £13.0m - not a great deal really, but at least it’s positive.
I’ll leave in the lease asset of £35.3m, as it’s very similar to the £36.2m lease liabilities (multi-year, remember).
Actually, I’m going to remove the £10.4m deferred tax liability too, as note 12 indicates it’s almost all related to the pension scheme and goodwill. That improves adj NTAV to £23.4m, which is acceptable I think.
It seems to me that MACF enjoys favourable terms from its suppliers, because trade payables are almost the same as trade receivables. That implies MACF collects in cash more quickly than it pays it out - a nice position to be in. Although payables will also include other things that are not trade, eg tax, accrued costs, etc.
Inventories are quite low, suggesting stock comes in & out quickly, without hanging around too long, which is efficient.
Net debt - is modest. Cash of £5.9m mostly offsets £9.2m of bank borrowings, so net bank debt is only £(3.3)m. That could be window-dressed for the year end of course, we don’t know. However, note 5 (finance costs) indicates costs of only £399k “interest on bank borrowings” in H1. If we assume it might have paid an average of say 6% interest (4% base rate average in this period, plus I’ve assumed a 2% bank lending margin), then this implies an average of about £13m gross debt throughout H1, which is fairly close to the £9.2m reported gross debt on 30 June 2023. So it passes my reasonableness testing, i.e. the reported net debt looks about right compared with what the finance charge costs are.
No concerns over debt, indeed due to the cash generation at MACF, I think it could possibly borrow more for acquisitions, without it alarming me.
Cashflow statement - is highly impressive. Although it seems to have benefited in H1 from some one-off decreases in inventories and receivables turning into cash, which may reverse in H2, so I wouldn’t get too excited about the cash generation.
This has been useful though, in allowing MACF to fund £11.4m in acquisition-related payments, paying taxes & finance costs, £4m in divis, modest capex, all in H1, and without depleting its cash or drawing down any more bank borrowings. Very impressive.
Paul’s opinion - this strikes me as a really good business that has demonstrated its ability to manage serious external factors like the pandemic, energy crisis, higher inflation, and still manage to deliver a decently positive trend in profitability and EPS over the last few years. It’s easy for us to forget just how chaotic the world has been since 2020.
Despite this, MACF shares are only on a high single digit PER, for a successful growing (self-funded with no dilution since 2018) group, with an OK balance sheet, hardly any debt, and an OK dividend.
I think shareholders here can sleep at night, knowing that there’s probably little downside risk, and that with patience the market should eventually recognise MACF’s good track record, and reward it with a re-rating. That could give a nice upside from current levels I think. More a medium-long term investment I’d say, as it often just treads water in the shorter term. Re-ratings can be sudden, and unexpected though, when they happen. Someone might bid for it too, although the sector seems to be lowly rated generally.
Anyway, the figures get a clean bill of health from me, and a thumbs up.
Graham’s Section:
Sopheon (LON:SPE)
Share price: 575p (-2%)
Market cap: £58m ($74m)
This software company has published its H1 numbers.
Revenue highlights:
Revenue $17m (H1 last year: $15.7m). There was a very small acquisition in May 2022 that made some contribution to boost the performance this year.
SaaS recurring revenue of $15.2m (a year ago: $9.2m). All new customers are signing up on a “SaaS” basis.
Total recurring revenue $25.9m (a year ago: $21.9m).
Unfortunately, profits are lagging behind. Adjusted EBITDA in H1 is still just $2.9m (same as last year), which reflects “continued investment in product and commercial initiatives as per operating plans”.
PBT is just $0.2m, although it’s an improvement on the pre-tax loss of $0.8m in H1 last year.
Net cash is $22.4m, with no debt.
Acquisition - another very small acquisition was made at the start of H2, buying the company’s reseller in Australia.
Exec Chair comment/outlook statement doesn’t give much away but looks forward to a stronger sales pipeline in H2.
Strategy - the company is looking to serve more types of customers (more “verticals”!) and medium-sized companies, instead of being concentrated in large customers in just a few industries.
Estimates - these results are in line with expectations. Broker finnCap is forecasting adjusted EPS of 7.1p this year, before profits start to take off in 2024 with an adjusted EPS of 21.2p.
Graham’s view
Looking back on my previous notes in June and in March, I had some concerns over “limited organic growth, the capitalisation of costs putting a question mark over profitability, and the lumpy nature of contracts”.
Has anything changed in recent months? I don’t think so.
Organic growth - revenues are up 8% in an inflationary period, and that’s with a little bit of help from acquisitions. So real organic growth is not very high.
Capitalisation of costs - today’s cash flow statement shows $2.9m of costs being capitalised, the same as last year. Profits get a small boost from the company writing off (i.e. amortising) these intangible assets at a slower rate than it creates them.
So for me there is very little current profitability to write home about here. The adjusted EBITDA figure is meaningless to me because of the amortisation charge it ignores. That figure also leaves out a couple of hundreds thousand dollars of share-based payments to staff.
Lumpiness of contracts - revenue visibility is lower this year because last year, the company benefited from a large US Navy contract. This year, it reports that the sales pipeline includes “two significant perpetual extension orders from existing military customers, as well as many SaaS opportunities from private sector prospects and existing customers”. Perhaps there will be some improvement when it comes to the lumpiness of contracts?
More positively, Sopheon’s valuation has cooled down a lot in recent years, and it still has a substantial cash balance.

Subtract $22m of cash from the market cap and you get an enterprise value of $52m. The EV to sales multiple is then only 1.4x based on the current year. This is very cheap in the context of a software company with recurring revenues. I’m certain the valuation would be far higher if it was listed in the United States.
So I’m tempted to give this one the thumbs up on the basis of that cheap EV to sales multiple. It’s not as if there are any immediate solvency worries, after all - it’s just not very profitable yet.
At an EV to sales multiple of 1x, I think I would be forced to turn positive. For now I’ll stick with the neutral rating.
Hunting (LON:HTG)
Share price: 240p (-6%)
Market cap: £393m ($498m)
Hunting PLC (LSE:HTG), the global engineering group, today announces its unaudited half year results for the six months ended 30 June 2023.
This is a supplier to the oil and gas industry. Paul and I have both felt compelled to write about it over the past year, despite not being sector experts.
For many years it was valued at over £1 billion, so it was the wrong size for the SCVR:

Its financial results are volatile, so it’s an intriguing question as to whether these levels could offer turnaround and recovery potential.
Let’s get into these H1 results.
The numbers are promising, with a swing into substantial profits:
Revenue +42% to $478m
Order book +63% to $530m (according to Reuters, this is the lower end of the range estimated by Jefferies)
EBITDA of $48.7m is in line with expectations. Not a very helpful number due to depreciation and other charges.
Adjusted operating profits at $26.2m (H1 last year: $4.7m).
After-tax net income $17.4m (H1 last year: loss of $4m).
CEO comment argues that we are on the cusp a new boom in oil and gas investment:
"Today's results confirm the positive trend of increased investment in the oil and gas industry following years of under investment, driven by global energy demand and increased focus on energy security. We believe that the sector is in the early days of a long term growth cycle which, coupled with our non-energy businesses, positions the Company for increased revenue and earnings going forward.”
Outlook statement strikes a similar tone:
Global energy markets continue to display growth, stability and resilience, despite the macroeconomic narrative from some Western economies. Activity across the oil and gas industry continues to be strong, particularly within the offshore segment of the market and drilling continues to increase in momentum in South America, West Africa, the Middle East and Asia Pacific.
EBITDA in H2 is expected to be “similar” to H1. The broker note from Zeus confirms that this is in line with existing guidance, and they make no change to their forecasts.
A very large contract has been signed with Cairn Oil & Gas - Vedanta in India, with a value of up to $91m over three years.
Graham’s view
The revenue and profit figures are very encouraging, but the shares have been sold off. So I suppose we first need to try to understand why that might be.
A separate RNS today says the following:
…as part of a wider programme to drive higher operational efficiencies and reduce future cost outflows, it has commenced a further restructuring of its operating footprint, in addition to disposing of its legacy non-core exploration and production assets.
The planned restructuring includes the transfer of operations - a facility in the Netherlands will be closed, and various activities in Dubai will move to a larger site. There will also be a closure and transfer of activity in the United States/Mexico.
These sorts of changes don’t tend to come cheap, and so investors can look forward to large “exceptional” costs over the next year. Hopefully with benefits to the company in the years ahead.
Another point that stands out is the company moving from a cash position ($85.6m) to a debt position ($51.7m) over the last twelve months.
Hunting says that there will be “working capital efficiencies” in H2 of this year, with the borrowing position “expected to unwind by the year-end as larger projects are completed”. But it’s still a bit disconcerting to see such a huge drain of cash out of the company.
The cash flow statement for H1 shows a $50m increase in inventories, and $43m increase in receivables (amounts owed by customers). Largely because of these items, there is a significant cash outflow from operations ($34m).
So taking all of that into account, is Hunting currently in bargain basement territory?
If there is about to be an oil and gas boom, then the answer is still probably “yes”.
And if we have readers who have a strong view on oil and gas and have studied this company in more detail, I can see why they might take an outright positive stance on this stock today.
Based on current profitability, however, the current valuation seems fair to me:

The StockReport sees the same thing, giving it an almost perfectly average ValueRank of 47.
Speaking as someone who doesn’t have a strong opinion on prospects in oil and gas, I am therefore inclined to view this share as fairly valued. If it had a large net cash position and if its results were cleaner, I’d be more likely to take an outright positive stance.
See what our investor community has to say
Enjoying the free article? Unlock access to all subscriber comments and dive deeper into discussions from our experienced community of private investors. Don't miss out on valuable insights. Start your free trial today!
Start your free trialWe require a payment card to verify your account, but you can cancel anytime with a single click and won’t be charged.