Time your trades better with Charts & Signals
Everything you need to create stunning technical analysis studies on all your stocks. Create, annotate and save on every device... forever.


Easy-to-use
We were tired of chart interfaces stuffed full of strange archaic, fiddly behaviour nobody understands. We’ve designed our menus with inline search, easy to understand categorisation, stunning icons & inline guides to help you find what you need instantly. Never has a chart interface been so intuitive.
Mobile friendly
We’ve invested heavily in our chart software to provide the best multi-device, multi-touch experience possible. On a desktop you can use your mouse to point and click, but on a trackpad, tablet, or phone the experience is even more fluid with one finger drag left and right and double finger zooms in and out. Easy!
Helpful definitions for everything
Don't know your RSI from your MACD? Or don't understand which parameters to enter? Click the help icon next to any indicator or overlay to immediately read our inline guides. With definitions, help text and parameter descriptions we’ll guide you through the basics and save you from getting lost in a manual.With stunning coverage you’ll never have to look elsewhere
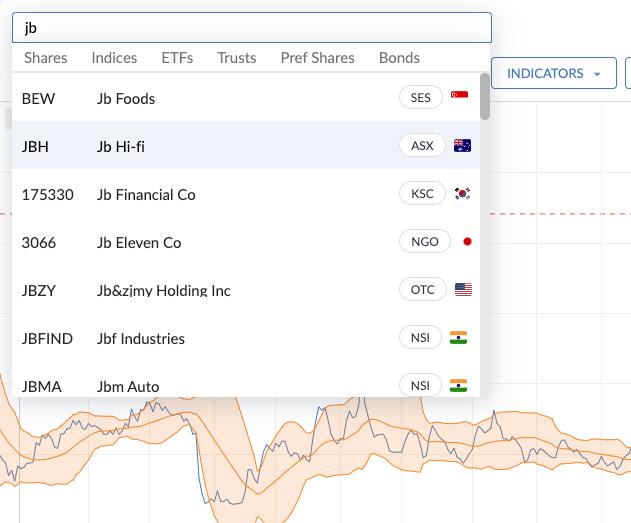
With more than 30,000 stocks now listed in Stockopedia’s global coverage we provide the most complete stock market coverage of almost any site globally. From Alaska, through Slovakia to Japan we include microcaps, over the counter stocks and exchange traded funds and indices. Get started today!
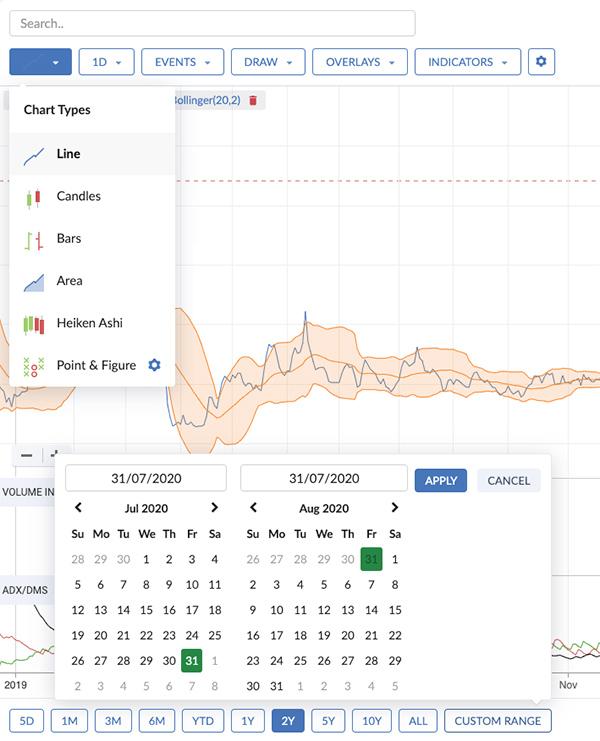
Assess charts over multiple timeframes to spot primary and secondary trends
Your chart capabilities are almost unlimited. You can zoom right into view a single week or zoom-out to see decades, change the periodicity to daily, weekly or monthly, edit the scales to view logarithmic, percentage or standard scales, move between line charts or candlesticks or use advanced Point & Figure and Heiken Ashi charts.
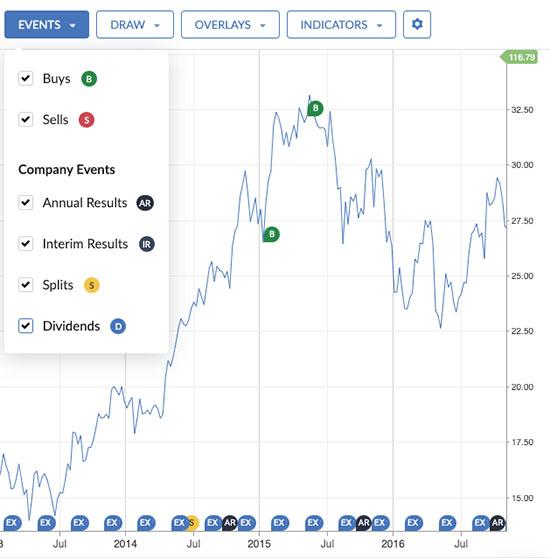
Know what happened in the real world at key price movements
Ever wanted to know what company results, dividend payments dates, splits and news happened right before a major price move in the past? We’ve got you covered with checkbox tick to add events published right on the horizontal axis.

As an active trader and private investor, having access to good quality Charting and Technical Analysis tools are vital. Stockopedia’s new charts, in combination with their comprehensive financial data, are quite unique. They deliver the overlays and indicators that I can use to help me time my trades.
After your free trial, plans start at just £295 per year. With a one month money back guarantee, you're in control.
Hear what our subscribers have to say about Stockopedia

It's extraordinary how it's opened up my everyday usage.

I no longer rely on other peoples opinion, I can check things for myself.

You can put in all the criteria you want and it's always there.
After your free trial, plans start at just £295 per year. With a one month money back guarantee, you're in control.
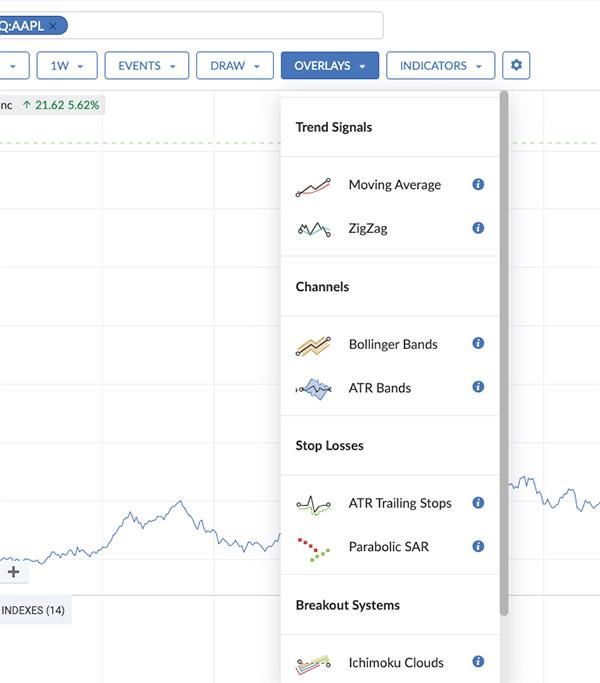
Instantly spot trending stocks & reversals using popular overlays
We believe every stock market investor should learn to use a simple moving average to spot trends, but if you want to take it further we’ve got you covered. With a complete array of overlays that includes channel indicators like Bollinger Bands, ZigZag trend signals, trading systems Donchian Breakouts and modern Japanese Ichimoku Charts you can ditch your clunky broker software and bring your analysis to one site.
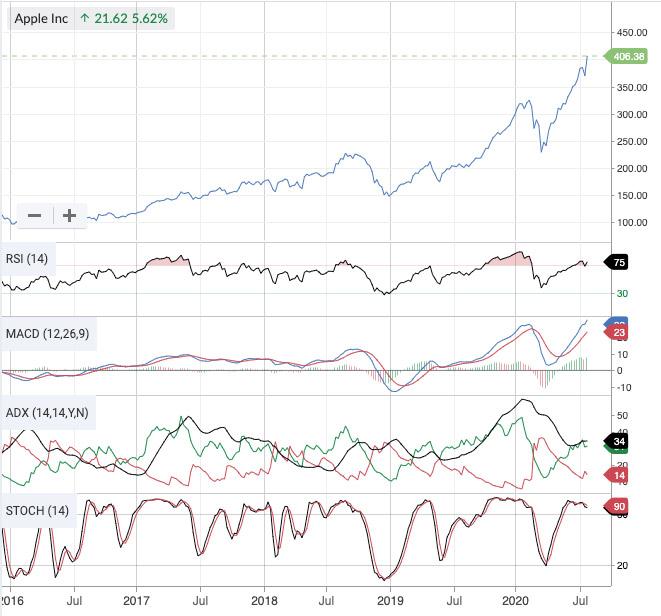
Stay ahead of turning points in share price & volume momentum
Swing or channel traders can use our complete suite of price and volume indicators to confirm new trends, reversals, convergences and divergences. You’ll find all the indicators you’d need including RSI, MACD, ADX & Stochastics.
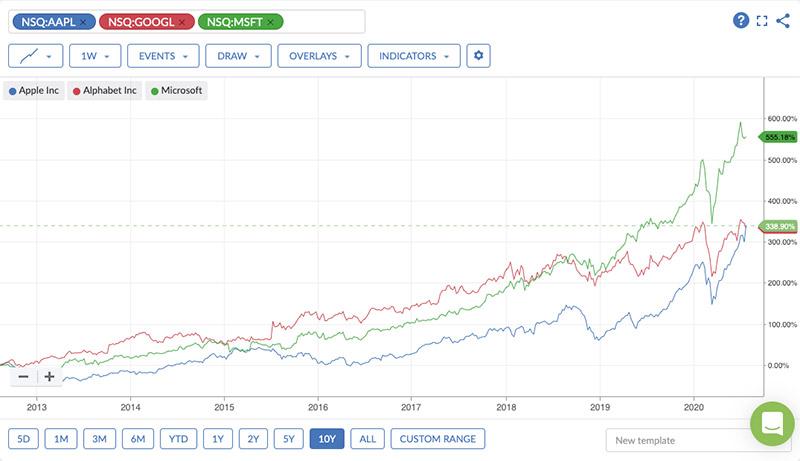
Compare stocks versus their peer group or the market
You can load multiple stocks onto the same chart to compare their performance over any timeframe. We automatically adjust the axes to show you the percentage change from the start of the timeframe so you’ll always win the argument of which stock’s outperformed which, and by how much!
Annotate your charts & find shares breaking out of ranges
If you need to know when to by or sell a share, a well drawn trend line can make it all the easier. You can draw single or multiple lines, zig zag charts, channels or regression lines using the toolkit we make available.
 Text
Text Callout
 Arrow
Arrow Freehand
 Rectangle
 Ellipse
 Single Line
 Continuous Line
 Regression Trend
 Channel
 Measurement
 Fibonacci Line
Widely acclaimed by financial press, investor
associations & famous influencers
“Stockopedia has always been miles ahead in its presentation of data and its carefully selected use of stock screens to identify great stocks.”
“Expensive fund managers should be looking over their shoulders.”
“Since I last wrote about advanced screeners for value investors Stockopedia has emerged as my favourite. For data, Stockopedia shines.”
“Stockopedia presents all the data on any company that you are likely to want, saving you doing the analysis - this is a highly recommended service.”
“One of the advantages of using Stockopedia is that it helps throw up companies that you would otherwise not find out about. It also helps investors avoid getting caught in the traps that even the biggest household name shares can lay.”
“Stockopedia is a great place to scan for new shares to buy. Each share gets a ranking, you can use 'guru' screens to find shares, there is even a stock screen loosely based on my criteria! There is lots more really fantastic material and I believe access should help investors and I now use it myself.”
After your free trial, plans start at just £295 per year. With a one month money back guarantee, you're in control.
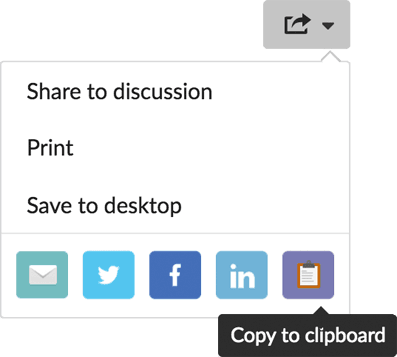
Export your charts or share them with friends on social media
You can easily export your annotated charts as PNG image files for safe keeping on your desktop, or you can share them in a single click, both to Stockopedia’s own discussion board, but also to Twitter, Facebook or any other social media site.
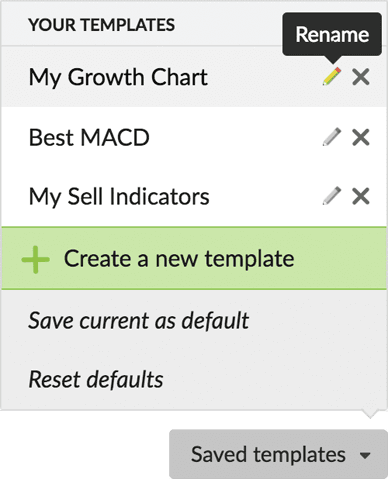
Save your favourite view settings to use every time you login
If you spend time getting a charting view perfect, with custom moving averages, timeframes, axes and more you won’t want to do it again. We provide three saved views which store your settings for future use. Login from any device and they’ll be there just as you left them.
Very important to me are the charts. The beauty of the charts is that you can put in all the criteria you want. So I've put in my moving averages, MACD, ADX - it's also always there whenever I click on charts. Absolutely fantastic. I do all my research on Stockopedia.
A subscription to Stockopedia will be one of the best investments you'll ever make...
Here's what you'll get:
- Find stocks likely to perform with proven Quality, Value and Momentum ranks
- Analyse shares in minutes, not hours with an all-in-one research platform
- Develop a consistent strategy with daily guidance and educational webinars
- Track and improve your results with portfolio analysis tools
- Become a self-reliant investor, saving thousands in advisory fees
Stockopedia is the perfect solution for active investors looking for more discipline and better results