2023 in review: How did the StockRanks perform?

Yesterday we published the first in our two part review of 2023. The first instalment, which you can read here, focused on the big events of the year. The stories that captured our collective attention and sent stocks (and sometimes whole sectors and markets) into a spin.
Today we turn our attention to the data. The cold, hard facts that tell their own stories of 2023.
Overall, there isn’t much to celebrate in domestic markets as the year closes. The FTSE All Share has bumped up and down all year, and although it has started to climb from its lows of late October, it looks like it will only end the year about 2% up. By contrast, the S&P 500 will close the year up more than a fifth - a late surge putting it near the highs of 2021. And Europe’s main indices have been somewhere in-between - lurching from a strong start, to a mixed year and ending with a rally.
On the other end of the spectrum there is Aim, which also hit its nadir on 27 October, but still ends the year down roughly a tenth. The largest companies on Aim have fared slightly better, with the AIM 100 down 8%. But less than half of those 100 stocks finished the year in the black. That’s a statistic that’s reflected throughout the UK. Only 40% of companies in the FTSE or Aim were ‘winners’ in 2023.
Stocks on top
Still, that’s not to say opportunities were completely absent. In total, 643 stocks in the UK ended the year up and 38 of those saw their share prices more than double, including three FTSE 100 stocks.
Leading the pack was Rolls Royce (up 214%) - a recovery play with a nod to nuclear energy revolution, which have together provided strong impetus for the shares in 2023. The company’s new chief executive took the helm in January and has led the way to a significant recovery in cash flows and margins, while widening defence budgets and growth in civil air travel have bolstered the end markets.
And the nuclear story is also an interesting one. While energy hasn’t been such a hot sector in 2023 compared to the previous year, there has been enough global unrest to prove that the world is still heavily reliant on fossil fuels and renewables technology just can’t deliver the energy required to power the modern world.
But nuclear energy could and the capacity for nuclear energy generation has grown rapidly in 2023. The UK now has a roadmap for generating 24GW of nuclear power by 2050 with the help of major nuclear reactors and small nuclear reactors, like those built by Rolls Royce.
Meanwhile on AIM, the top performer (and a wildly good performer having 10-bagged in the year) was oil and gas services company Plexus. The stock was one of 16 of the 20 best performing companies in the UK this year to have started 2023 with a market capitalisation of less than £10m. Micro-caps have certainly punched above their weight in providing some big wins. Of the 38 British stocks whose share price doubled in 2023, 23 of them started the year with a market cap of less than £20m.
Worth the risk?
But picking winners from the micro-cap sector is a risky game. Of the 443 companies which started the year with a market cap of less than £20m, 301 of them ended up underperforming, with a handful going all the way to zero.
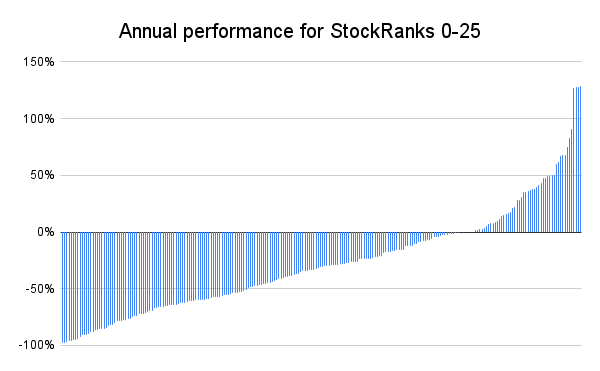
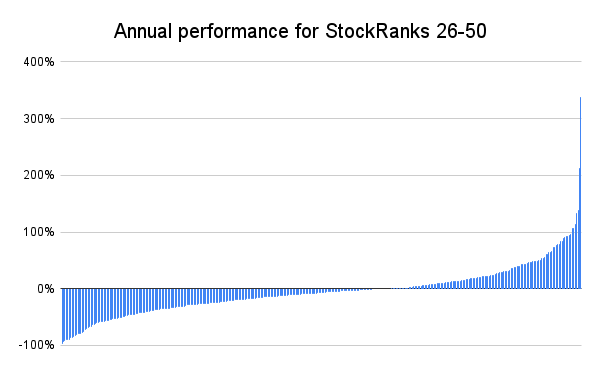
This balance between risk and reward mirrors the performance of our StockRanks, where the lowest ranked shares did generate some fabulous returns, but were more likely to end in disaster than their higher ranked peers.
For example, the charts below shows the companies which started the year in the two lowest quartiles of StockRanks. Although the best performing stocks in these buckets did perform phenomenally well (Hvivo, Carnival and Windar Photonics, among them), well over half of these low ranked stocks saw their share prices decline.
By contrast, the next two charts show the returns for the stocks ranked in the top two quartiles. Although the best performing shares (Yu Group for the 75-100 rank bucket and Rolls Royce in the 50-74 bucket), didn’t reach the same heights as their lower ranked peers, far more of them ended the year in positive territory.
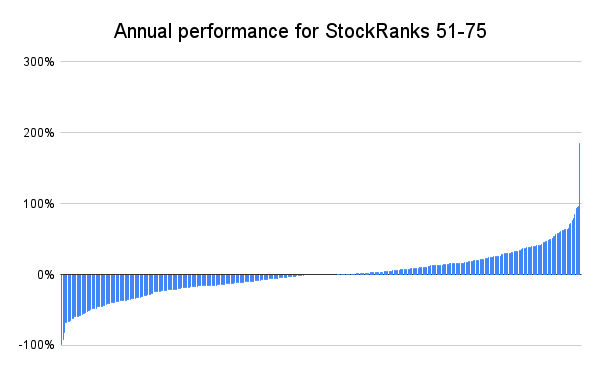
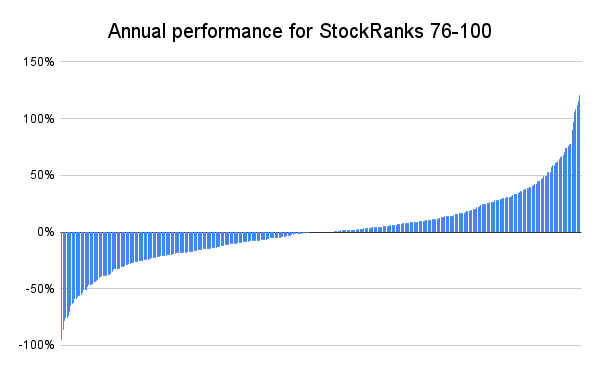
Overall, the median performance of stocks with a rank between 75 and 100 at the start of 2022 was flat over the course of the year, while the median performance of stocks with a rank between 0 and 25 was -31%. And among those lowest ranked companies, far more ended the year in a loss.
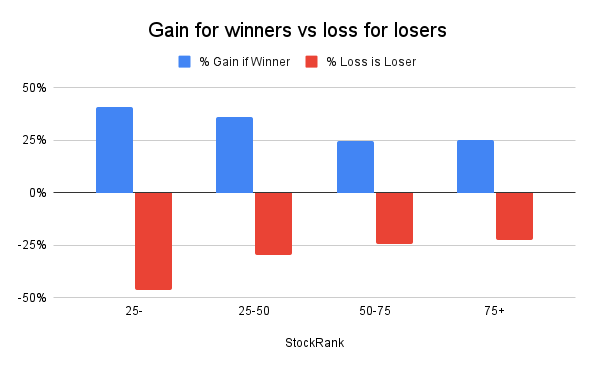
The chart below sums up the situation nicely: for the lowest ranked shares, the percentage gain for winning stocks is far higher than the percentage gain for winning stocks in the highest ranked bucket, but the percentage loss for the losing stocks is far, far deeper.
The lesson: tread carefully among the tiddlers and junk, the risks are highly likely to outweigh the rewards.
Disclaimer
This is not financial advice. Our content is intended to be used and must be used for information and education purposes only. Please read our disclaimer and terms and conditions to understand our obligations.
9 comments
Megan - I presume the StockRank you used for each company, was the SR on the 1st Jan 2023? Or is it the average SR or another method?
Megan, excellent summary. Thank you and well done. What a fiasco looking backwards to project forward regardless of macro, micro and sector analysis and claiming mathematical accuracy. It’s technical analysis and the mechanics of market makers that rule. We trade/invest against machines. Machines do not care they have no emotions. It’s a difficult situation
Are you able to provide a list of high stock rank losers? There might be something in that list which the stocks share in common? E.g. sector etc. By eliminating these we could (at least in theory) improve the performance of picking high stock rank corps.
This list is from my own database. The StockRanks and Mkt Cap are from 31/12/22 and the total return is % for the full year to 31/12/23. This list is not complete but gives a feel for the high stockrank losers.
As I explain to friends about stock ranks, I use them more to tell me what not to buy.
Well done Megan. Interesting stuff. How on earth do you get so much factual information together in one (two) article ?
Happy new year
Geoff
I'd love to see a list of Megan Boxall identified compounders and how that performed.
Such clear thoughts are very useful. thanks. Stock Ranks would never be one's sole guide, but a useful additional weapon in the armoury.
Great summary, many thanks Megan