A FCF/EV screen - finding a winning horse

When I wrote about Price-to-Sales, I called it the King of Value Factors quoting Jim O'Shaughnessy, who found that this was the best-performing Value factor for US stocks from 1951-2003. What was notable was how badly the decile with the highest Price-to-Sales did. This generated just a 3% compound return, less than inflation for the period:
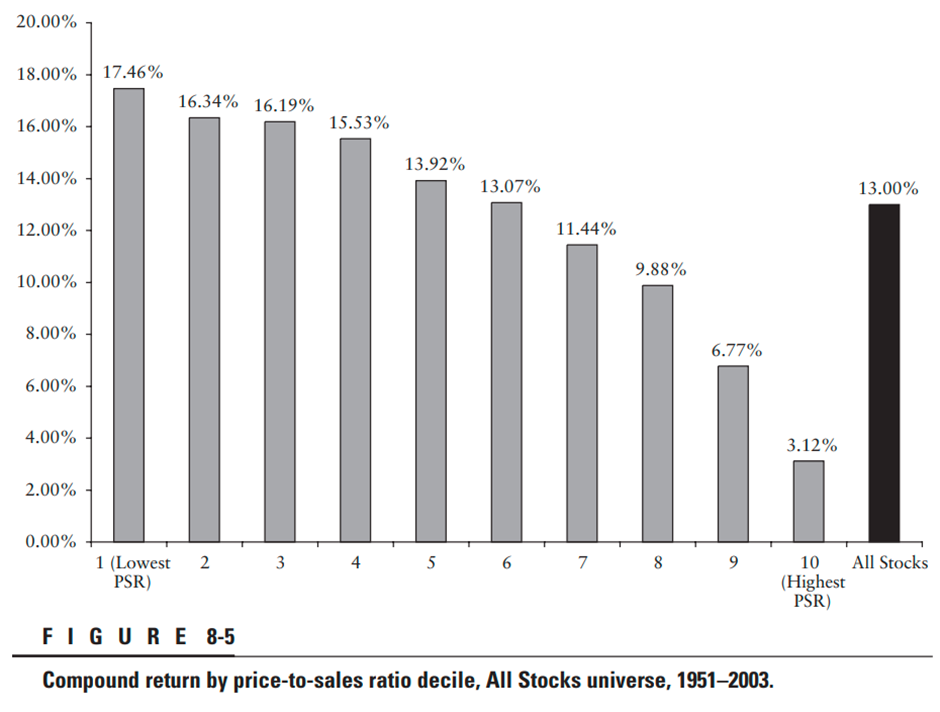
One thing is clear from this long-term study: investors really don't want to be in the highest Price-to-Sales stocks. However, 2003 is a long time ago and reflects a general market nadir, which may have undue influence on the results. When Gray and Carlisle did their pretty exhaustive study into which value factor performed the best, using 1971-2011 data, Price to Sales didn't even make the running.
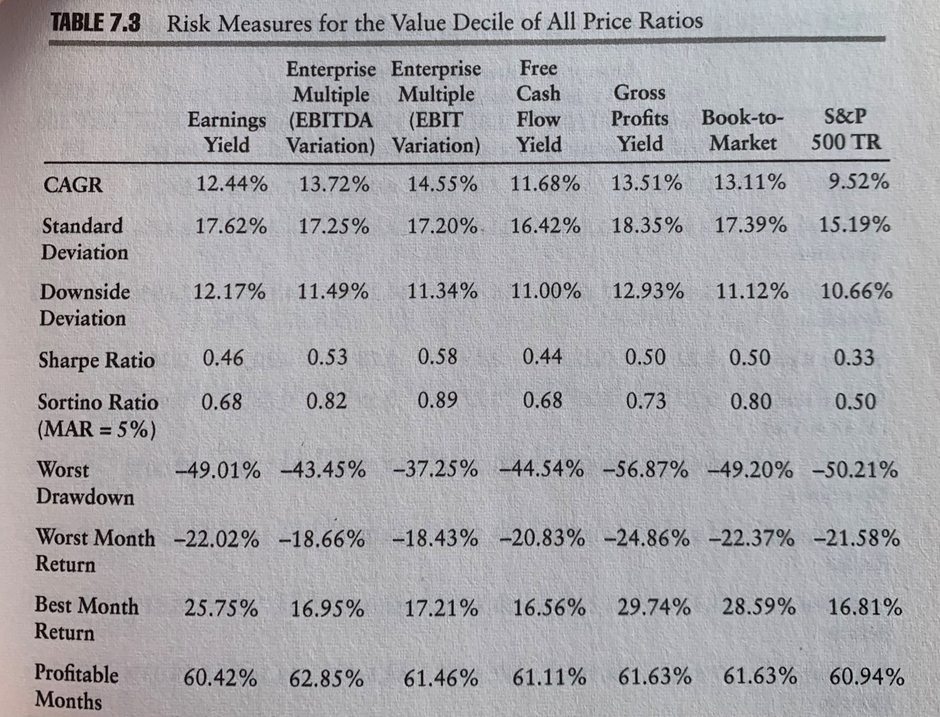
Reader @iwright7 pointed out in the comments that there have been some more recent studies than this. For example, in 2014, Jim O'Shaughnessy’s son Patrick suggested screening for EV/FCF <10 as a good Value metric. He also quoted the following research called An Update on the Valuation Metric Horserace: 2011-2015, also by Wes Gray, with Jack Vogel, which concluded:
B/M REALLY stunk.
Enterprise multiples stunk (although variations such as EBIT/TEV were a bit better).
E/M (which represents P/E) were lame.
Gross profits / TEV results were pretty solid.
FCF/EV was great!
So we now have data as recent as 2015, which suggests we should be looking at EV/FCF. And I agree FCF is an excellent value metric. At the end of the day, a business is worth the net present value of the cash it returns to shareholders over its life. Producing large amounts of cash flow now, which could be returned to shareholders if appropriate, is a good sign.
It is tempting to think that we could build a very simple screen taking the lowest decile on EV/FCF (we want companies with the highest FCF), exclude the very smallest companies and invest in the whole set to generate market-beating returns. Something like this:

However, we must be careful about throwing away all the other Value metrics. The results that Gray & Vogel are referring to are for the five years from 2011-2015. When they look at the full sample from 1964-2015, EV/FCF is good but does not exactly stand out:

This backs up what Jim O'Shaughnessy found in his 1951-2003 study; FCF generates good but not exceptional results (he used Price-to-Free-Cash-Flow, not Enterprise Value):

Free Cash Flow remains one of the most important metrics for a Value investor. Since it is from this that dividends, buybacks and acquisitions are ultimately funded. As the saying goes: Sales are vanity, profits are sanity, but cash is king!
In order to build a better EV/FCF screen, it is worth going through how Free Cash Flow is calculated and what that may mean.
Calculating Free Cash Flow
The calculation can be found in the Cash Flow Statement in the accounts. The starting point is the Profit Before Taxation from the Income Statement. For some companies, the Cash Flow Statement contains all of these figures. But many companies choose to bridge between this and cash generated from operations as a separate note in their financial statements. For example, Capital (LON:CAPD) chooses to do this, and it is Note 10 in the last set of interim results:


Starting with Profit Before Taxation, firstly, non-cash items from the Income Statement are added back. The biggest one is usually Depreciation, which is an assessment of how much the fixed assets have lost value in the period, and then Amortisation, which is the same for intangible assets. Many companies now give key employees share options and an estimate of the cost of these impacts the company's profits. However, since these payments are in shares, not cash, these costs are added to the cash flow statement. Share-based payments are increasingly popular and are a real cost to shareholders. So investors need to be careful of egregious examples when investing in specific companies. However, it isn't easy to screen for this, so this should be part of an investor’s post-screen check.
The impact of Foreign Exchange, Interest and Finance charges also get added back with any other non-cash charges. This is because the cash amount paid for these in the accounting period may vary from the amounts in the income statement. These cash amounts will come back out later in the Cash Flow Statement. Here is the full bridge for Capital (LON:CAPD) prior to the impact of working capital:

Another factor worth bearing in mind here is the impact of IFRS16 and its treatment of lease assets. To ensure that lease assets and liabilities are included in the balance sheet, accounting standards now replace lease payments with depreciation and interest charges. While this amount is small for Capital (LON:CAPD) , investors need to be wary of this effect for companies that lease most of their assets. For example, in their recent results, DX (Group) (LON:DX.) Reported a figure they called "Net Cash Profit":

A £25.5m Net cash profit sounds great until you realise that the £13.5m of Depreciation is based on lease assets underIFRS16, and later in the cash flow statement, there are £11m of lease repayments and £2.4m of lease payments that are classified as interest. So the actual increase in cash for the company was much closer to their accounting profit than the "Net Cash Profit" they calculated here.
At this point in the Cash Flow Statement (or associated notes), the effect of changes in working capital is taken into account. The impact for Capital (LON:CAPD) is to reduce cash generated from operations by about $10m:

It is normal for a rapidly growing company to increase its working capital like this. However, some companies may generate a high level of free cash flow simply by reducing their working capital. Unless a company operates with negative working capital (as many retailers do) and can expand forever, generating significant cash flows from operations mainly via squeezing working capital is unsustainable. Value investors want to be investing in companies that will generate prodigious cash flow over many years rather than one-off gains.
One way to protect against getting screen results that are generating the majority of their cash flow via working capital is to include EV/EBITDA as a screening factor:

Here I am not being as strict as the EV/FCF requirement because I still want this to be the primary screen, but by asking for a 70% Rank in Market, I am ensuring the majority of the cash flow comes from profits, not working capital changes.
We return to the Cash Flow Statement, and now the cash taxes and interest are included (which may differ from those in the income statement due to timing issues or other factors). Then cash spent on capital expenditure (tangible or intangible) plus other investments goes out. Again, using Capital as an example:

At this point, investors need to be wary of capital expenditure that is significantly below Depreciation. Many investors look for the opposite since unusually low Depreciation can signal that a company is maybe trying to flatter its accounting profits. However, here we are looking for unsustainable cash flows caused by not spending to replace worn equipment. Again this risk is difficult to screen for (if readers have any ideas, please comment below). However, this factor should be on an investor's checklist for further research into these screen results.
The final part of the cash flow statement has the cash flow from financing activities. This is where the impact on cash balances of changes in debt, dividends paid or shares repurchased is accounted for. From the point of view of calculating Free Cash Flow, the easiest way is to take the change in cash and add dividends paid and cash spent on share buybacks.
Considering the Enterprise Value
This screen uses Enterprise Value, which is Market Capitalisation plus net Debt. This introduces a couple of quirks into the mix. First, some companies have a negative EV because they hold more net cash than their market cap. This can indicate significant undervaluation. However, far more commonly, this is because companies have significant negative working capital at their last balance sheet date as a result of seasonal fluctuations in cash and carefully chosen end-of-year dates. I exclude these together with the Industry Group "Collective Investments" since these types of funds are also likely to be misleading from an EV/FCF point of view:

Finally, because I am excluding a number of companies via the above restrictions, I slightly relax the EV/FCF criteria to ensure a sufficient variety of screen results:

The final screen gives 42 screen results across 16 Industry Groups:

Although, as you might expect in current markets, many of the high FCF shares come from Energy and Mining sectors:

Investors will likely recognise some value investing favourites but also find some interesting new ideas on this list to research further.
[Disclosure: Mark owns shares in Capital (LON:CAPD) ]
Disclaimer
This is not financial advice. Our content is intended to be used and must be used for information and education purposes only. Please read our disclaimer and terms and conditions to understand our obligations.

4 comments
Mark,
A further comment in relation to EV/FCF to add that I like your additional EV/EDITDA >70% market, screening rule. This is because as good as EV/FCF is there is a danger when a single Value metric is used to choose stocks, that the screen is going to select stocks whose fundamentals happen to be exaggerated for that particular metric.
The market may spot this exaggerated aspect and price correctly, but with less company research and institutional restrictions in small caps I do believe that small caps offer the best chance of outperforming, even when a single value metric is used.
Instead of placing our bets on a single metric, we can also use an array of well-tested factors e.g. such as the Stocko Value composite (+ Quality and Momentum composites) to mitigate an abnormal metric. The different factors will cover each other’s blind spots, helping to improve the chance of winning.
Mark,
Thanks for the "hat tip" in your excellent review. I know you are a Value investor, though I like to mix up investing styles and particularly like high Quality/Momentum (QM) type stocks . Your screen (with a couple of adjustments) allows for this too.
I upped the min Mrk Cap to £25M to exclude the minnows and ordered your EV/FCF screen output by QM Rank. This produces the following results:
We now get 15 high QM stocks and because your EV/FCF criteria has screened out expensive junk, these 15 turn out to be high VM to; far right column). On paper we have the best of the Value, (with added Quality and Momentum) worlds, which are suitable for further research.
Disclosure - I use a similar EV/FCF screening method and hold 5 of these 15 stocks. I do particularly like £Jet2.
Great content. Thanks for sharing
Mark,
Interesting article. Must admit I've never used EV/FCF as a valuation measure before.
However, it highlights one of my bugbears with regard to screening on Stockopedia i.e. the FCF screening options are limited to TTM only! Screening for trailing twelve months is all very well but one year's impressive FCF does not really tell you very much, or indicate whether company is an undervalued cash generating machine, or not. FCF varies so much from year to year (generally much more than EPS) that what is really needed is an indication that FCF has been good over a number of years in the same way that there are multi-year averages for metrics such as ROE, ROCE and OM. Currently, this is a manual check I have to perform rather than use FCF TTM as part of a screen, which I find too limiting.
All the best, Si