Altman Z-Score: What to Look Out For

Since the pandemic began, I’ve noticed the Altman Z-Score has been attracting a lot of interest on Stockopedia. We have all become more focused on avoiding companies which may fall into financial distress, during this extremely difficult economic environment.
I studied for a Master’s Degree in Investment Analysis five years ago and my dissertation included a review of the academic literature on financial distress and failure prediction models. The most famous bankruptcy prediction model is of course, the Altman Z-Score. I thought I would share my findings here.
Some of the following sections may be a bit ‘academic’ in style - please forgive me for not re-writing the whole thing. I’ve included the original references to various academic articles as well, in brackets. If the articles prove difficult to obtain online and you really are interested, then I still have many of them stored on my hard drive, so feel free to send me a message asking for a copy.
Altman Z Score - Background & Limitations
First of all, please see this link for a previous article explaining the Altman Z-Score and this link for Stockopedia’s Z-Score short-screen page. These do a fine job explaining the model itself.
The seminal works on bankruptcy prediction came from Beaver in 1966 (124) and Altman in 1968 (125). Beaver’s univariate analysis was the first to show that financial ratios differed significantly between failed firms and non-failed firms. Altman expanded on Beaver’s work by developing a multivariate model. Altman’s Z-Score is still the most widely used and famous model despite several attempted alterations since its inception and many researchers criticising its underlying methodology (126).
Bankruptcy costs have long been considered in academic research as an important component of the debate around capital structure. A conventional (theoretical) view is that debt should be increased until the direct and indirect bankruptcy costs outweigh the associated tax benefits (112). Bankruptcy prediction models are an extremely popular area of research: one 2015 study identified 83 articles containing 137 different models (122). Most studies are based on US data and 95% focus on large PLCs (123).
Altman’s 1968 model is generally considered unsuitable for analysing contemporary British businesses (127, 128). In fact, the application of most US models to the UK is questionable, due to differences in accounting methods and insolvency codes between the two nations (129), and also because statistical models are highly customised to their specific sample data - in Altman’s case, 66 manufacturing firms in 1960s America. Taffler produced the best-known British Z-score model in 1983 (130).
Some Technobabble (feel free to skip): There are a number of issues with statistical failure models. The neglect of non-financial information is well known, as is a ‘brute empiricism’ approach where explanatory variables are selected purely on data crunching rather than theory (136). An absence of theory means a sustained relationship between the dependent and independent variables cannot be relied upon (137), and a variety of studies have supported this by showing stationarity and data stability do not exist (138). Time-series behaviour is mostly ignored as models are based on cross-sectional data. Technical issues also exist around non-linearity (139), multicollinearity and over-sampling of distressed firms (140).
Z-Score Results in Practice - Not What You‘d Think
Overall, bankruptcy prediction models are only designed as categorisation tools to determine whether a firm displays similar characteristics to a group of failed firms within a specific sample. In these studies type 1 error is a failed firm being classed as non-failed and type 2 error is a non-failed firm being classed as failed. With a focus on reducing type 1 error it is perhaps more useful to turn the proposition on its head – that these models are better used for identifying firms that aren’t at risk of failure.
There are many more non-failed firms than failed firms: between 1980-2015, the typical failure rate for publicly-listed US firms varied between 1% - 2.5% in normal non-recession years, rising to an average of 4.5% during recessions and 5.3% in the worst year in 2009.
Taffler reviewed his model in 2007 and found that only 3% of his ‘at risk’ firms failed within a year (131). Further, in 2000 Altman found his model was classifying up to 20% of contemporary firms as ‘at risk’ (134). Therefore a very high percentage of firms classed as ‘at risk’ will not actually fail: given that only around 2% do typically fail each year, circa 90% of Altman’s ‘at risk’ firms would still be standing perfectly intact a year later.
If we review Stockopedia’s current Z-Score short-selling screen, we can see that 550 London-listed firms are on the danger list. There are roughly 2,000 companies trading on the LSE, so that’s around 25% classed as at risk of bankruptcy. It is safe to bet that only a very small proportion of them go bust in the next year... or even the next five.
Stockopedia’s Z-Score page states ‘Tests over 31 years to 1999 found the Z-Score to be 80-90% accurate in predicting bankruptcy one year prior to the event.’ Hmm. That statement could easily be misleading. What this actually means is that c.90% of firms that do go bust, will have a poor Z-Score. But not 90% of firms with a poor Z-Score will go bust. Far from it, less than 10%!
So what is useful to focus on?
Subjective Factors to Watch Out For
A company is technically insolvent if the book value of liabilities exceeds the book value of assets, however this rarely triggers failure on its own. Cash flow insolvency exists when a company cannot meet its immediate obligations and is the primary cause of failure in the UK (94, 95).
For mature firms, failure usually comes after a prolonged period of decline lasting up to ten years (96, 97). Long-term decline is itself widely attributed to poor management and misguided strategy (98, 99) with Altman suggesting 90% of failures can be traced back to management in some way (100). Many studies characterise failed firms as suffering from inertia: losing touch with customers and failing to respond to strategic threats (101).
CEO dominance is often cited, causing failure if the individual is egotistical and uses the firm as a vehicle to pursue their own ambitions (102). Certain studies find that declining firms often avoid crisis if they have fresh management teams with significant industry experience (103, 104), and others find that a successful turnaround is sometimes achieved when firms end an existential threat through their strategic actions (105).
Quantitative Factors That Do Provide Vital Clues
Firstly - the share price!
Altman’s Z Score focuses on historical accounting data. However, the importance of market information is demonstrated by the fact that stock prices appear to clearly contain valuable information about impending failure. Stock prices usually fall continuously as failure approaches (147) with the average price decline being 80% in the years prior to bankruptcy (148). Even Beaver’s original work identified a low stock market valuation as a helpful predictor (149). Of course, a low market capitalisation actually contributes to bankruptcy, as it severely limits the amount of fresh equity that a firm is able to raise (150).
In terms of other metrics, a variety of different variables are proposed as being most important to failure prediction, depending on which studies you look at. Beaver originally found cash flow/total debt to be best and in 2013 this was still found to hold predictive power (151). Research generally focuses on profitability, gearing, liquidity and company size - and economic influences are significant. Credit ratings also prove useful, where available.
In my view Beaver provided basically the most useful insight way back in his original analysis: showing that key fundamentals tend to decline at accelerated rates and become negative in the years prior to bankruptcy, while the ratios for surviving firms remain stable (Figure 4.2). Recent studies have confirmed these relationships still hold true:
Figure 4.2: Deterioration of Key Fundamentals in Years Prior to Business Failure
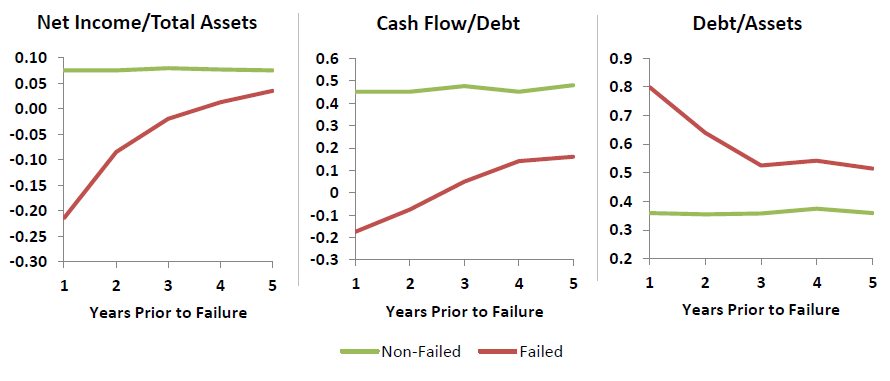
Source: Beaver (1966)
Conclusion
To sum up, quantitative prediction models cannot accurately and reliably provide a probability of business failure within any given timescale. The prediction of bankruptcy will always retain an element of subjectivity. Events and chance play a role.
If you want to focus on avoiding companies which might become bankrupt, any company which has a good Z-Score is likely to be safe. But a company with a poor Z-Score probably won’t go bust either!
You would be best advised simply to pay attention to the share price - if Mr Market is telling you something is wrong, that’s the best cue available, and if some common-sense variables such as profitability, cash flow and debt are also deteriorating, then you really can’t hope to get a clearer warning signal.
References
98 Sheppard & Chowdhury (2005), ‘Riding the Wrong Wave: Organizational Failure as a Failed Turnaround’, Long Range Planning
99 Argenti (1976), Corporate Collapse: The Causes and Symptoms
100 Altman (2006), Corporate Financial Distress and Bankruptcy
101 Ooghe & De Prijcker (2008), ‘Failure processes and causes of company bankruptcy: a typology’
102 Hambrick and D’Aveni (1992), ‘Top team deterioration as part of the downward spiral of large corporate bankruptcies’, Management Science
103 Greening and Johnson (1996), ‘Do managers and strategies matter? A study in crisis’, Journal of Management Studies
104 Purves, Niblock & Sloan (2016), ‘Are organisations destined to fail?’, Management Research Review
105 Sheppard and Chowdhury (2005), op. cit.
112 Hillier, Jaffe, Jordan, Ross & Westerfield (2013), Corporate Finance, Chapter 16
122 Appiah, Chizema & Arthur (2015), ‘Predicting corporate failure: a systematic literature review of methodological issues’, International Journal of Law and Management
123 Ibid
124 Beaver (1966), ‘Financial ratios as predictors of failure’, Journal of Accounting Research
125 Altman (1968), ‘Financial ratios, discriminant analysis and the prediction of corporate bankruptcy’, The Journal of Finance
126 for the most scathing review see: Shumway (2001), ‘Forecasting bankruptcy more accurately: a simple hazard model’, Journal of Business
127 Agarwal & Taffler (2007), ‘Twenty-five years of the Taffler z-score model: does it really have predictive ability?’, Accounting & Business Research
128 Charitou, Neophytou & Charalambous (2004), ‘Predicting corporate failure: empirical evidence for the UK’, European Accounting Review
129 Ibid
130 Taffler (1983), ‘The assessment of company solvency and performance using a statistical model’, Accounting & Business Research
131 Agarwal & Taffler, 2007. "Twenty‐five years of the Taffler z‐score model: Does it really have predictive ability?,"
136 Balcaen & Ooghe (2006), ‘35 years of studies on business failure: an overview of the classic statistical methodologies and their related problems’, British Accounting Review
137 Blum (1974), ‘Failing Company Discriminant Analysis’, Journal of Accounting Research
138 Balcaen & Ooghe (2006), op. cit.
139 Lennox (1999), ‘Identifying failing companies: a re-evaluation of the logit, probit and DA approaches’, Journal of Economics & Business
140 Balcaen & Ooghe (2006), op. cit.
147 Altman & Narayanan (1997), ‘An International Survey of Business Failure Classification Models’, Financial Markets, Institutions & Instruments
148 Warner (1977), ‘Bankruptcy costs: some evidence’, The Journal of Finance
149 Beaver (1968), from Scott (1981), The probability of bankruptcy: a comparison of empirical predictions and theoretical models’, Journal of Banking and Finance
150 Scott (1981), ‘The probability of bankruptcy: a comparison of empirical predictions and theoretical models’, Journal of Banking and Finance
151 Jackson & Wood (2013), The performance of insolvency prediction and credit risk models in the UK – a comparative study’, British Accounting Review.
Disclaimer
This is not financial advice. Our content is intended to be used and must be used for information and education purposes only. Please read our disclaimer and terms and conditions to understand our obligations.
7 comments
Power Metal Resources (LON:POW) SR 9 sucker stock has a Altman Z score of 1,095.79.
1095.79 is clearly wrong. If you look at the breakdown of the Z score Power Metal Resources (LON:POW) only passes one of the tests.
Yes i imagine this is not correct. How many others are also wrong? Reliability of data on this site has been commented on previously.
Why is it wrong? How is the Z score calculated and which numbers in this case are wrong? You should answer these questions before publicly stating that the data is unreliable.
"You would be best advised simply to pay attention to the share price - if Mr Market is telling you something is wrong, that’s the best cue available"
Yes indeed.
Had a look at the Altman screen you posted, it was ok down about 20% in March 2020 but since then the shares have really taken off, up nearly 150%, Im wondering if this is to with U.K. government support?
Also have read business failures have been lower last year than usual, that will change soon.
Well, that explains a lot! Thanks - v interesting.