Beating the Market with LLMs & RNS Guidance Signals

They say, ‘we shape our tools, then our tools shape us’. That saying is attributed to the media theorist Marshall McLuhan, but the idea is relevant to investing. We create new forms of financial information, then that information shapes the way we analyse stocks. In the early 1900s, ticker tape and the availability of price data meant that traders like Jesse Livermore could try their hand at trend-following strategies. Later, in the 1930s, new regulations made financial statements more standardised and informative, helping investors use these ‘cleaner’ statements to develop new methods, like fundamental analysis and value investing.
Information and technology are always evolving and the investment world evolves too. In this age of AI and LLMs, we can augment statements and price data with new layers of analysis. There is a particularly interesting job to be done in transforming semi-structured text and language into a clear set of bullish, bearish or neutral signals. We have done a lot of research in this area and would like to share our early findings.
We have focused on earnings guidance signals and explored whether they can be used to beat the market. Before we look at the results, let’s take a closer look at how our approach works…
When Companies Move the Goalposts
Companies constantly give updates on how they expect to perform - we call this ‘guidance’. Think about that turn of phrase that often shows up on a trading statement, something like: 'We are pleased to announce an increase in our revenue guidance, from £xzy to £abc.' Guidance is self-defined by the company. It is distinct from market ‘expectations’ - i.e. what brokers/investors expect the company to deliver.
In a sense, when companies issue guidance, they are arguably setting the pass mark for their own homework. But what if a student voluntarily raised that pass mark? Perhaps said student is confident of a good grade.
We explored this question further by building an LLM pipeline which read thousands of RNS statements and classified each update as a guidance upgrade, downgrade, or unchanged. We then tested whether these signals are associated with particular share price trends.
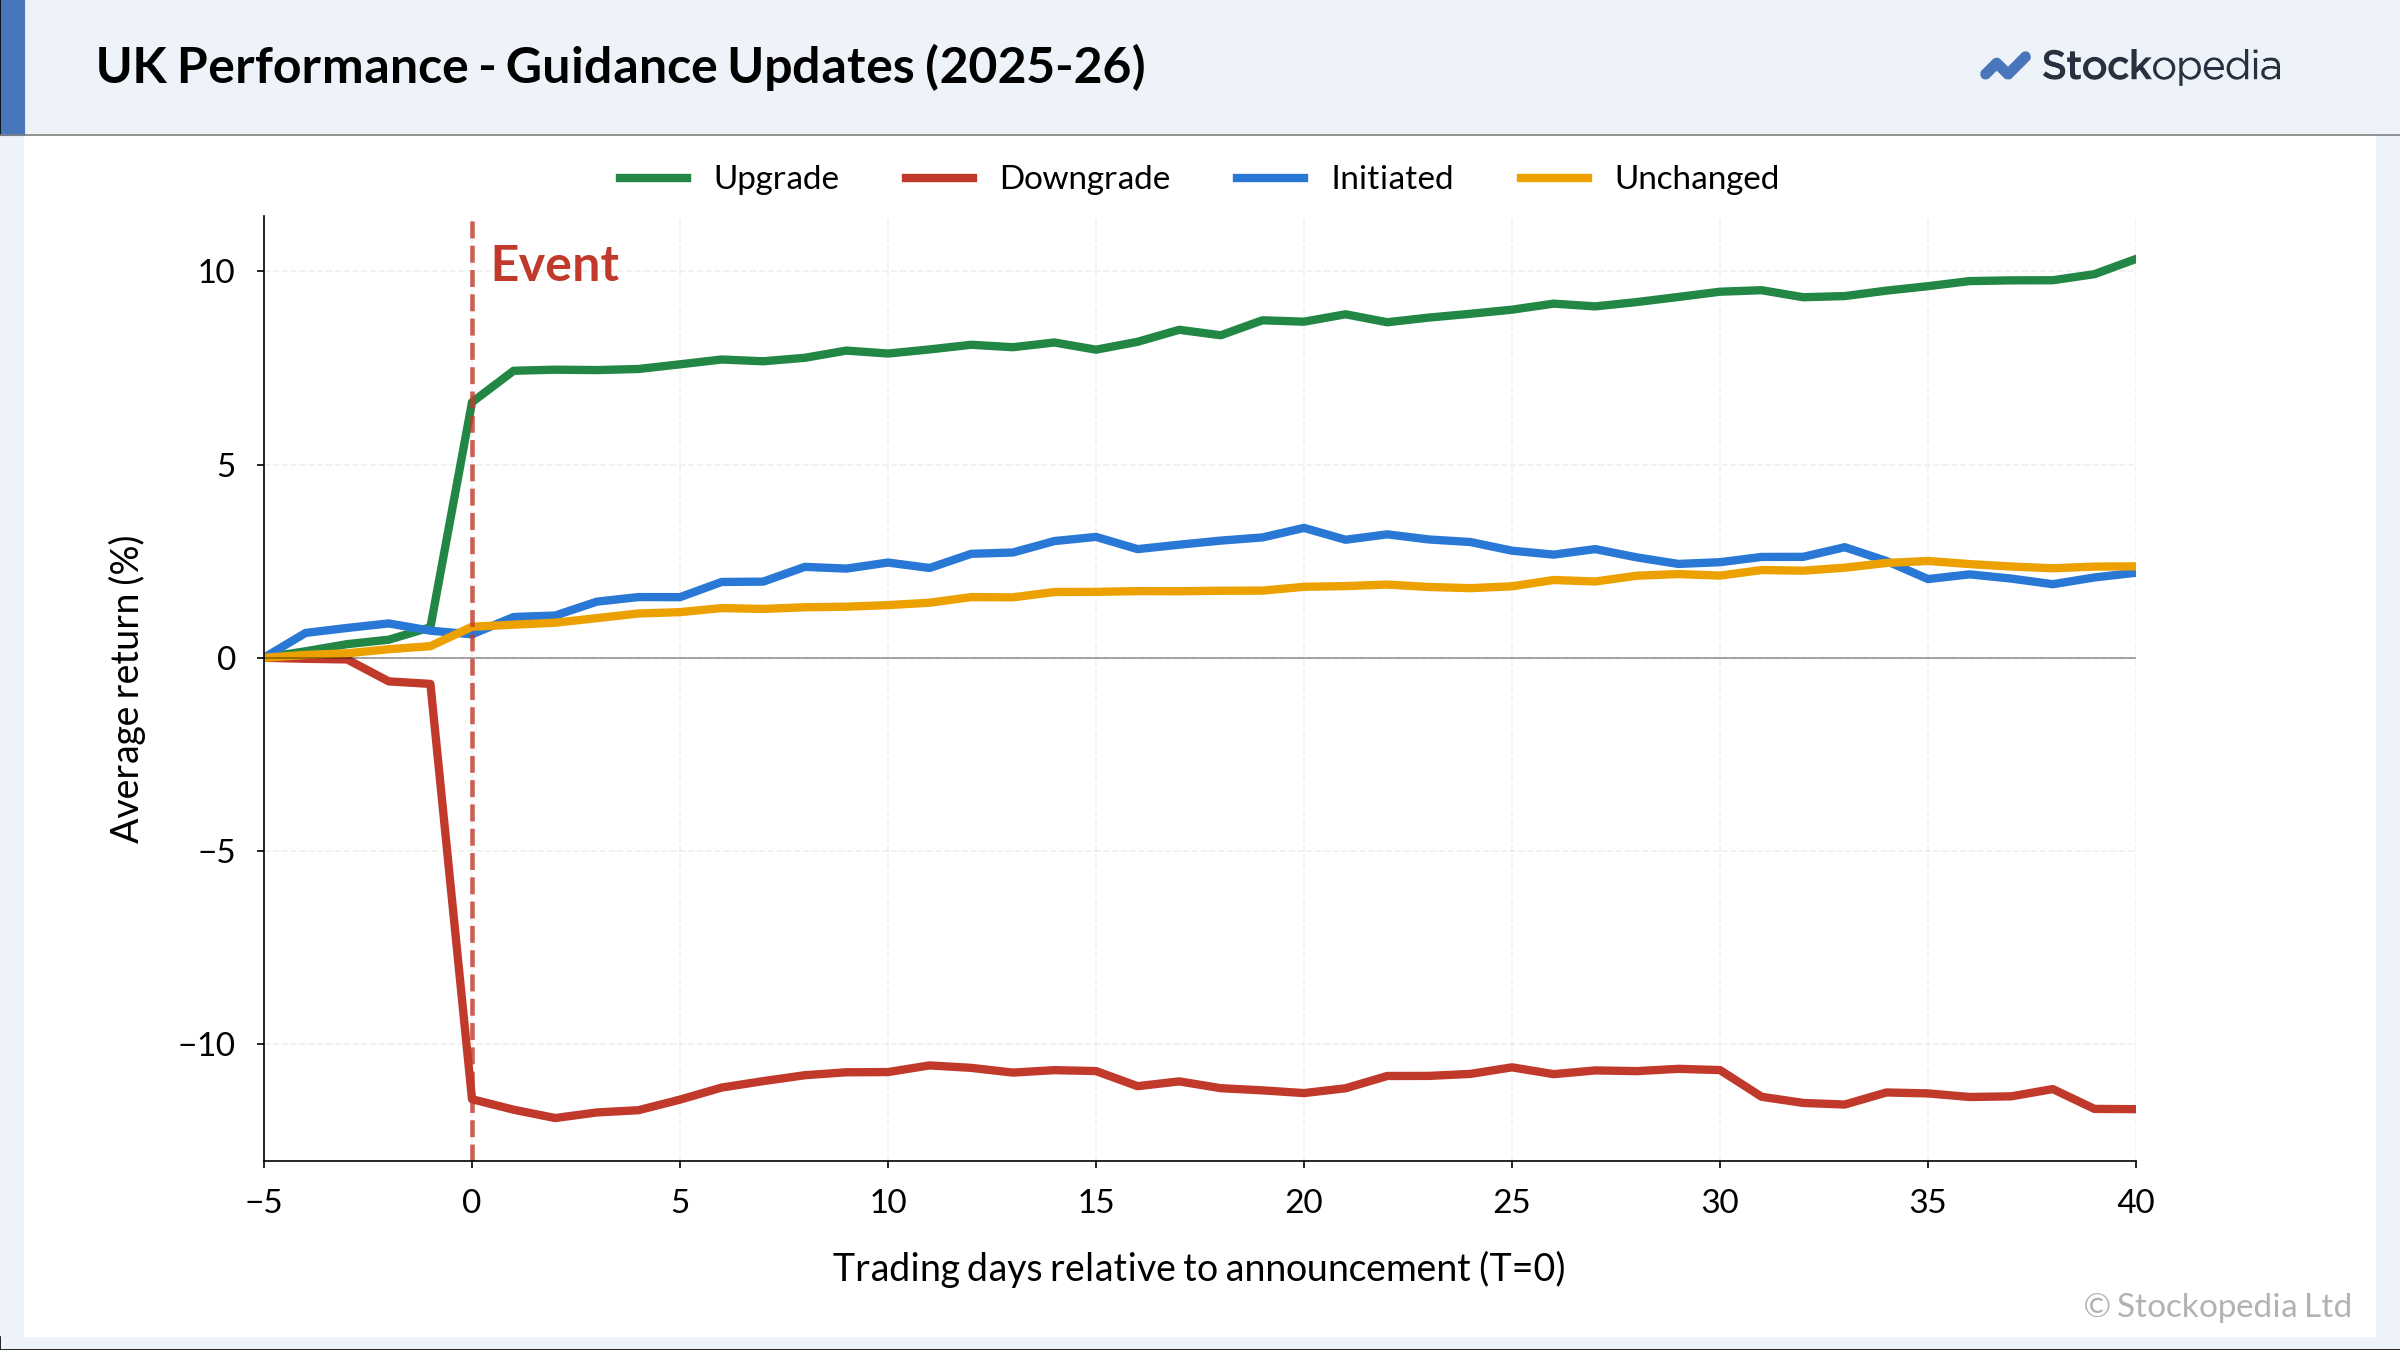
Guidance changes clearly move the share price. The trajectory can be divided into phases.
The Build-up. Prices drift up ahead of upgrades and drift down ahead of downgrades, quite possibly because information ‘leaks’ out before the RNS.
The RNS day. Notice a big move when RNS is published. Prices can spike or drop by around 5-10%
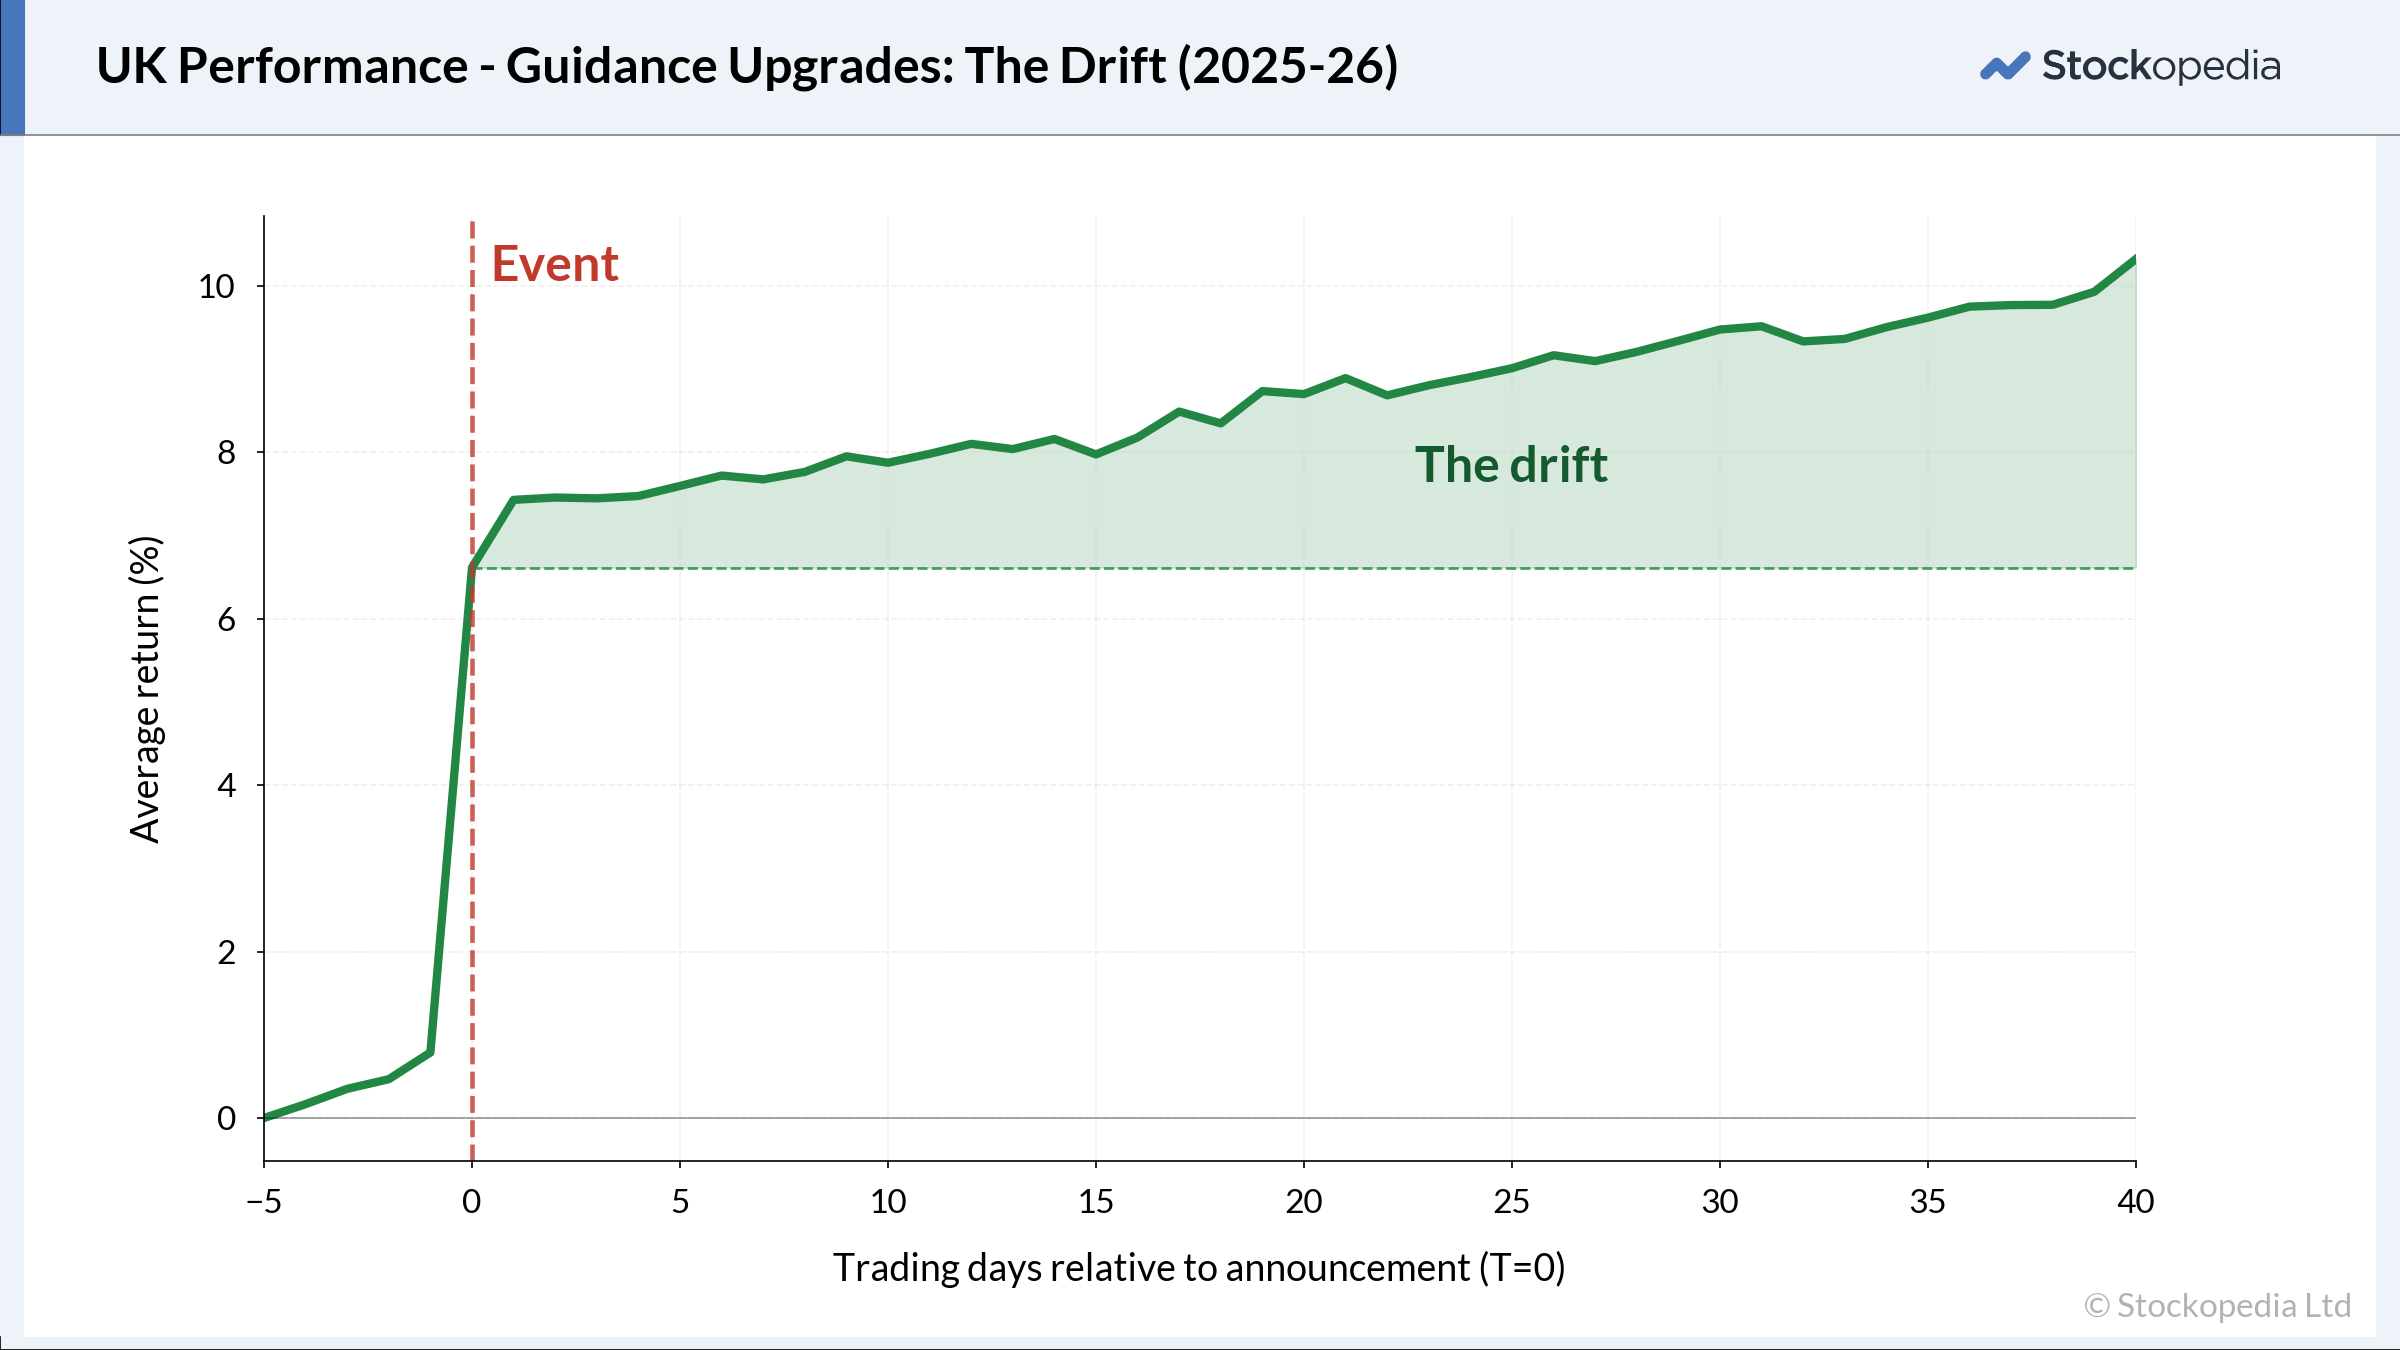
The Drift (PEAD). Prices keep moving in the same direction over the following weeks, as analysts update models, or larger, slower-moving investors adjust their position.
The gap-up isn't necessarily where the money is made. The stock will typically jump on the open—by 8:00 or 8:30am—leaving little or no room to get in on the day (unless you already hold the stock).
The drift is where the secret afterparty can be found. An upgrade can keep paying off after the headline. Perhaps this makes it worth resisting the temptation to cash in on the initial price jump. There’s a chance the stock will keep trending higher.
The next question is: does it make sense to hold out for another price spike? Let's take a closer look...
Do revisions repeat?
In the ideal world, we would have a model to predict guidance upgrades and downgrades. We are not quite there yet, but the numbers already reveal several useful rules of thumb.
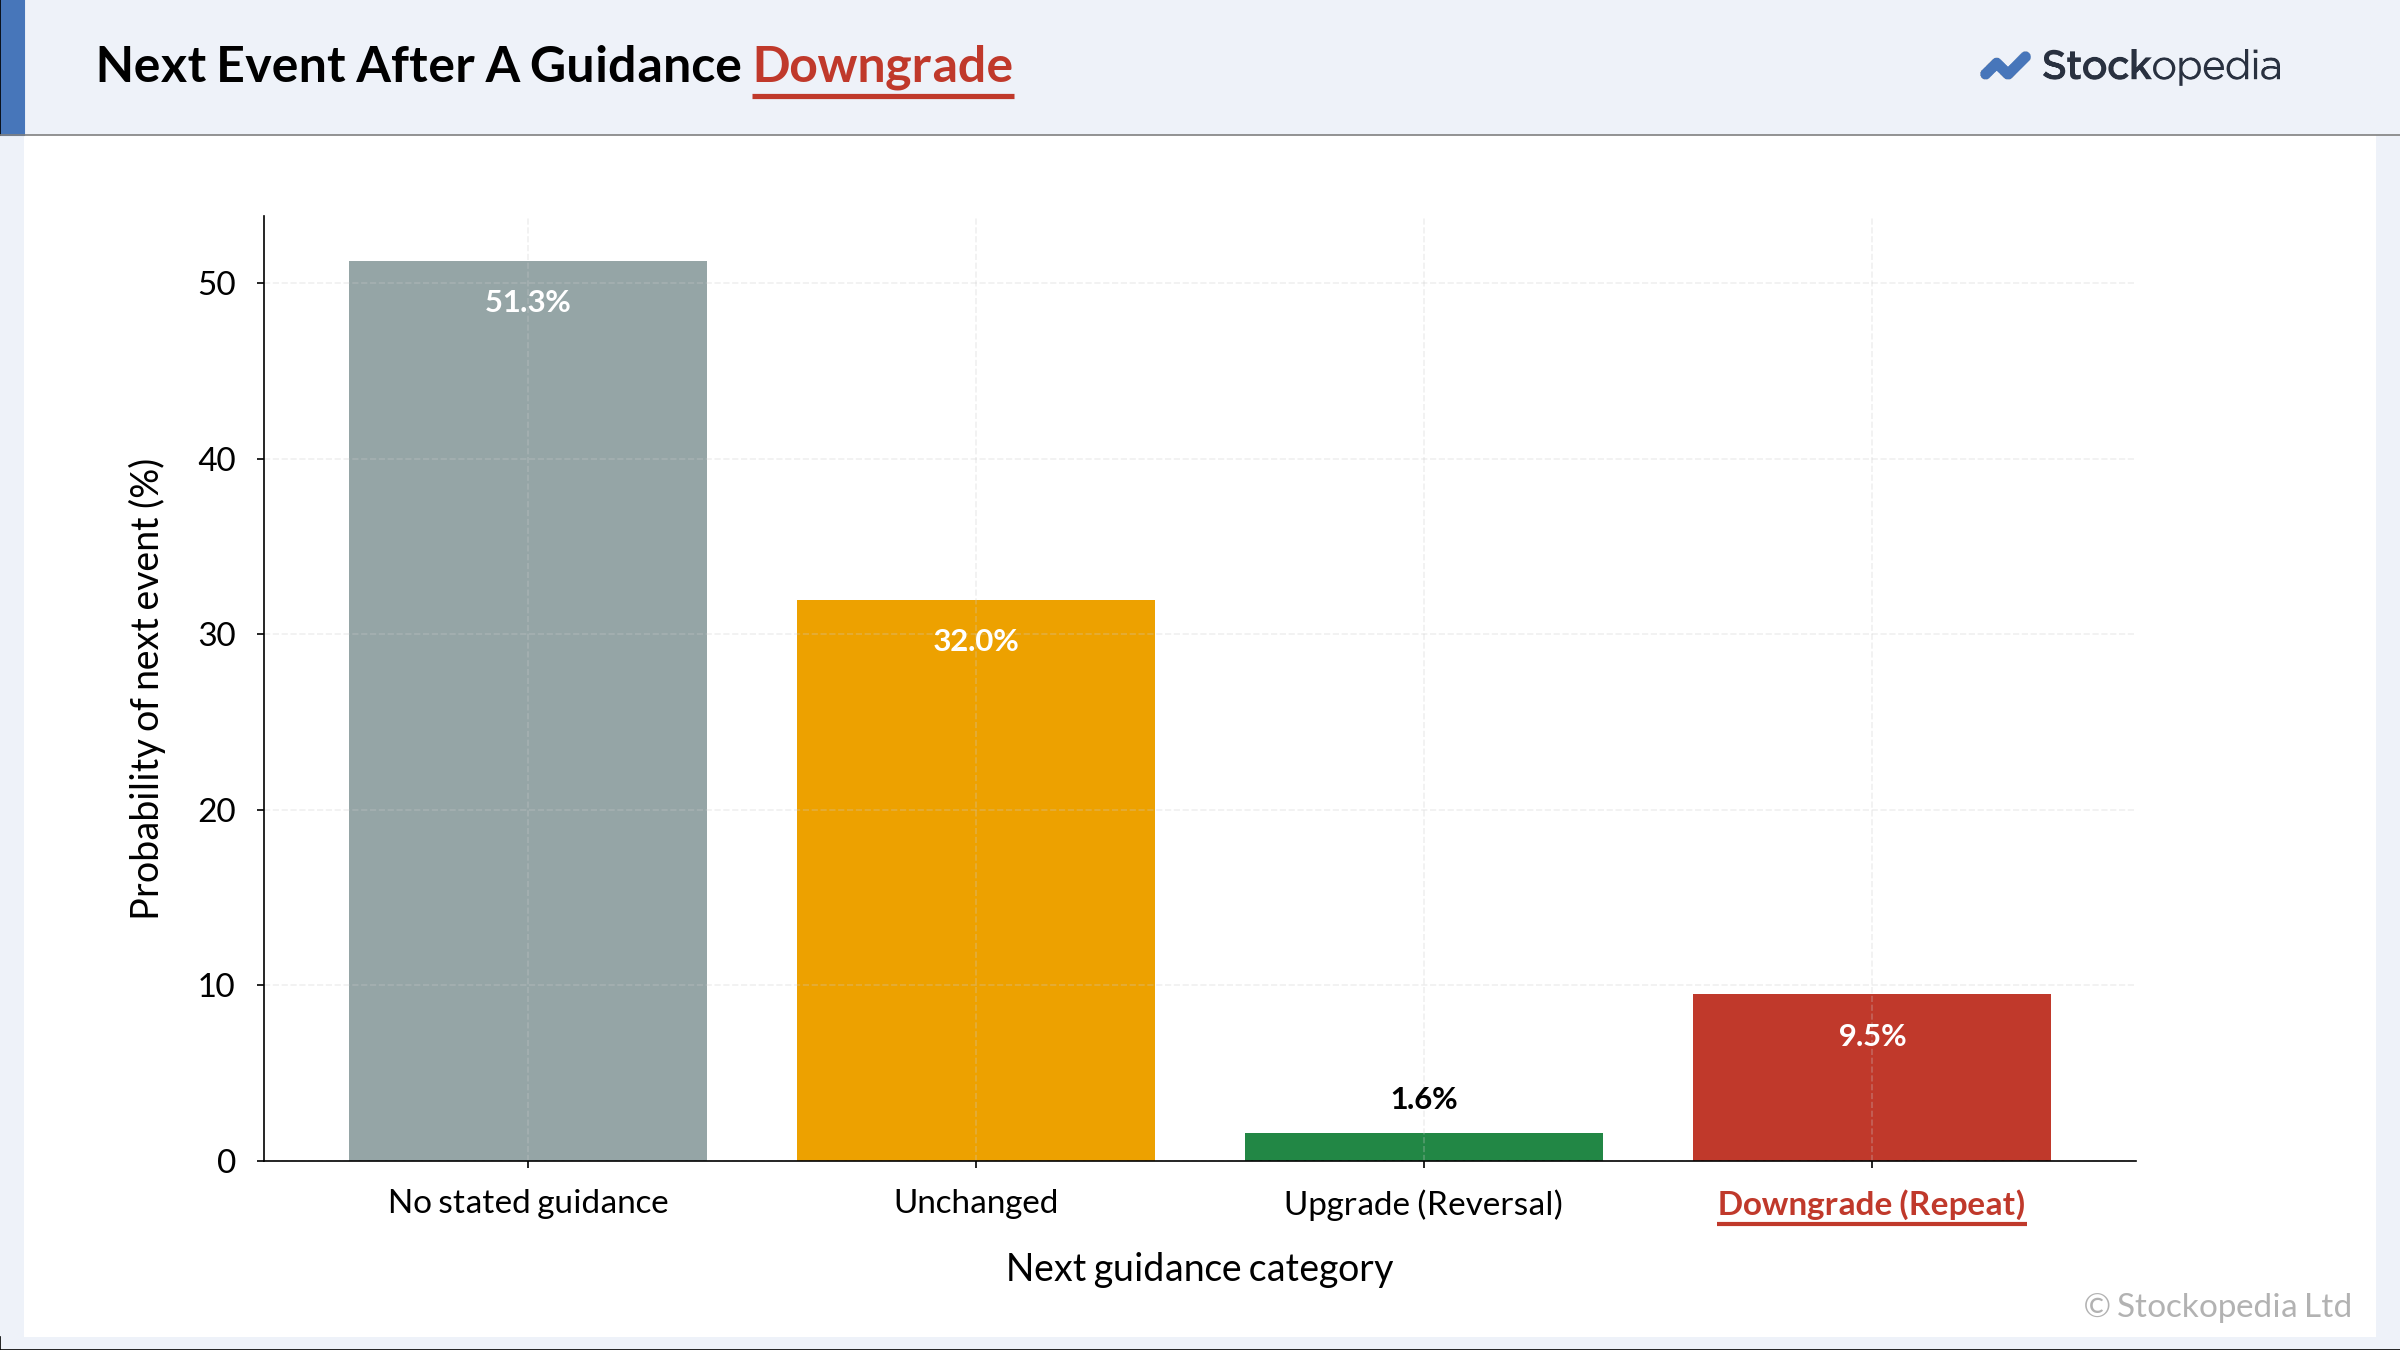
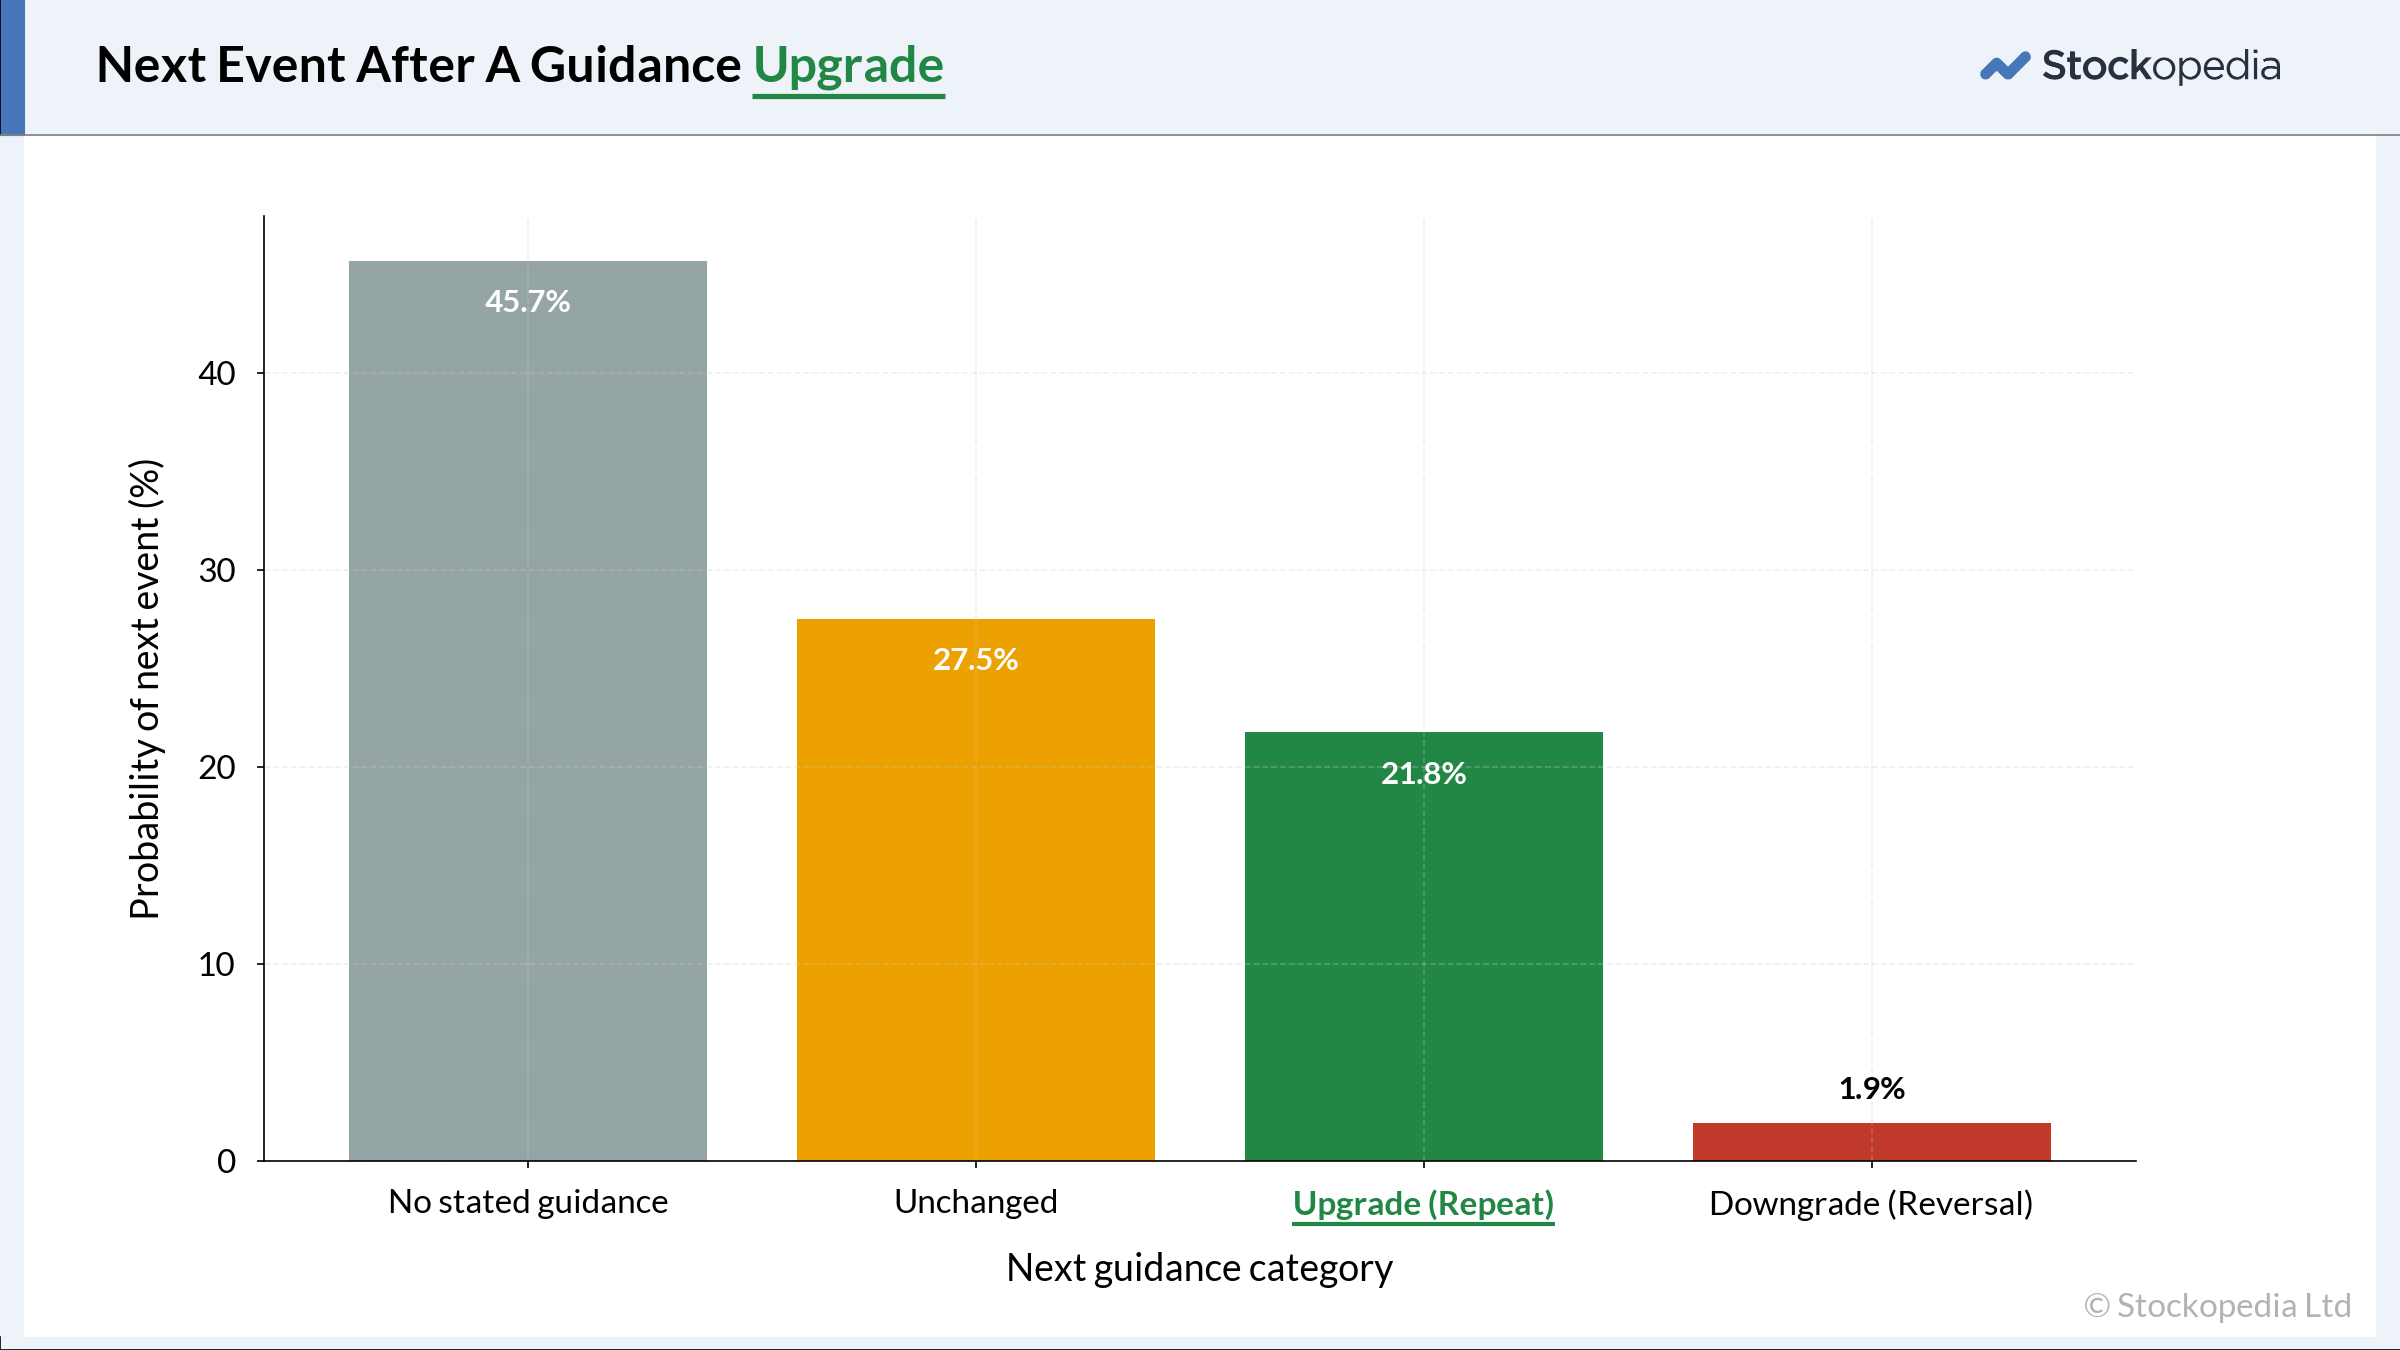
Only a small proportion of upgrades and downgrades were repeat events. For instance, just 9.5% of downgrades were followed by another downgrade. I say ‘only’ 9.5%, but a 9.5% chance of a 10% price drop is not trivial, particularly if the stock represents a large part of your portfolio.
Furthermore, change is often followed by consistency. If a company upgrades or downgrades its guidance, the next trading statement will usually provide no new guidance, or reiterate existing guidance. Investors looking for a change in tone could be disappointed. Just 1.6% of downgrades were followed by an upgrade, and 2% of upgrades were followed by a downgrade.
The typical profile
We can’t predict upgrades or downgrades outright, but clear profiles emerge when we look at stocks’ size, sector and StockRank. Upgrades skew toward mid and large-caps, while downgrades show no clear pattern.
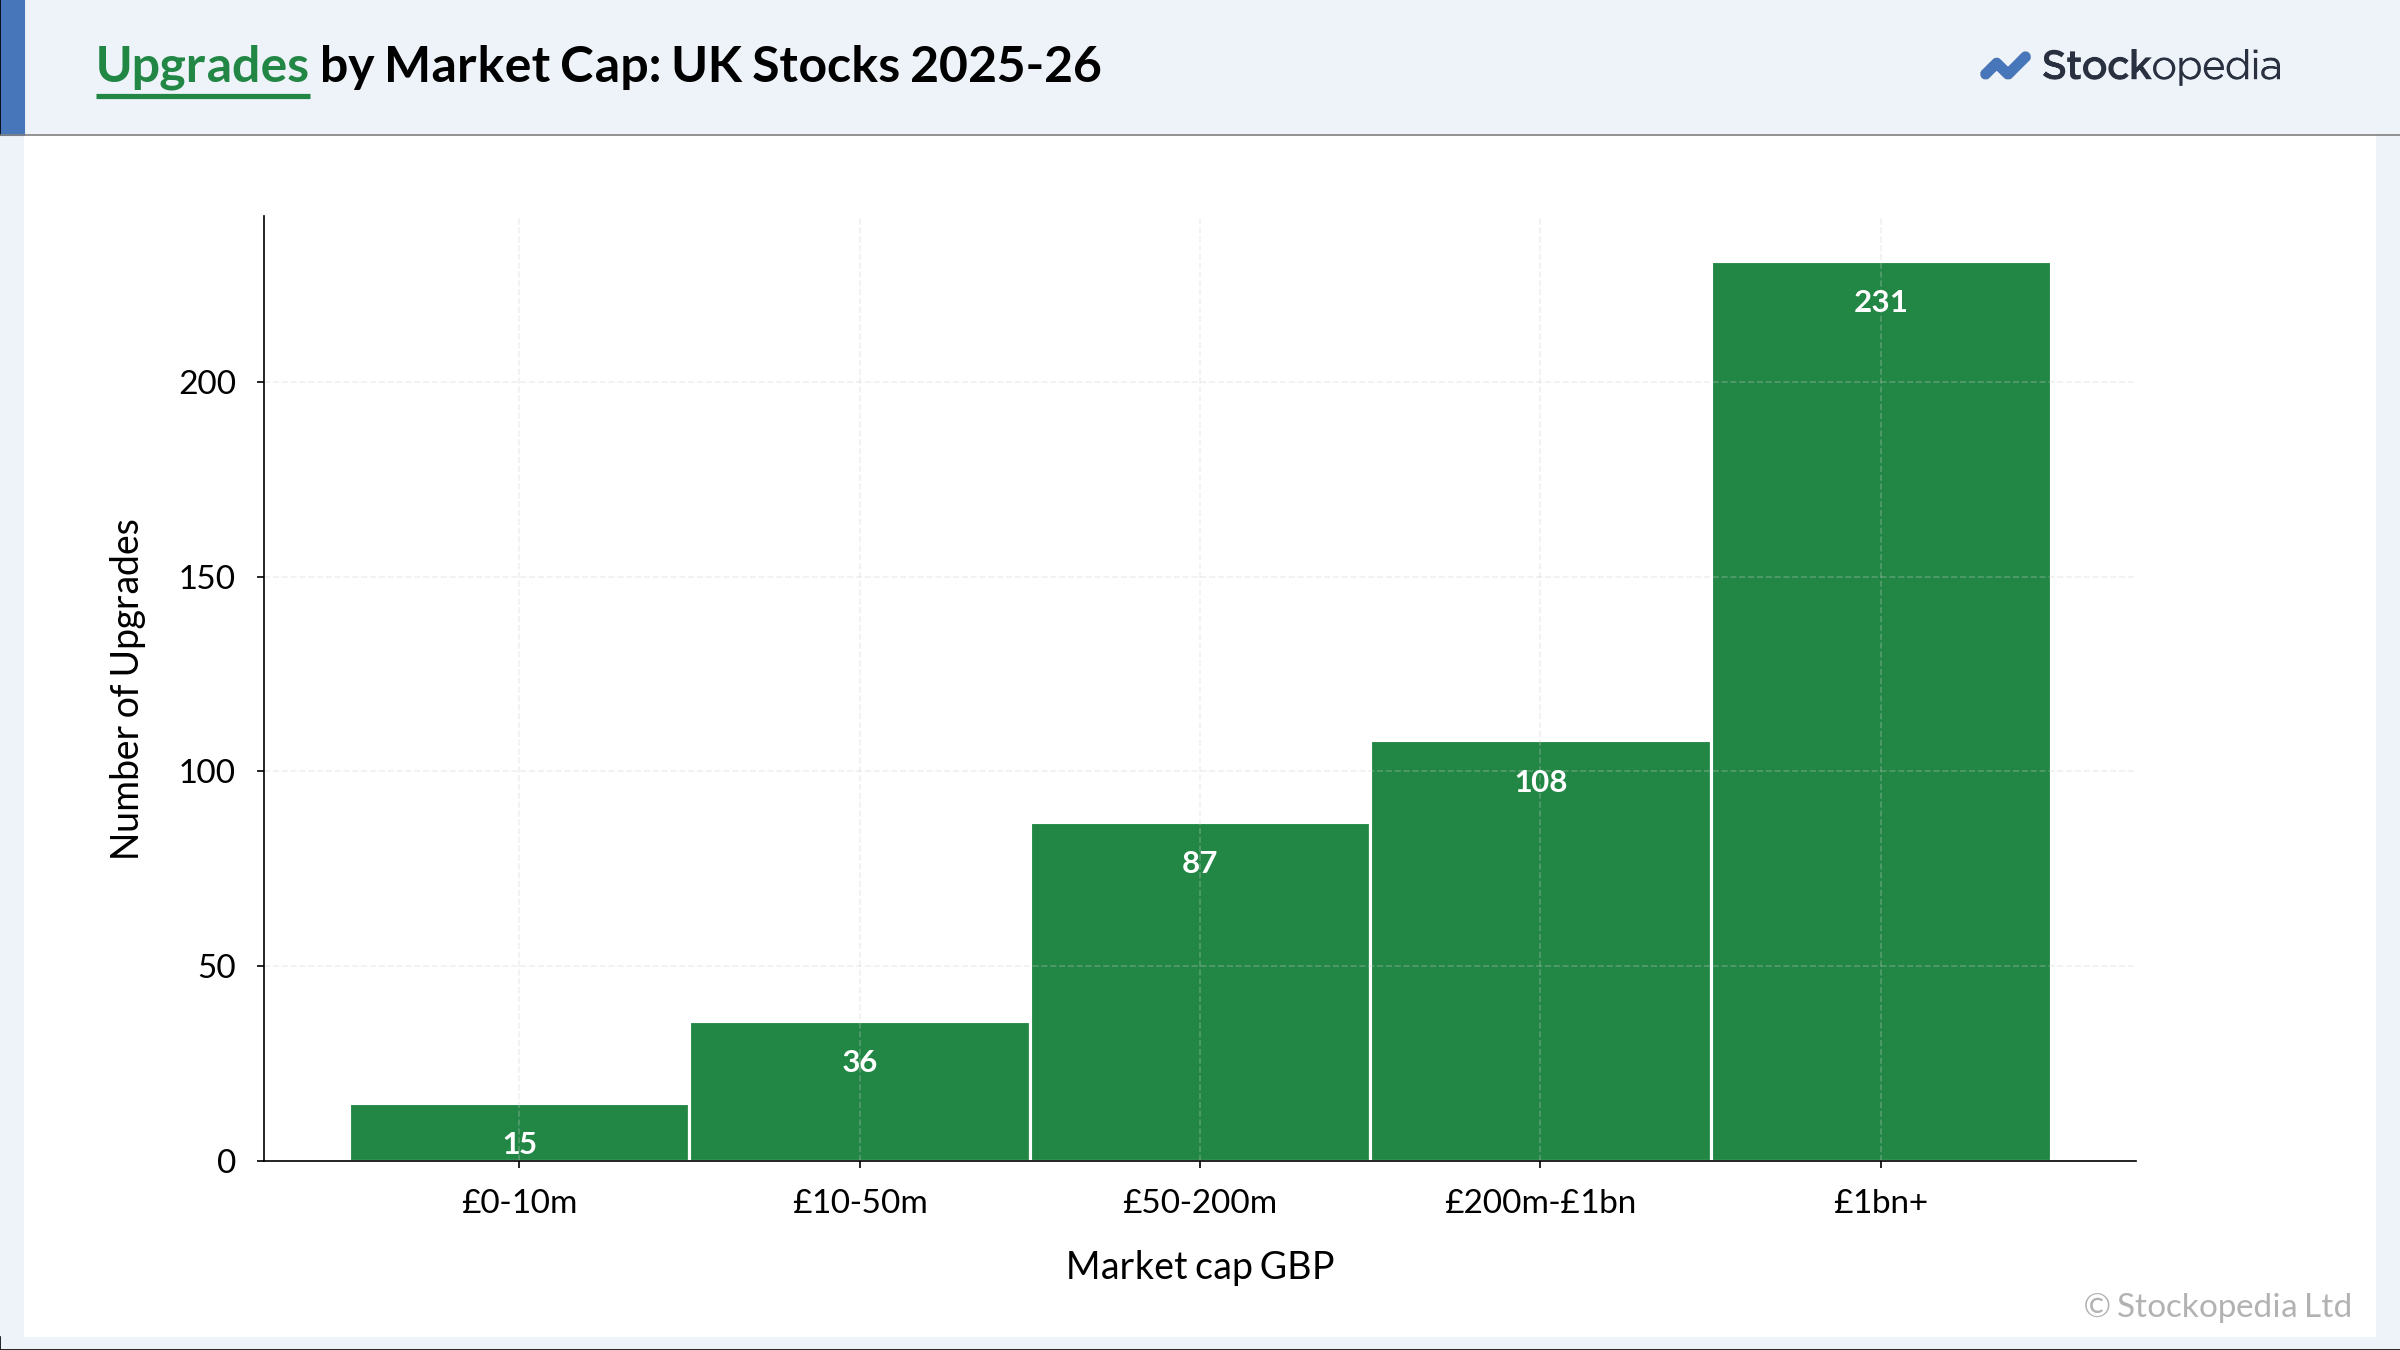
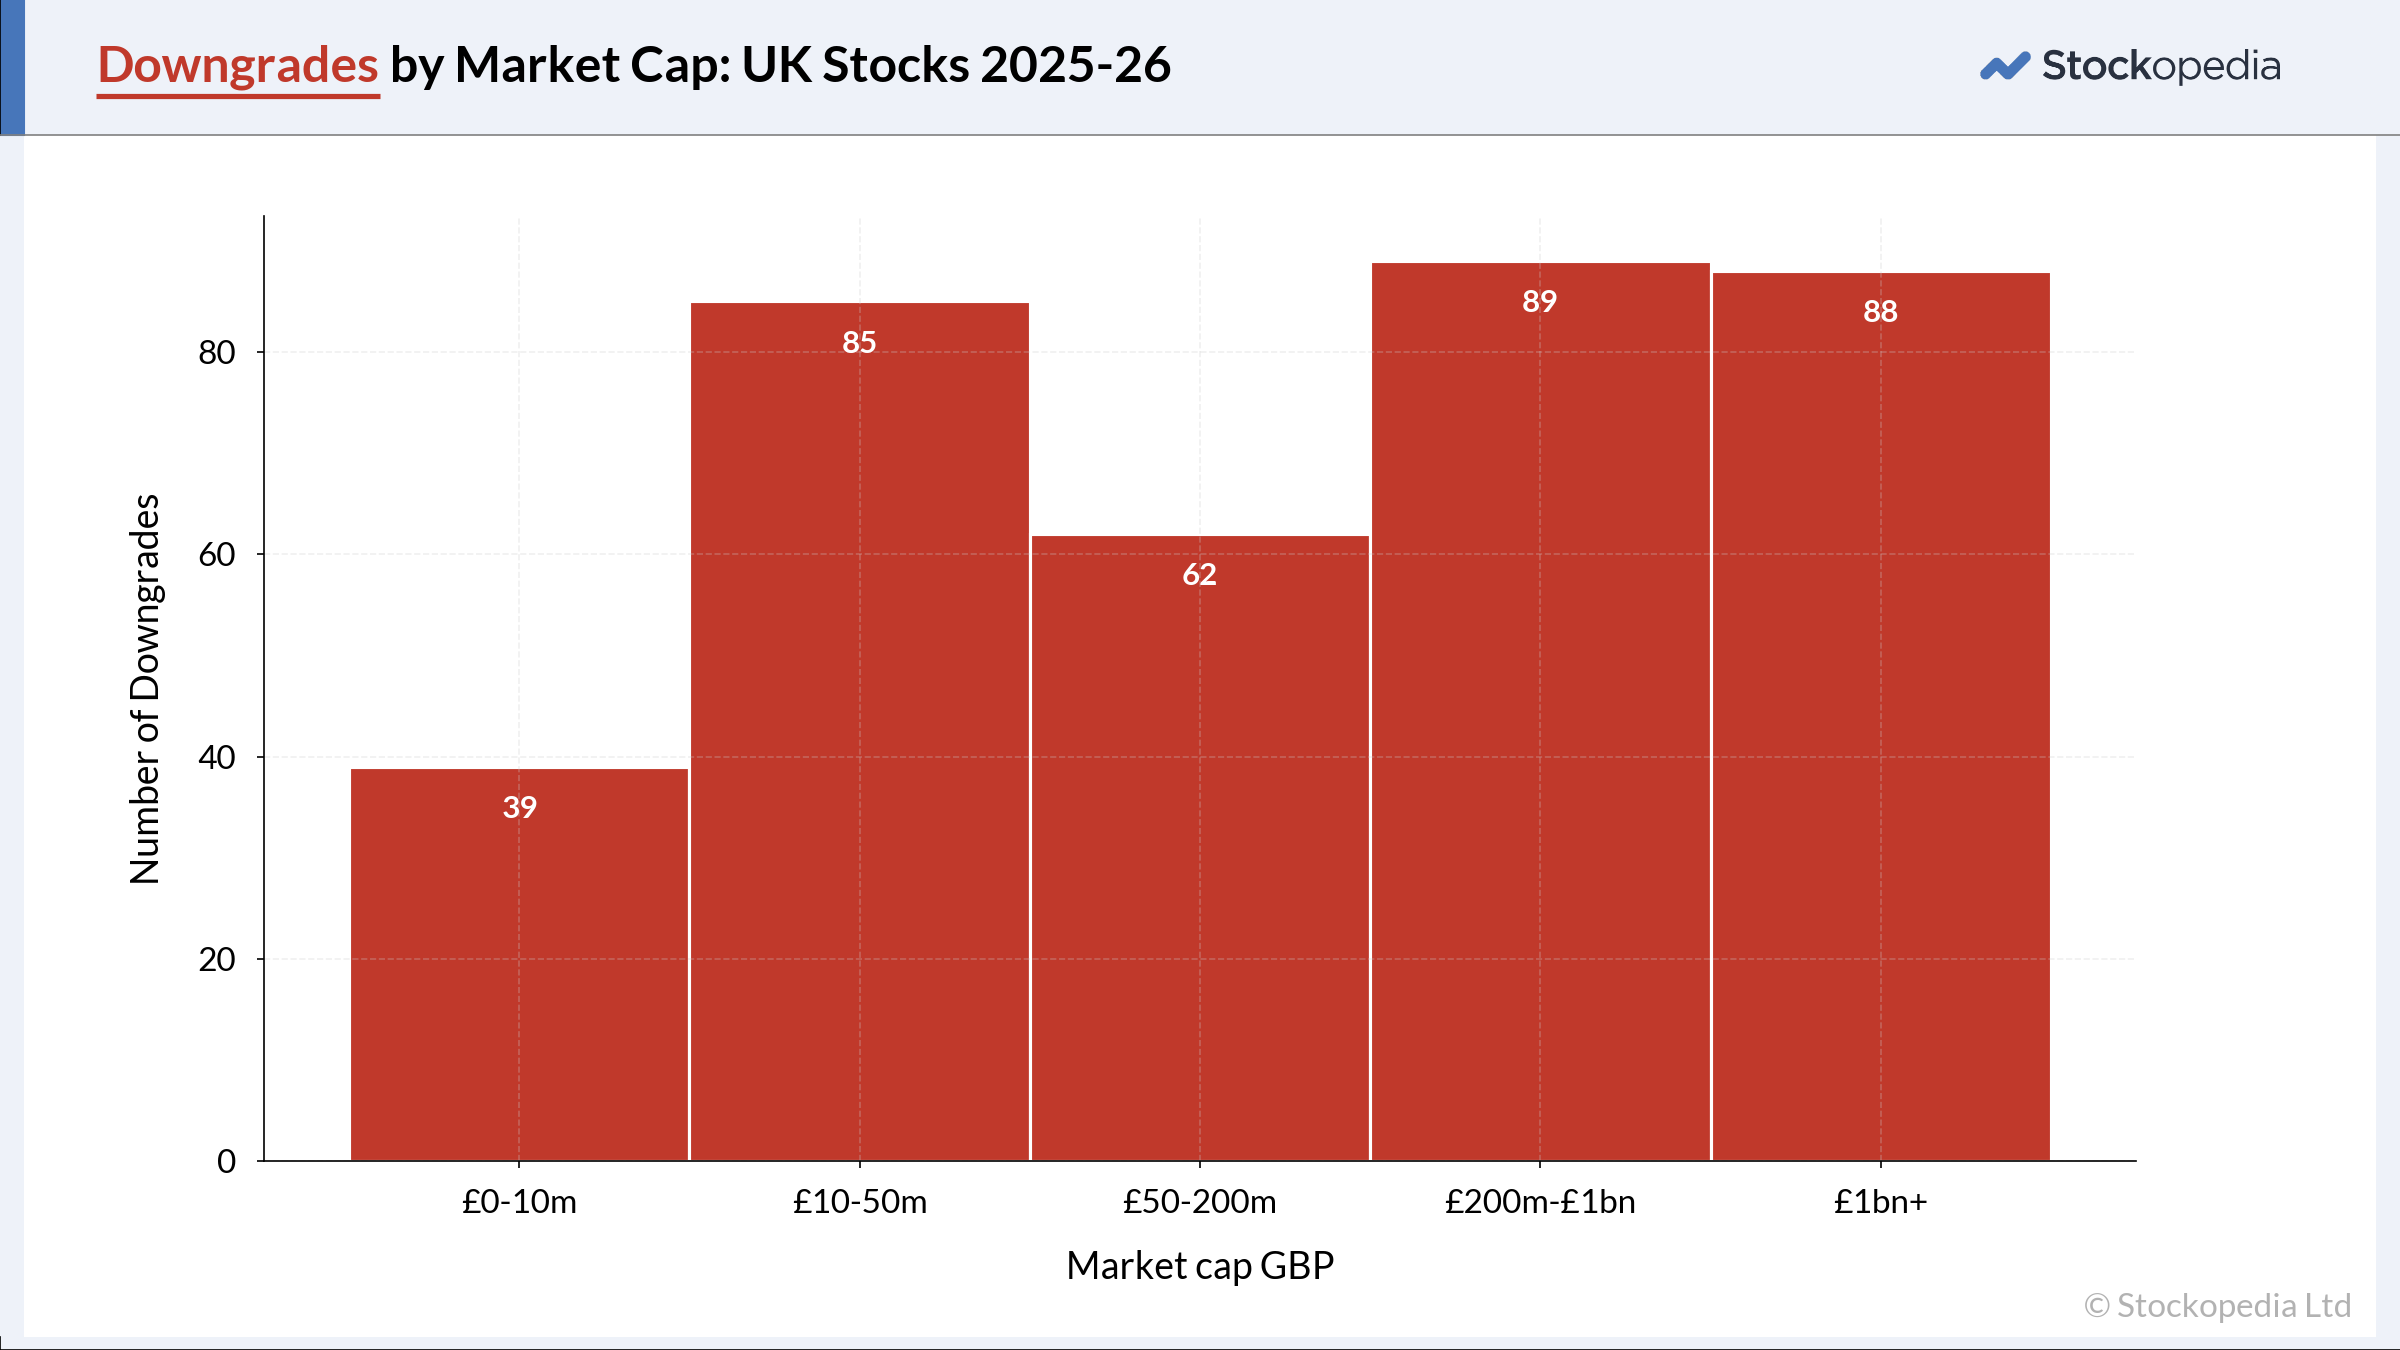
One theory is that larger caps are benefiting from a mild economic stabilisation. We looked at RNS from 2025-26. This period was calmer than the turmoil of 2020-22. We are still in a period of low growth and elevated risk, but perhaps the worst is behind us. Bigger companies may be first to benefit from a modest improvement, while smaller caps could catch up in a full recovery.
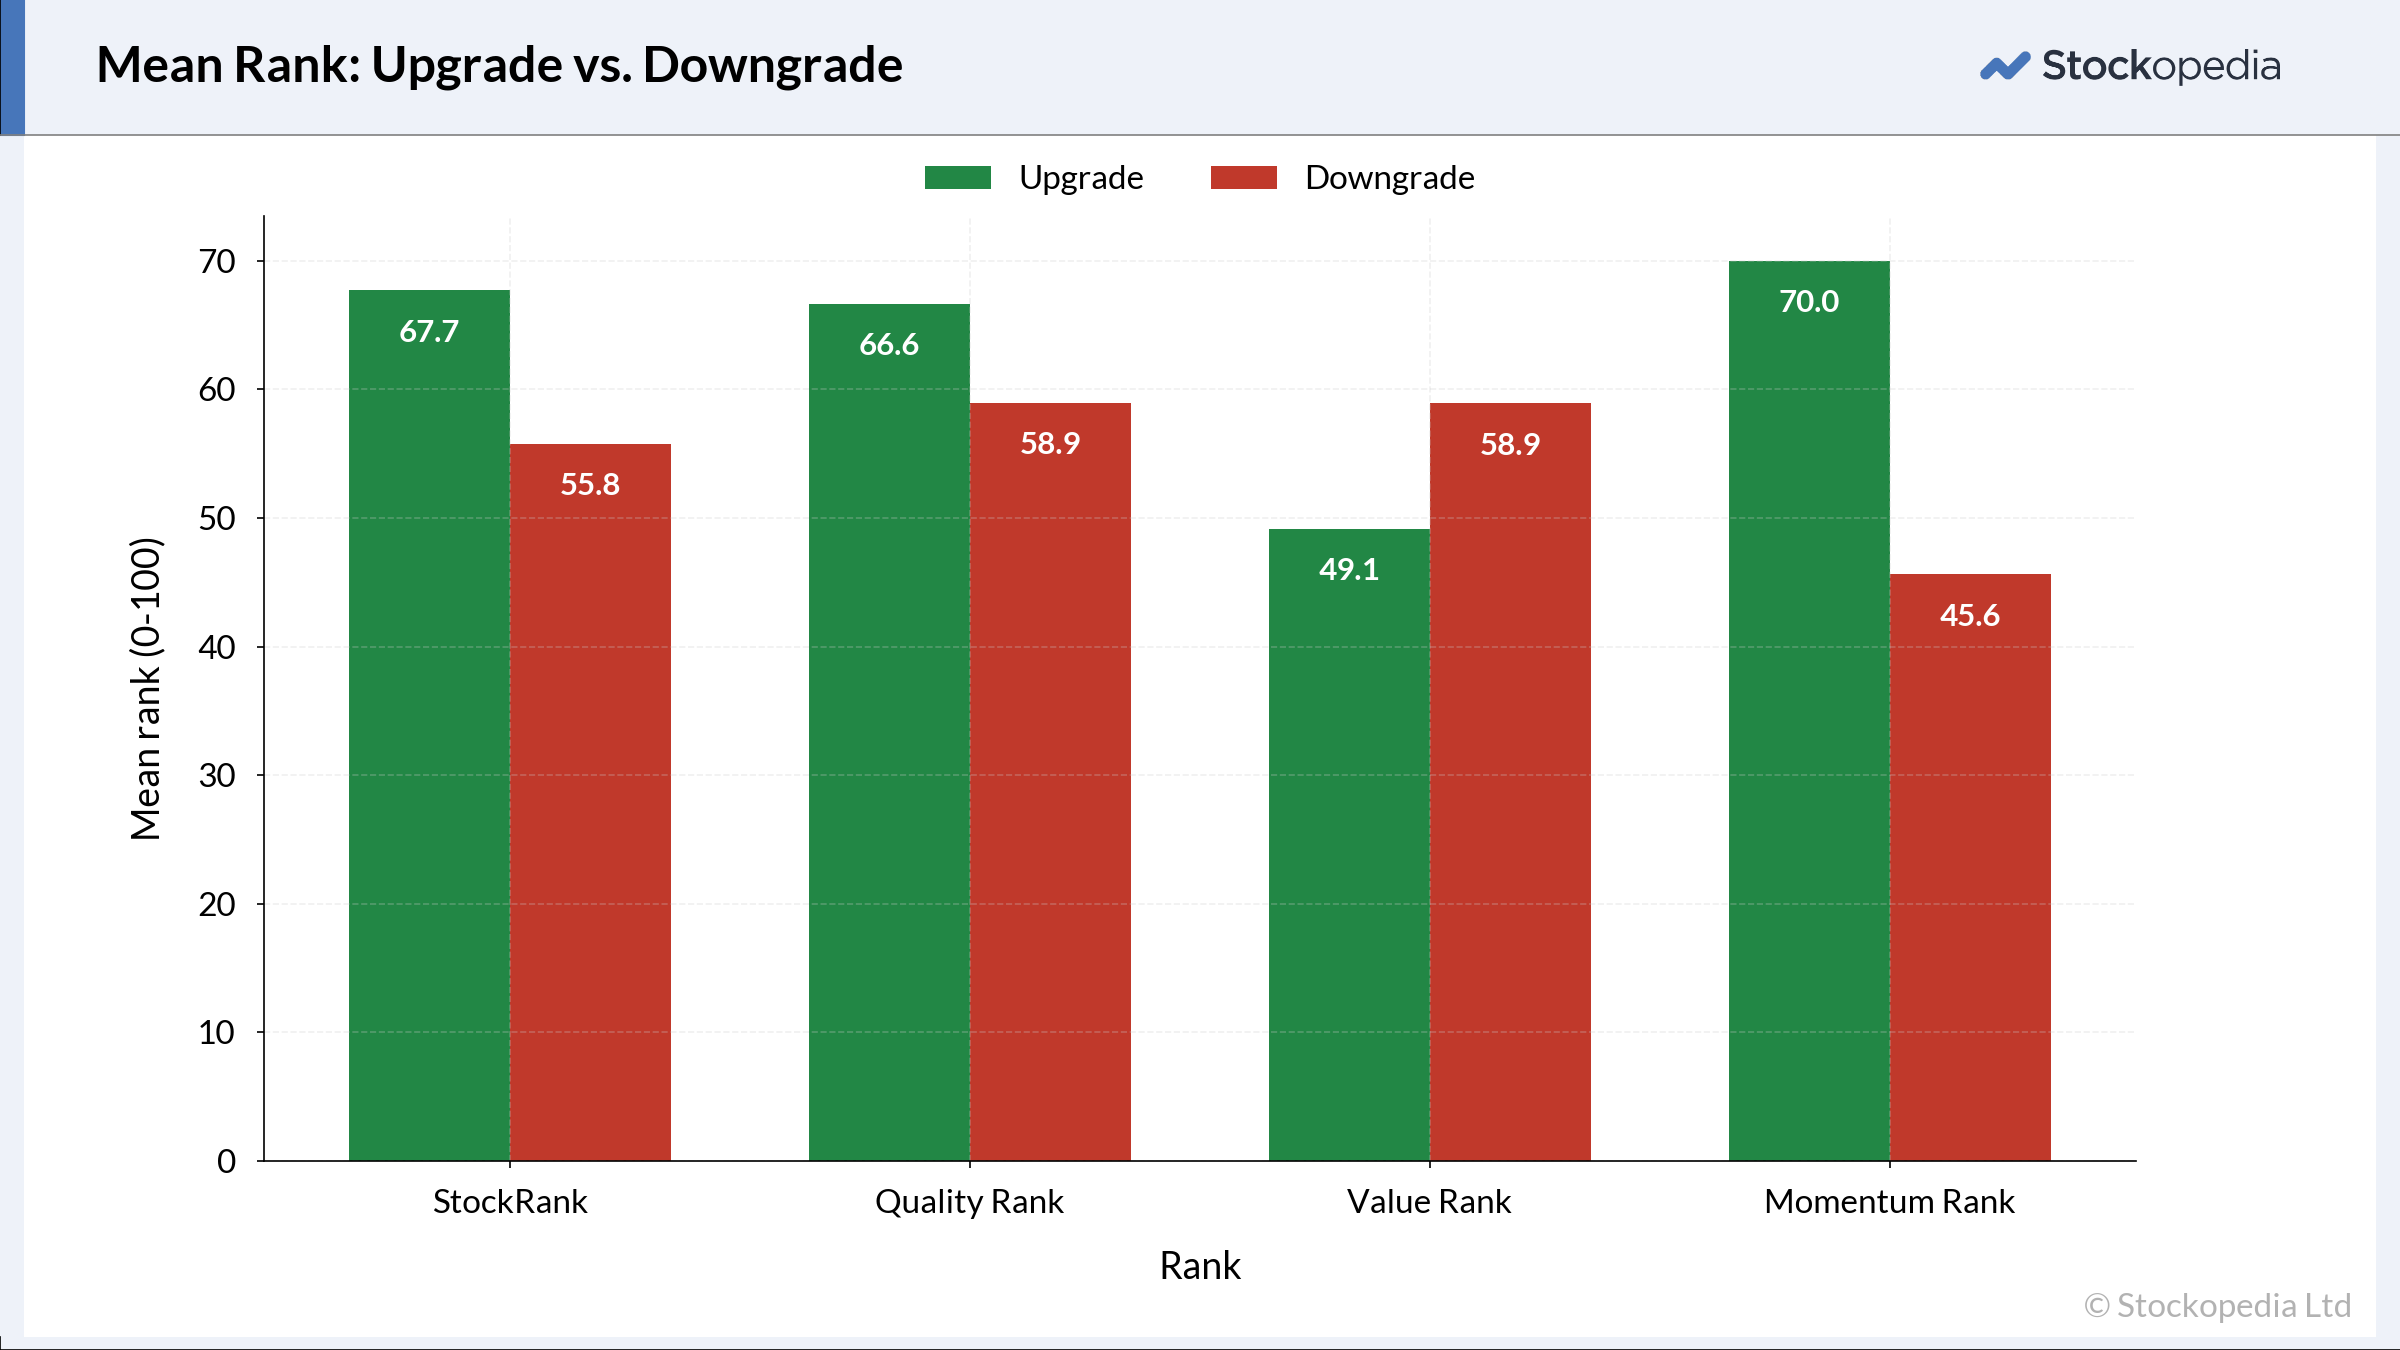
When we looked at the StockRank breakdown, it became clear that upgrades were associated with higher QualityRanks and higher MomentumRanks. These ranks would typically be higher when a company’s financial health is improving and/or brokers are becoming more optimistic about its future prospects. These trends likely occur around the same time as companies revise their guidance upwards.
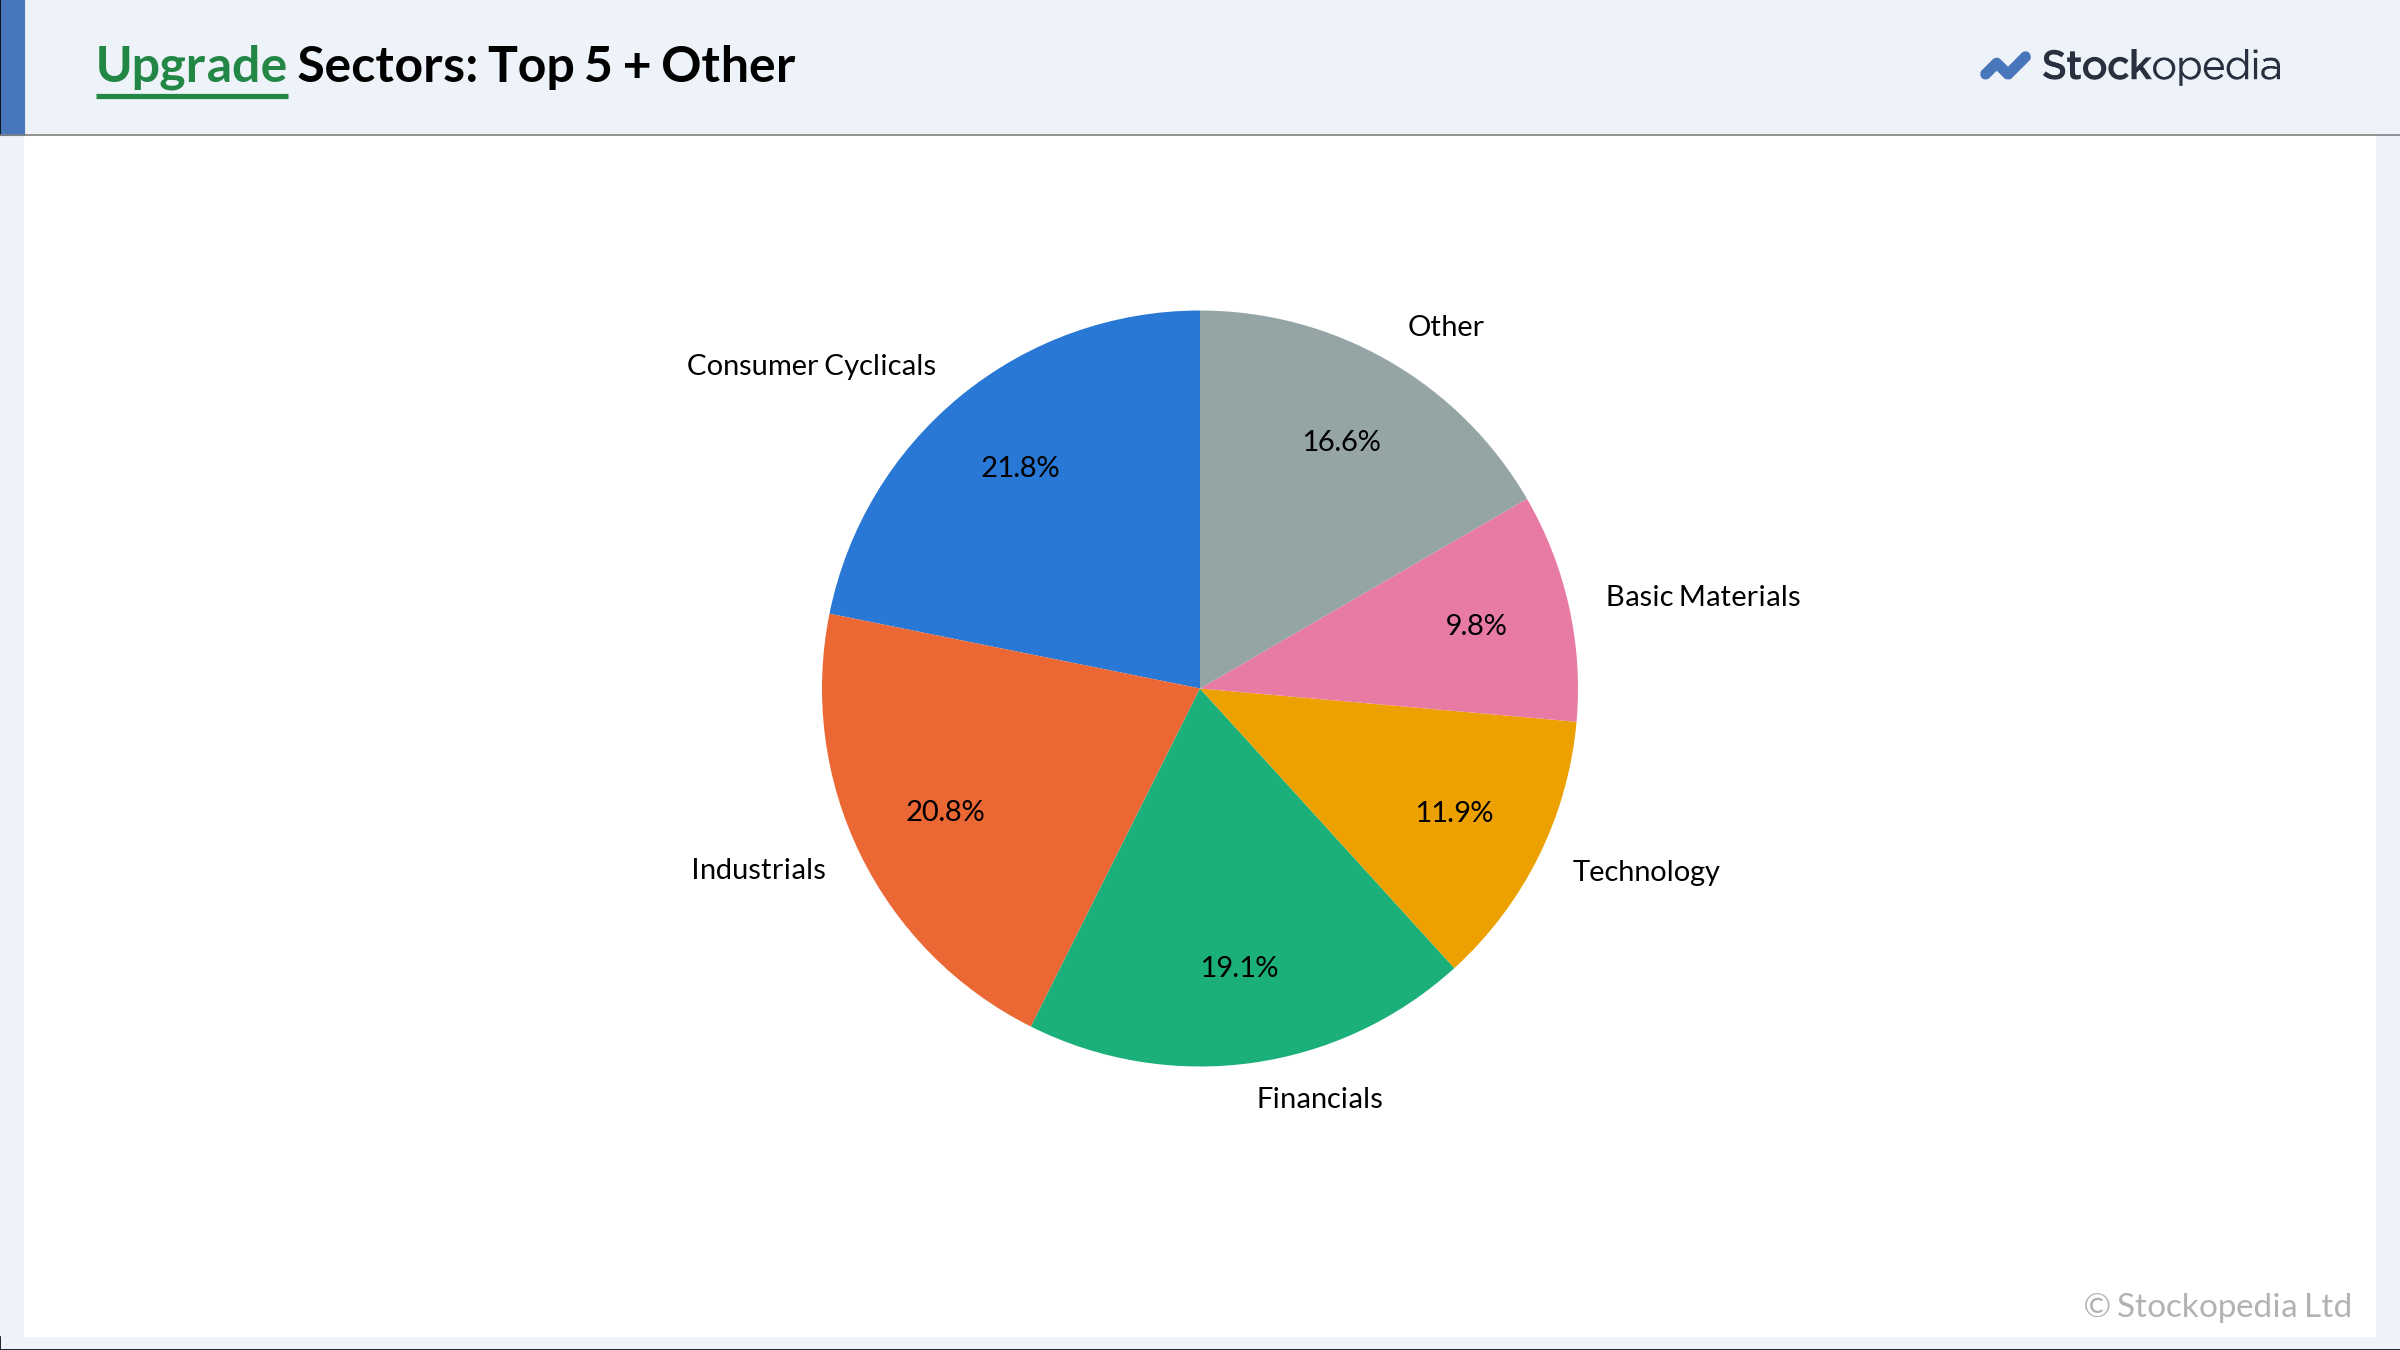
When we looked at the sector breakdown, we found that cyclical companies were overrepresented in the upgrade events. 21.8% of upgrades were made by cyclicals, even though they made up just 10.4% of the sample set. This is perhaps unsurprising, given that cyclicals are more sensitive to the economic cycle. Some cyclicals may upgrade their guidance as the macro backdrop shifts from high-turbulance (2020-22) to moderate-turbulance (2025-26).
The interesting thing is that cyclicals feature prominently among upgrades and downgrades. Downgrades were notably concentrated in the housebuilding and construction sectors, with the downgrade-tilt intensifying during the Iran war (Feb 2026). This quite possibly reflects rising borrowing and mortgage costs and/or various government reforms that have kicked in recently.
Key takeaways
Technology is constantly changing and the investment landscape changes alongside it. Thanks to the latest breakthroughs, we can turn relatively ‘messy’ language into actionable signals.
Guidance does matter: When companies raise or cut their expectations, the stock tends to spike up on good news, or fall off a cliff on bad news.
The drift may matter more than the spike. The initial spike can happen before investors react. Don’t forget the afterparty that happens after the announcement.
Don't assume an upgrade will immediately be followed by another upgrade. Guidance changes tend to be followed by consistency. A company that upgrades is more likely to reiterate its guidance than change at the next update.
AI can make this information usable at scale. An LLM can read thousands of RNS statements, identify changes in guidance and classify them as bullish, bearish or neutral. That turns semi-structured language into something that can be tested systematically. We plan to make these datapoints available to investors as we develop it further. Watch this space...
Disclaimer
This is not financial advice. Our content is intended to be used and must be used for information and education purposes only. Please read our disclaimer and terms and conditions to understand our obligations.
21 comments
Alex, I have an interest in applying the behavioural aspects of PEAD, so read your article again closely.
What struck me in the Upgrade/Downgrade market cap charts is that the skew is almost entirely one-directional. It's small-cap upgrades specifically that are missing, which makes me wonder whether the macro explanation is the whole story.
There's a duller one worth ruling out. A company heading for a miss is obliged to warn specifically, which produces a quantified, machine-readable statement. Good news carries no equivalent obligation, so it can arrive as 'an encouraging start to the year'. At the small cap end, with no investor relation department and half-yearly reporting, that is often exactly how it arrives.
It matters because the PEAD literature attributes greater drift to a underreaction to news in small, thinly-covered names rather than large ones. If small-cap good news is systematically the hardest thing for the LLM classifier to pin down, then the events its currently least able to capture may be the ones carrying the most drift.
There's US research (PEAD.txt, JFQA 2023) where the highest-impact positive words in their model turn out to be exactly the imprecise ones — "strong", "nice", "pleased", "improvement". Their best combined measure still uses the numbers, but the textual component is what generates the longer drift.
Yes, good points. Downgrades are reported by large and small caps, whereas small cap upgrades slip under the radar. Perhaps I can refine my macro thesis: larger caps are more likely to communicate an improving situation, so if the macro picture is helping companies recover, this should be more visible in large-cap RNS announcements. Indeed, in the largest groups, there is a tilt towards upgrades.
At the end of the day, if information isn't disclosed in the body of the RNS, the RNS is arguably less useful to everyone — both humans and LLMs. However, the signal may still be available elsewhere, for example in price movements. So we're back to plain-vanilla trend following and plain-vanilla momentum. There's nothing wrong with that, especially if you can identify a price catalyst, such as an RNS date. Perhaps the price is right, after all...
Before we give up on the small cap "upgrade" signal, the PEAD.txt paper suggests a different way of building it.
They never classify anything. They train the model on the abnormal price catalylst on the day and let it learn which language predicts a reaction, so good news, not upgrades gets defined by the market. You'd never have to decide whether 'an encouraging start to the year' counts as an upgrade. Every statement gets a score you could rank, instead of a label, and the vague ones score near zero rather than dropping out of the sample.
The appealing part is that you already hold both ingredients: thousands of RNS statements and the RNS price change on the day for each. That's the training set.
One refinement if you do try it. Subtract the index move on the day, so that a bad week in the market doesn't end up teaching the model incorrectly.
AI can make this information usable at scale. An LLM can read thousands of RNS statements, identify changes in guidance and classify them as bullish, bearish or neutral. That turns semi-structured language into something that can be tested systematically. We plan to make these datapoints available to investors as we develop it further. Watch this space.
Interesting and very likely will be a tool for a trading portfolio. I have 10% overall in short term trading, the rest is pretty static. I use Gemini and Claude AI but use at the moment to spot anomalies in share price movements v. dividend cover/cash flow.
The Herd instinct does kick in (Gemini AI summary but true):
Why Herd Instinct Hits Harder on the LSE
Unlike US markets where news drops at various points throughout the day or pre-market, UK listed companies release all price-sensitive announcements through the Regulatory News Service (RNS) at 7:00 AM sharp. Traders and algorithms have a strict 60-minute window before the market opens at 8:00 AM to process every headline. This creates a dense bottleneck where everyone forms a consensus on a stock simultaneously.
Between 7:50 AM and 8:00 AM, the LSE runs an opening auction where buy and sell orders are matched to set the opening price. If an RNS is a profit warning, thousands of automated sell orders stack up during this period. When the market uncrosses at 8:00 AM, the stock doesn't drift down slowly—it instantly gaps down 15% to 30% on the very first trade.
The herd effect is particularly severe on the AIM market (the LSE's growth sub-market) and mid-cap stocks. Smaller stocks have lower liquidity. When an RNS drops:
Institutional funds managing UK equity portfolios often hold strict risk management rules. If a UK stock breaches a critical technical level (e.g., dropping past a 200-day moving average), institutional algorithms automatically trigger block sell orders, compounding the initial panic.
A Classic LSE Herd Example
Alex said, "Your question actually touches on another interesting topic: how to practically implement event-based trading systems."
Solving this would bring together the jump analysis, ahead of expectations and now these guidance signals into something potentially useful. The expected return from these signals is quite small so they risk being eaten by trading costs if run as a standalone system but if used to complement an existing system, the implementation cost could be close to zero for the private investor. I would look at using this signal (perhaps a composite of jumps, expectations and guidance) to add a sort order to the opportunity list already under consideration.
Some examples of my thoughts that seem worth exploring:
Alex, is this the sort of thing you had in mind when posing this question?
Great question — we're getting into the weeds now!
The elephant in the room is trading costs, primarily broker commission fees. In my personal trading, I eliminate these with a low/zero-cost broker, namely Trading 212, although there are other options (e.g. IG Group). The other key factors are the bid-ask spread and execution time. So the key question is: can a PEAD strategy work only when trading a highly liquid segment of the market, such as the FTSE 100?
My initial findings are promising. The anomaly appears to exist even among FTSE 100 stocks. Why? Possibly because people hold FTSE 100 stocks for all sorts of reasons. Not everyone is following a PEAD strategy, so there isn't necessarily mass arbitrage going on.
The next question, then, is how to construct a basket of stocks. I'm exploring a sort of rolling-rebalance approach, whereby I hold any RNS gap-up stock for, say, 60 days and rebalance whenever another FTSE 100 company gaps up on an RNS announcement.
For example, on day 1, I might hold stocks A, B, C and D at 25% each. Then, on day 4, stock E gaps up following an RNS announcement, so I rebalance the portfolio to hold A, B, C, D and E at 20% each. Eventually, the 60 day window for, say, stock A will pass, and so we rebalance again, etc. This approach is still WIP at my end and involves quite a few bells and whistles, but I'm happy to provide an update at a later date.
In the above example, the 'trigger' is a 5% gap-on on the RNS announcement, but it could be any other trading signal, e.g. director buying, or the guidance signals mentioned above.
The other option you touch on is using PEAD in conjunction with other factors. This is absolutely possible, and all of the options you mentioned above could be workable.
Good stuff. For future articles on this subject I'd like to see the average earnings drift in different 6 month periods. Could it be that the effect was stronger during a specific period in the past?
Thanks for another excellent article. The downside to which is that it triggers a lot of thoughts and additional questions (sorry).
You mention 2025-26 as the source of the data, was that 12 months (just looking at how many upgrades you were seeing per month)?
I've mentioned this elsewhere, but I personally give more weight to upgrades that are made earlier in the company's financial year. They must be pretty confident to upgrade if they still have a lot of time before year end (someone else mentioned the trading update from CMC Markets (LON:CMCX) in July, which is a good example). I wonder whether this is something that you could look at in the data?
As you mention in the comments, turning this into an event-based trading system may take more work, but you have certainly identified a good place to go fishing.
The second chart.... the "guidance drift" when there is an upgrade.
What's the percentage from Day 1 (so the opening price on the day after the upgraded guidance) to day 40?
As you say - its really hard to get the opening price at 8am when there's a guidance upgrade as a private investor. So typically would be only able to buy later in the day or the next day.
Hi,
Good question!
The drift per se is actually quite small, typically less than 5%, but over a 40-day period, that is not trivial... especially if investors develop a strategy to take the gains from one 40-day period and reinvest them into the next PEAD drift.
Your question actually touches on another interesting topic: how to practically implement event-based trading systems. A periodic rebalance may not work particularly well. Furthermore, these strategies often depend on squeezing out an aggregate gain from a large number of shares... while keeping trading costs under control.
This is something I’m looking into. If you have any ideas, I’m all ears.
Alex
Great article and my attention will be, "on this space", as you suggest, my recent experience has verified all you have set out in the stages of drift, jump and continuation after rising, but with an occasional small fall just for a day or two after a particularly large rise, which I have put down to existing holders taking what they see as an unexpected profit by selling at the freshly elevated price.
Hi - Yes, I think there is a well documented trend whereby the price jumps up on the open -i.e. open vs prior close- but then the open to the next close is actually tilted negative. This does not 'cancel out' the opening gap-up, but it does mean that the price can drift down from, say, mid-morning to the close.
After all that, you then get a post-earnings announcement drift.
I'm sure there is scope for a "within day" strategy in this space, trading stocks on the day of the announcement. It's potentially risky though, because it entails shorting stocks that have just spiked up. (No free lunch, as they say).
Are you able to share the llm prompts, if not in detail perhaps in outline?
"building an LLM pipeline which read thousands of RNS statements and classified each update as a guidance upgrade, downgrade, or unchanged".
I assume that like Ed's Jump findings the extent of the company guidence "upgrade" has a bearing on subsequent Jump% and Drift%? Is more data available please?
Excellent report.
A few points:
There was an article last year by Ed on announcements but i cant see how to search the discussion section to get the link!
How does this tie up with Eds previous piece on 'ahead of expectations' updates and downgrades. He indicated that that they're followed by repeated statements whereas you're indicating it's only 10% that repeat. Have I misunderstood something.
Hi Andy,
Thanks for the question.
I presume you are referring to this article/chart (LINK HERE).
The article does a deep dive into one stock, Yü Group, and explains the repeat events within the context of that one case study. However, when he takes a step back and looks at the bigger picture, he observes a similar trend to me - i.e. aheads are more frequently followed by unclassified or inline, and aheads seldom revert to below.
Best,
Alex
How did you classify statements from a company who state for example trading is in line with recently upgraded expectations. Sometimes those upgraded expectations were only 4-6 weeks ago, which is often the difference between a trading statement and a prelim/interim report. Did you classify this as in line. Or as there wasnt really enough time between the trade statement and the actual earnings, should you ignore the in line? In addition some companies may say they are ahead of expectations for FY26 results, but in line or even downgrade 27 expectations. I assume 27 is more important but how have you accounted for this?
Volex was a classic example of this in both January and March. Also in late January it tested near the lows of the beat expectations day.
Thanks for this. I`m glad I`m not the only person studying this. My observations are that 50% of shares who beat expectations (with a high stock rank) make their intra day high within 5 minutes of their opening. If the share breaks the 5 minute high, there may be an edge as the occasional few like CMC Markets (1st July), S4 Capital (5th August) keep on rising all day. I guess the opening day price rise (after 5 minutes) only really happens when the raised guidance is a genuine surprise, and that most of the time market makers have factored in the immediate jump as a result of beating expectations. Secondly though you quote there is a drift up in price (on average) over the next few weeks/months, this may be distorted by the shares which rise day after day after surprising the market. I have found 80% of shares retest either the low of the day they beat expectations, test the gap to the previous days close, or close the gap and immediately reclaim it. Thus it may be worthwhile creating a watchlist of shares with high stock ranks, who have beaten expectations in their last trading update and then wait to enter when price comes back to these points around the gap I`ve identified.
Great read
Thank you