BooHoo - a Journey Through the StockRanks

I saw some fantastic comments on the site by Nick Ray (one of our community members) recently that got me thinking. He created some great 3D visualisations of StockRank data through time which allowed you to see how some shares had evolved within our StockRank Styles framework. For those of you who didn’t see it, you can see Nick’s comments on this blog about Snoozebox Holdings (LON:ZZZ) by our editor Ben Hobson.
After seeing those posts, I decided to try my hand at something similar although there are a few key differences. I have the (perhaps unfair) advantage of full database access here at Stockopedia so I thought it best to take advantage of this by looking in depth at a single stock’s progression through the StockRanks over time. I was hoping to catch a glimpse of a stock’s story through its StockRank history and I’ve been fairly pleased with the outcome.
What stock to choose for my first trial run? I tried a few but ultimately settled on BooHoo for a couple of reasons. Firstly it’s quite popular on this board (no doubt in part due to our own Paul Scott’s discussions about it) and secondly it’s had quite a journey through the StockRanks over the last couple of years. This makes for a great story and, critically, a great chart so let's take a look.
Background info…First up, I just thought I’d explain my plots briefly so that readers would be able to interpret them better. The plots are over 3 axes with each point on the line represented by the stock’s QualityRank, ValueRank and MomentumRank. These three data points go together to make the x, y and z values for a given point in time.
The charts start in early 2014 as this is the first date from which we have consistent (ie daily) archives for the StockRank. I have also annotated every 50th data point with the date in order to allow you to see more easily what the progress was through time. The first data point also has a date and is coloured in blue to make it visible.
Another point to bear in mind is the colour of the line itself. It took a little bit of fiddling but I was able to colour the line itself depending on the overall StockRank at that moment. This means that not only can we see the progression of the relationships in the individual ranks, but also of the overall StockRank itself.
Do note that while I have used a similar colour scheme to the real StockRanks, I’ve stretched it out a bit to make the visualisation a little clearer. The line fades from a deep red to orange to grey over the course of StockRanks 0 to ~40, and then will turn a light green/yellow and progress towards dark green from ~60 onwards. This is in contrast with the real StockRanks which are all grey between 20 and 80.
Well, without further ado...here’s a gif of the finished product:
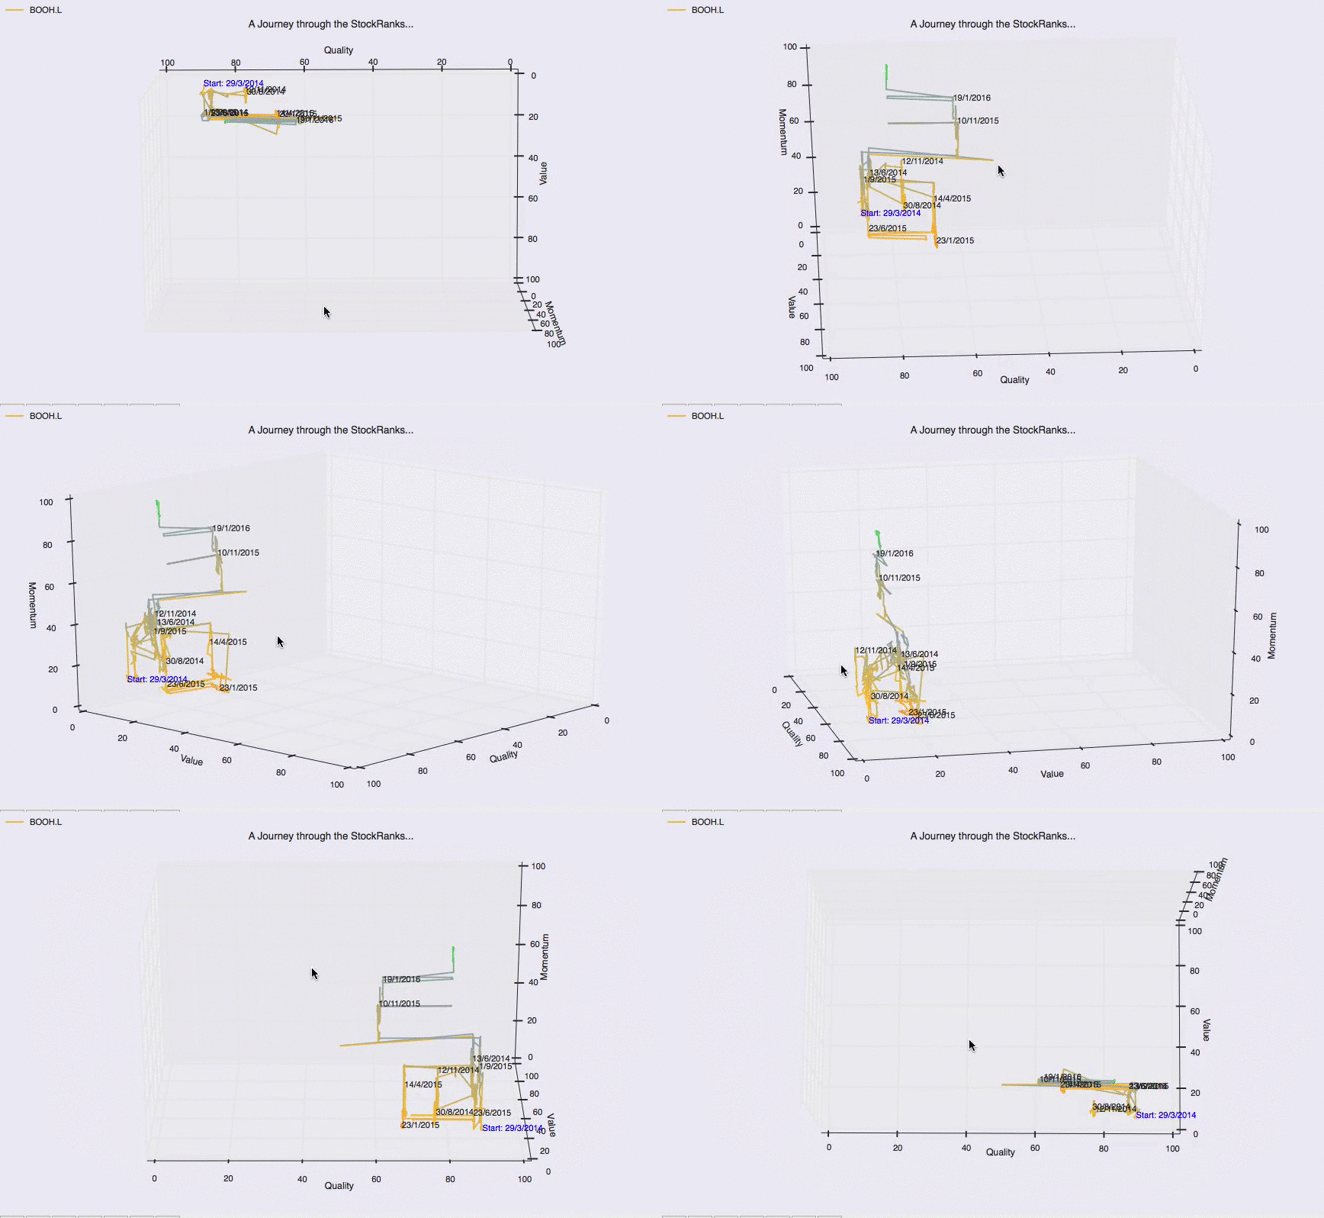
Unfortunately image size limitations make the animation a little small but I’ve followed up with some larger static images and some light analysis to help with that. The most coherent way to see the story unfold was to pivot the chart and look at each of the three factor pairs in succession.
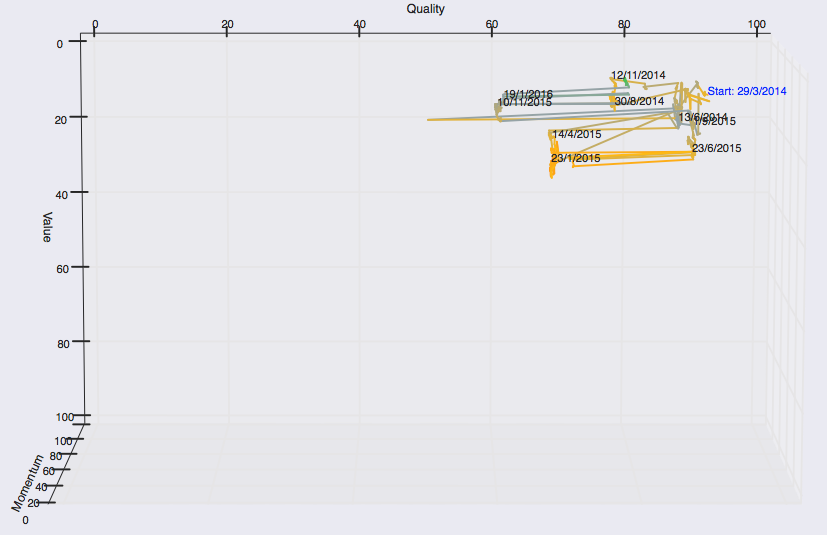
We can see quite a consistent relationship here - the firm has enjoyed a consistently high QualityRank though there has been a fair bit of oscillation. The QualityRank of a company is quite often characterised by this - steady scores and then sharp movements left and right as results day comes. They do move a little in between as the results are relative and so can be affected by other companies announcing.
Quality vs Momentum...
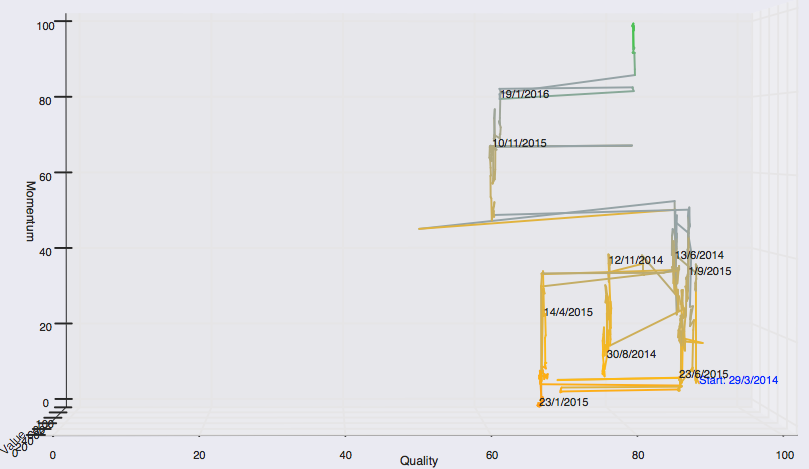
The story is a little different here. We get another view of the quality dimension and can see some of the bigger moves that have taken place. We now also begin to get a look at the momentum side of things. Starting off with a poor score post IPO, we see moderate improvement before a drop following the fall in price near the start of 2015. Since then we see the steady rise up to the MomentumRank of 99 we see now.
Value vs Momentum...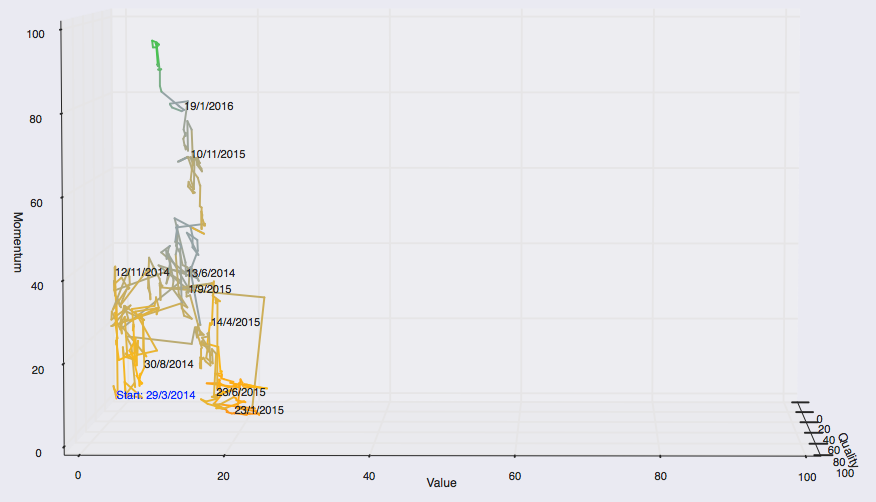
This is my favourite of the 3 chart views. We can see very nicely the improvement in momentum from the start date, and then the fall in momentum and rise in value following the early 2015 sell off. From there, we see clearly the inexorable march towards the current MomentumRank of 99. All along though we see the steady decline in value along with it - illustrating the trade off between the two beautifully.
As mentioned, the colour of the line is dictated by the StockRank itself. We can see BooHoo’s progress quite nicely here and this is best illustrated on the Value vs Momentum chart view. From the start date in early 2014 we see a light orange suggesting a StockRank in the 30s or so and this slowly progresses towards grey over the year. This then falls quickly towards a deeper orange than ever, suggesting a rank around the high teens in early 2015. This then steadily recovers though for the rest of the year and into 2016, with a tint of green showing for the first time near the top…is the best yet to come?
So where does BooHoo fit into our taxonomy of stock market winners then? The high quality and momentum scores, combined with a poor value score, means that BooHoo is classified as a High Flyer. These kinds of expensive stocks with strong momentum have historically performed well but, of course, readers are reminded to do their own research.
Please leave any comments or questions below and I’ll get back to you.
The article is for research purposes only and does not constitute investment advice. As disclosure, I own a small number of shares in BooHoo.
Disclaimer
This is not financial advice. Our content is intended to be used and must be used for information and education purposes only. Please read our disclaimer and terms and conditions to understand our obligations.
8 comments
Hi Tom,
Fascinating analysis. I love playing around with 3D graphs as a means of interpreting data. With a choice of three dimensions to play with I would prefer to select time as one and then look at the interplay of pairs of Q, V or M. So whilst you don't get the full QVM inter-relationships captured on one (very complicated) graph you can tease out the dynamics of QV, QM, VM over time more clearly.
Cheers Maddox
Tom
An excellent posting, thanks for the insights.
Regards
Howard
Hi Nick,
Great analysis of the charts and I agree with your conclusions. Well, except one to be honest, I don't think momentum is a true random variable. All the evidence suggests that it exhibits, at least to some degree, serial correlation and this is why we can make money trading it! Generally, 1 year performance is most predictive over a 7 to 11 month time frame (though there is the one month reversal effect to take into account). On a case by case basis though it does give the appearance of being, as you say, very 'skittish'.
You've definitely hit the nail on the head re this being a stats game though! This is exactly the idea behind factor based systems like the StockRanks....a single highly ranked stock has some probability x of winning but as you combine more and more of them together the probability of the portfolio as a whole winning increases dramatically. Your observation regarding the high QM stocks and their relationship with the value rank is also something we think about - Ed and myself were actually just discussing this yesterday!
I also agree that QVM does not warn well against the quick 50% falls...or even some fairly slow ones! This is, I believe, due to the effect that Phil mentioned above - ranks lag prices due to the slow dissemination of financial information and so when there is a bad set of results the ranks don't see it coming and have to adapt quickly...but all too late nonetheless. The QVM chart of Tesco is quite interesting in this regard. Here we didn't have a rapid drop in price but rather a steady decline. Surely the ranks should cope better in these scenarios? Well, no they didn't it turns out. Due to a small recovery before a poor set of results, the MomentumRank was actually on the rise again while value was good due to it being based off of old financial statements. This caused the StockRank to actually improve in the run up to the results. Check it out:
You can see the long green sideways streak which immediately turns to orange indicating a quick and sudden drop in rank after results day.
By that point (May 2015), if you had held on through the more highly ranked times you had already seen significant losses so I'm afraid QVM didn't necessarily save us there. One counter argument for that though would be that actually the StockRank hadn't been that high (70 to 80 range) beforehand so a true QVM advocate would possibly have been out already. The other is that despite the losses up to that point, getting out following the big change in rank would have helped prevent further losses...
We're definitely keen to make it easy for users to explore and analyse the ranks (and factor investing in general) in the future, we have a lot of ideas for that but its taking a little bit of a backseat to getting the new site out at the moment. While we do make public the methodology behind the current ranking system they do still feel a little bit like black box.
Anyway, thanks a lot for your comments and thanks for the ideas in that Snoozebox Holdings (LON:ZZZ) blog I mentioned before. I must admit though, I shunned R in favour of Python, with which I'm much more comfortable!
Tom
The main thing that strikes me about Boohoo.Com (LON:BOO) is that over the entire period Q remains above 60 and V remains below 30 so it never ceases to be high-flyer-ish. So these rankings seem to be really very stable - whereas the M rank varies from about 10 to 99 during this time. M is very skittish compared with the other stock ranks. (I also saw this with all the stocks I looked at. It is not special to BOO.)
And no wonder the M rank changes so much. BOO fell by 50% in less than a month in Dec 2014 and then proceeded to climb back again over the next year and a half. But a 50% fall in price only resulted in a rise of V from 5 to 24. It's a good illustration that "cheap" in terms of V is relative. Stocks like BOO rarely have extremely high V ranks. A rank near 30 is definitely "cheap" for many Q>75 stocks. (High values of V (>60) often indicate that the market expects quality metrics to get worse for that stock in the future.)
Something else which is very clear is that there really is little warning in QVM ranks that a stock might plummet by 50%. BOO's quality metrics remained strong throughout (in fact they were slightly better in January 2014 than now absolutely but the rank fell a little) and it duly recovered. You are playing a statistics game. The variance in the price is very high, but over time periods of a year or longer the variance gradually gives way to the underlying drift (mean trend) and the underlying drift is strongly correlated with Quality Rank.
Of course you can try to play a shorter term game by exploiting momentum, but if you do you need to be aware that Stockpedia's M rank lags what is happening now. You would need other TA techniques to time momentum plays (if indeed it is possible at all).
Conclusion: Stockopedia's Q rank is a guide to a probability of good performance over a 1-2 year future time frame; V is an estimate of value but it is hard to interpret and its interpretation is highly contingent on the value of Q; M is a random variable!
Conclusion 2: it would definitely be nice to have more tools for examining values of Q V M historically for stocks, but especially in aggregate - i.e. statistically how do different combinations of Q and V perform?
The other interesting aspect is the smoothness of transition of each of the ranks.
Value and Momentum tend to move smoothly whereas Quality is notchy, shifting sharply as results are published.
For me, the notchiness of the Quality factor also ties into the potential notchiness of the price. So the price lags news, e.g. results etc and Quality Rank lags that news too. So by the time the Quality Rank has dropped the damage has typically been done in terms of falling share price. A High Flyer becomes Glamour Trap.
I typically select SuperStocks or High Flyers and I tighten my virtual stops when they become Glamour Traps as I'm expecting the Momentum to dry up and the loss of high quality means I'm less prepared to tolerate drawdowns.
It would be good to have these graphs animated!
Cheers
Phil
Hi Phil,
Don't know if you saw it but there was meant to be a little animated gif in there. Sadly the image uploader failed on it at first so I had to call in some help (thanks @Adam Collingburn).
Its up now though so you can see it near the top of the post. We had to compress it to get it on so its a bit smaller than I wanted but it does the job nicely. Seeing it move about gives a much better feel for it all.
Tom
Interesting stuff, Tom, but I think that given that we're looking at this on 2D screens the 3D charts are intrinsically limited. For me, one chart with quality, value, momentum, growth and overall stock ranks against time would be easier to read and tell us the story more succinctly.
Hi - there's supposed to be a little video which eases the pain a little with this particular point...although there have been some technical difficulties with our image uploader. Should have that fixed in a bit.
When you have the interactive thing in front of you it is quite interesting and good fun to play around with, as you say though, hard to convey through a mere 2D blog! Just a bit of fun more than anything if we're honest however.
Have a good afternoon,
Tom
EDIT: OK got the .gif file working, had to cut down on size a lot so its lost some image quality but its working at least!