Boon's Fund - did these three factors drive my returns in 2021-2022?

Introduction
I have decided to do a bit of a retrospective over my decision making (buys and sells) over the past two years, to see if I can gleam any learnings to take into 2023. So I have looked at three factors that could have influenced my gains or losses: my position sizing, my average holding period, and my sell timing.
I try to answer the following three questions, in order to see if I need to change my buy & sell decision process going into 2023, to drive better returns.
- Q: Has my sizing decisions been a positive driver for returns?
- Q: How do I optimise my holding time, and decide when to crystallise or ride?
- Q: Do I have good sell timing?
Vital Stats
17 shares in total, that I have bought since 1st Jan 2021, and completely sold out by now. I have not included any shares that I bought prior to 1st Jan 2021, otherwise I’d be up all night compiling the data! Nor have I included any share purchases that I still have a holding in currently. I have included any dividend distributions received during the time.
The shares are detailed as below.
| Share | Holding Duration (months) | Gain / Loss | Post-sale SP Gain / Loss |
| Ethernity Networks (LON:ENET) | 6.7 | 56% | -78% |
| Empiric Student Property (LON:ESP) | 5.8 | 39% | -15% |
| Innovaderma (LON:IDP^F22) | 1.8 | 4% | -35% |
| Rio Tinto (LON:RIO) | 16.9 | 19% | 19% |
| French Connection (LON:FCCN^K21) | 5.8 | 46% | 2% |
| Saga (LON:SAGA) | 15.5 | -55% | -24% |
| System1 (LON:SYS1) | 7.1 | 55% | -66% |
| Sosandar (LON:SOS) | 6.5 | 39% | -35% |
| National Express (LON:NEX) | 1.2 | 14% | -52% |
| Revolution Bars (LON:RBG) | 4.9 | -4% | -64% |
| Ishares Physical Metals (LON:SGLN) | 9.7 | 12% | 0% |
| Fulcrum Utility Services (LON:FCRM) | 12.6 | -88% | -44% |
| Intercede (LON:IGP) | 11.7 | -29% | 0% |
| THG (LON:THG) | 2.9 | -8% | -55% |
| Spaceandpeople (LON:SAL) | 10.4 | -1% | 0% |
| Zytronic (LON:ZYT) | 6.3 | -7% | -1% |
| Yu (LON:YU.) | 3.9 | -6% | 183% |
Profit/Loss
The mean average gain amongst these 17 shares have been a paltry +5%. However, my portfolio has gained +21.6% in 2021, and on course for 10% in 2022. What explains the difference? Weighting has played a part; on a position-size-weighted basis, my 17 shares have gained +6.7%, compared to +5% on a simple mean average.
It can’t be “turnover”, as the sum of the cost of all 17 purchases add up to less than my entire portfolio value (due to me holding a large chunk of my fund in cash over the past two years). I am not a trader, and not looking to "trade and turnover" my capital multiple times a year to compound returns.
So where is the difference company from? Probably coming from unrealised gains of my existing holdings, which are not included in the calculations above. Indeed, Stockopedia’s portfolio function shows that my unrealised gains are roughly equal to my realised gains.
Q: Has my sizing decisions been a positive driver for returns?
Below is a chart showing the distribution of gains, compared to the £ invested, indexed to the average (1.0 = the average amount initially bought amongst the 17 shares). For example, Saga (LON:SAGA) buy size was 1.69x my usual buy size, but delivered a -55% return.
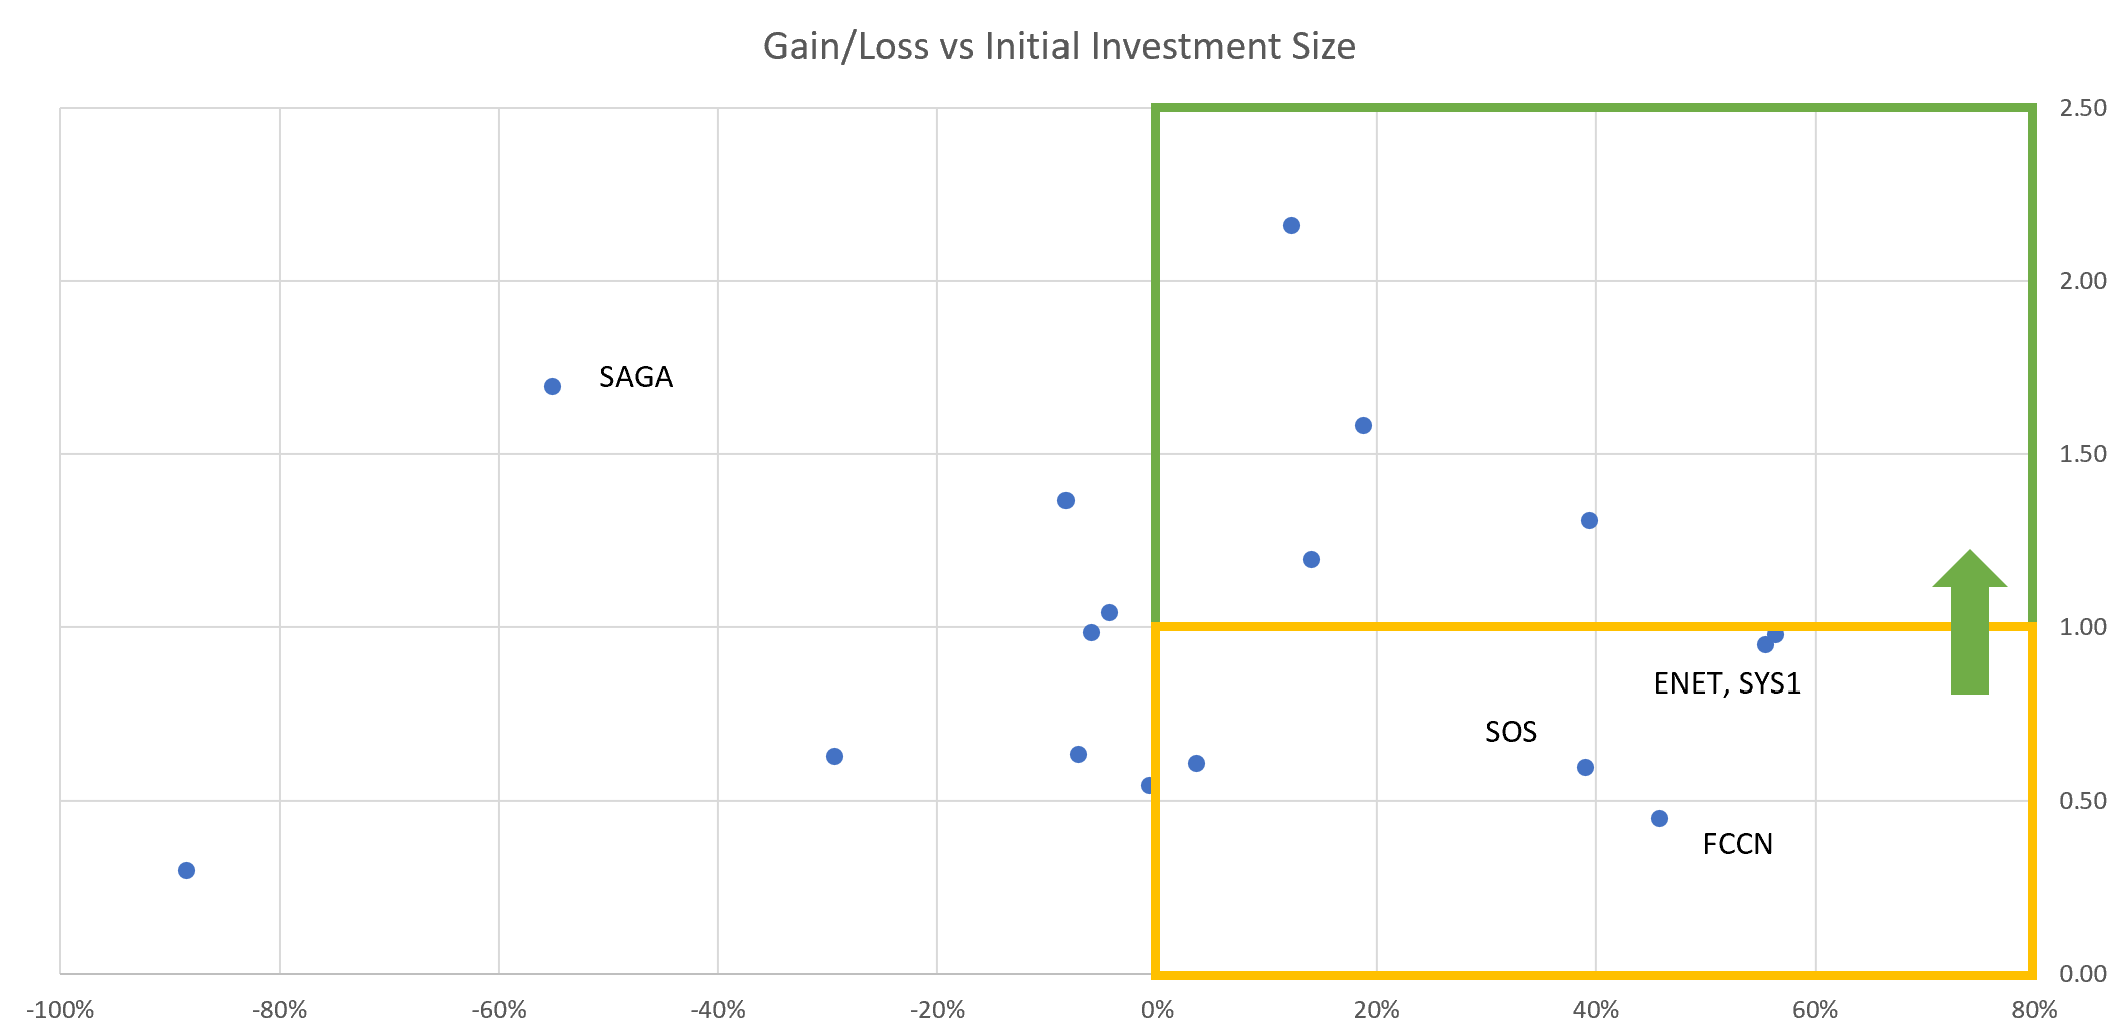
The picture isn’t super clear whether I have been able to size my investments correctly for risk/reward.
In the yellow box, this is the quadrant of shares where, in hindsight, I should have increased the buy position sizes, to maximise my absolute gains. You want to have those dots move from the yellow to the green box. However, looking at the 4 names on the chart, they are all small-caps. Looking back at my notes, I wish I could have bought more, but was limited by my self-imposed liquidity rules, which are based off on average daily trading volumes, and there to allow me to exit positions easily without taking a big price penalty.
This reminds me of Warren Buffett; he famously claims that if he were only managing small amounts of money nowadays, he would deliver spectacular returns, because he could overweight his portfolio with amazing value small caps. Whereas in reality given his gargantuan fund size now, he can only hunt in large caps, where the potential price anomalies are lower, given the multitude of investors also looking at those companies.
Perhaps my portfolio size has now gotten too big, to keep focusing on small caps, despite them proving profitable for me? My returns (as a percentage of my overall portfolio) will be limited, given my limits on the sizes I can take. I could always invest in more small caps; but my time is limited (as I have a full time job) to expand the universe of shares I keep tabs on. Also, the 10th idea is never as good as the 1st or 2nd, so there is a law of diminishing returns.
The other solution is that I ease my liquidity rules, in order to be able to take bigger positions. This is the easiest way; albeit one that I am not comfortable doing at the moment, especially given the drying up of liquidity over the past year, vindicating my decision to be cautious. Going into the next bull cycle, I will try to me more aggressive in my position sizes compared to liquidity. As trade volumes (and therefore liquidity) will inevitably rise too, so one can take a more relaxed approach to liquidity.
Going into 2023, I will endeavour to make a more conscious decision to research and track more mid-cap shares, rather than small-cap, in order to be able to take larger position sizes without breaking my liquidity rules.
Q: How do I optimise my holding time, and decide when to crystallise or ride?
My mean average shareholding duration is 7.6 months (albeit this is a red herring, as I have plenty of shares bought over the last two years, that I still hold, and not factored into this average).
The chart below plots each of the 17 holdings, showing their gain or loss compared to the holding time period in months. I was surprised when I first visualised this chart; in a normal scenario, one would expect a funnel-shaped graph, with the longer holding period correlating to either bigger gains or losses.
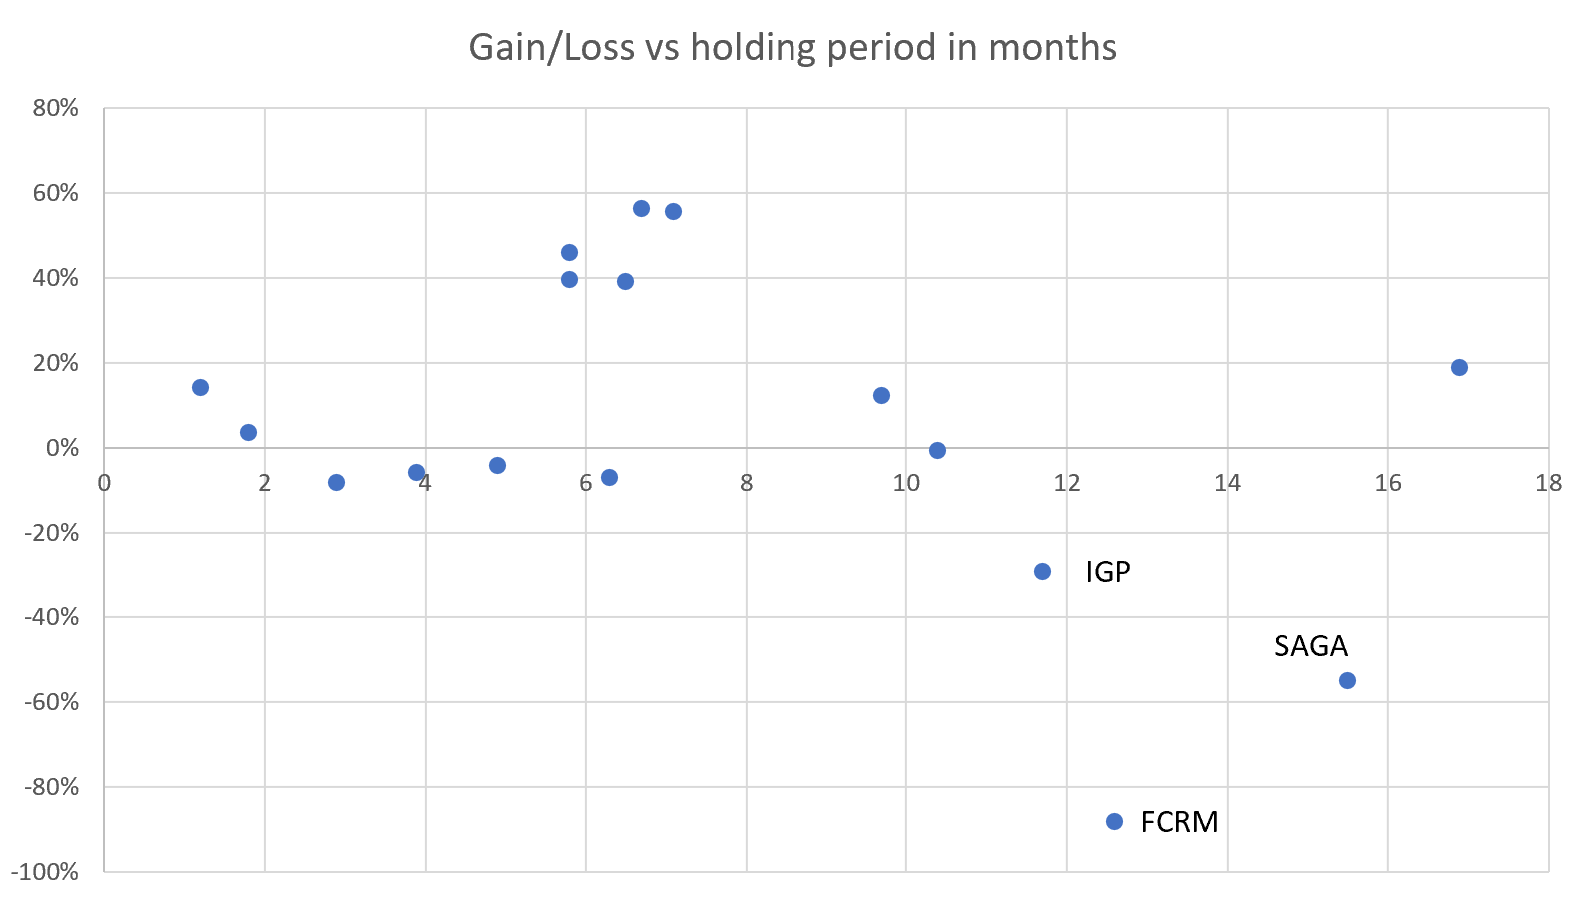
Success would be a chart that shows most of the losses to the left, and to the right, only big gains. This will show a good execution of the “cut your losses early, ride your gains” strategy.
However, it looks like this graph has exposed a weakness of mine; that I am good at spotting shares that could re-rate substantially within 6-8 months. But I hold onto my losers for too long, tying up my capital in my big losers for 12-16 months, when I should have cut my losses sooner.
Looking at the three shares that fall into this category (IGP, FCRM, SAGA) – my notes show that I had started getting cold feet way before I eventually sold, and was too optimistic and not brave enough to sell and crystallise the loss to move on. However, not all is lost; I did not sell at the bottom, as the current SP of the three in order are currently at +0%, -44%, and -24% of my sold prices, so I still managed to get out before they declined even further.
Going into 2023, I will endeavour to be more ruthless with my underperforming shares, cutting them sooner rather than later. I think I will set a reminder for every purchase I make, at the 8 month mark; if my investment hypothesis has not been realised by then in terms of share price improvement, I will be more ruthless in whether to sell to recycle the capital, or to keep holding.
Q: Do I have good sell timing?
My sell timing has been very good; on average (mean), all 17 shares are now -22% lower in share price than the price that I sold at.
I am somewhat pleased with my performance here. I know the mantra that gets parroted about; that one shouldn’t try to time the bottom to buy, or the peak to sell. And my strategy is not to – I set clear buy and sell thresholds, and when my shares cross that, I usually follow through. I don’t look at charts to use technical indicators for buying or selling. However, I do let sentiment creep in; there are times when I am more bullish or bearish in terms of the macro, where I think the market or index is over or under valued. And this then manifests into my buy and sell threshold recalculations.
Plotting a graph that shows my average gain/loss compared to the post-sale performance, we see an interesting trend. The horizontal x-axis is the actual gains or loss crystallised, and the vertical y-axis is the performance of the share price since then. The short verdict is that I have managed to “time” my sells quite good, as the vast majority has declined in value since my sale.
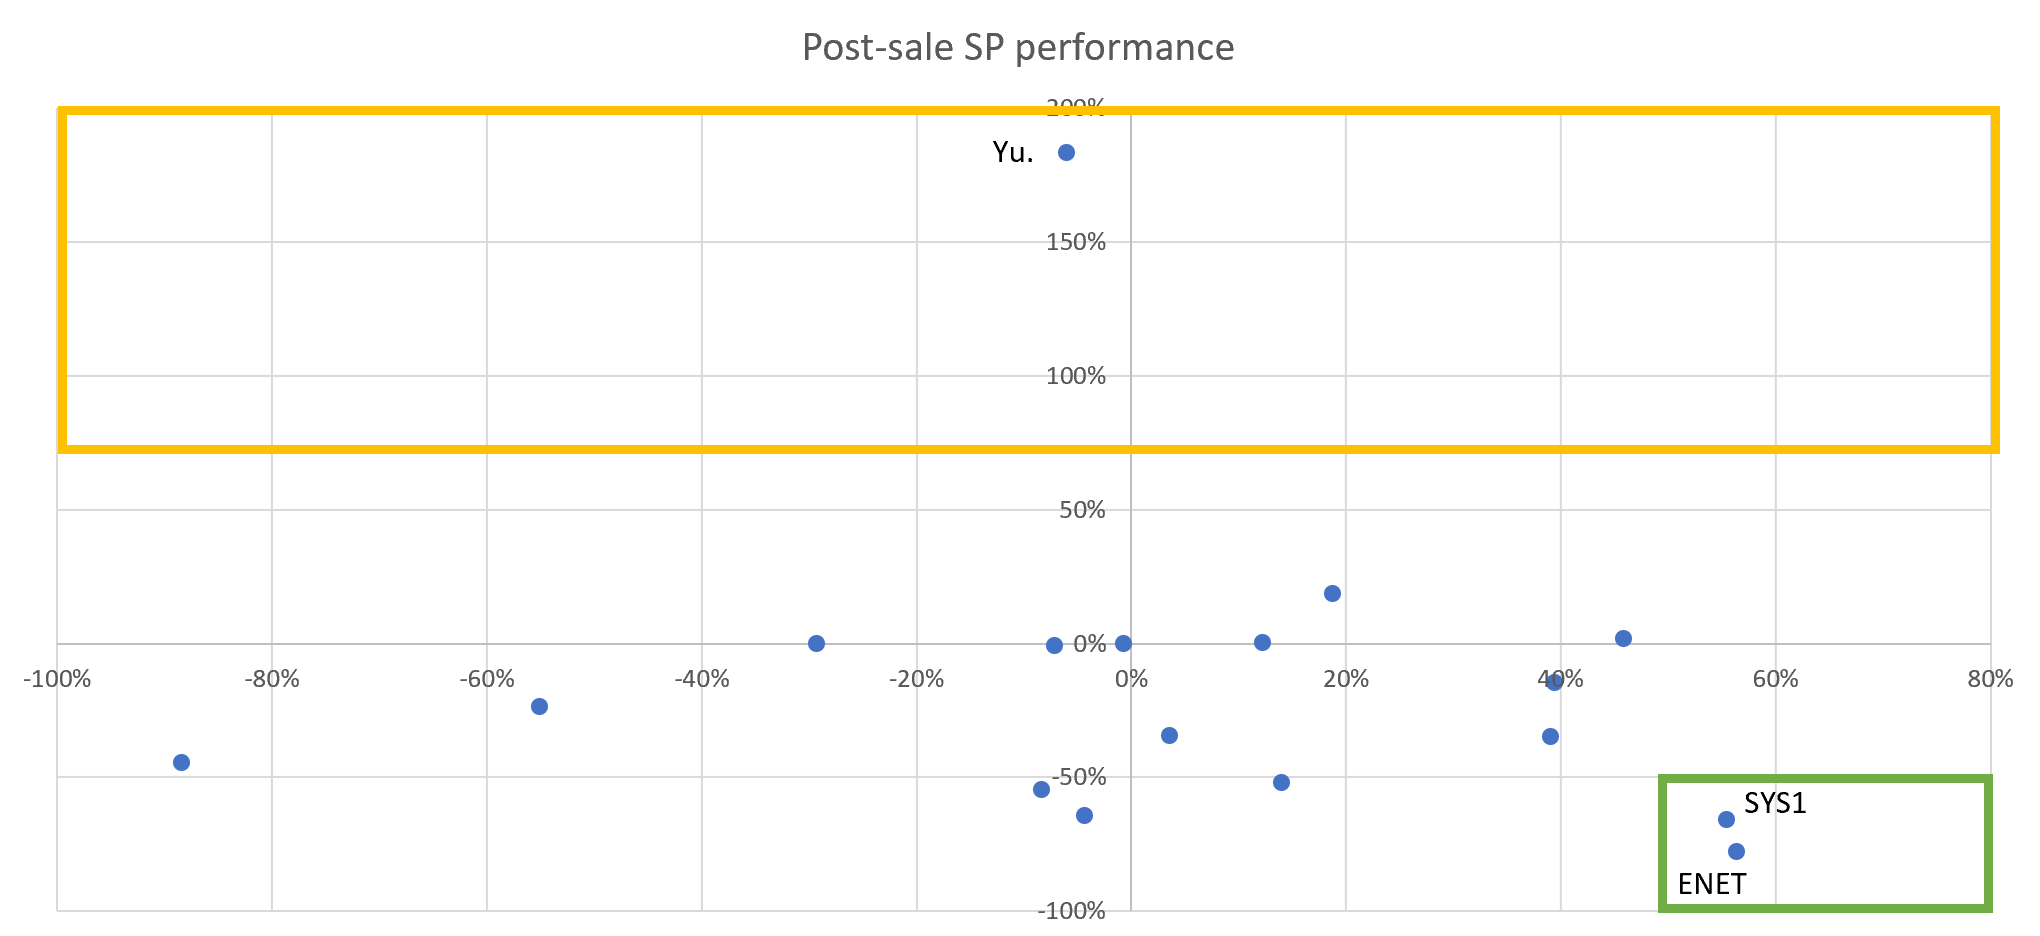
Of note, looking at the green box, this is where it can “make or break” a portfolio returns. In both cases of FCRM and SYS1, I managed to crystallise >50% gains; if I had held on to those shares, I would be underwater to my initial buy price by now. Looking at both those shares, neither are what I could call “high quality” companies; both were rather “blue sky” companies, and therefore one has to be nimble with those, to be able to judge when is the right time to exit when the share price is up in the heavens with euphoria, before any bumps in the road come along. So this is a lesson learnt, that when holding blue sky type companies, one has to be more active in monitoring the investor sentiment, and the progress of the company, in order to manufacture the right time to exit.
In the yellow box, this is the zone that any investor wants to avoid being in. Where, after a sale, the shares rise significantly. Unfortunately, I had one of these in the form of YU. I had sold out when it looked like new government intervention would upend their short term business prospects. As a blue sky company, I was being “agile” and exiting before the thunder and rain starts. However, my prognosis was wrong, and the company since then has continued to outperform market expectations, and investors have now flocked to it, driving the share price to new record highs. This is now getting close to a 2-bagger price, and I’m kicking myself for making the wrong decision in this case.
Going into 2023, it looks like my sell decision making has served me well so far, so I will not be consciously making any tweaks to my process. While I was a bit too trigger happy with YU, my process served me well with ENET and SYS1, so on balance I am probably still making the right calls.
If you've made it this far, thank you for taking time out of your day to read through my article! If there is something I've missed in my analysis, or if you have any thoughts on drivers of buy and sell decisions, I'd love to hear from you in the comments below.
Next week, I'll be publishing a yearly wrap-up of The Boon Fund performance in 2022. For now, hope everyone's having a good end year festive-season!
Disclaimer
This is not financial advice. Our content is intended to be used and must be used for information and education purposes only. Please read our disclaimer and terms and conditions to understand our obligations.
3 comments
Fascinating, thank you for sharing!
Thanks for sharing Boon and well done for minimising your losses! ! I would love to know more about your exit strategy. What makes you sell a share?
Thanks for reading!
There are three reasons why I sell a share:
An example would be Zytronic (LON:ZYT). I had invested because of two hypothesis; that they would see a post-covid jump in revenues again, from the gaming sector. And their new R&D into new sectors could provide a growth engine, and therefore drive EPS growth as well as P/E multiple growth. However, as inflation bit, I knew that it was only a matter of time before gaming activity got hit. Also, they started going quiet on their new R&D and new sectors, which meant that they were not seeing good traction (yet). Maybe both will come through once inflation moderates and they gain traction in new sectors, but for me that meant that +40% horizon went out further, and I didn't see their share price making much headway in the next 12 months.
---------------
Hope this gives a bit of insight into when I sell! What I don't look at is technical indicators, to decide when to sell. For smaller holdings (<5% of my portfolio) I tend to sell all at once, unless low liquidity forces me to drip my sells over time. But for anything larger than 5%, I tend to sell down in steps, over a period of a week or two, to average out any volatility in the share price.