Defensive value portfolio: 2013 Q3 performance review

Conducting a portfolio performance review on a regular basis is a key step in the investment process. If you aim at nothing, you’re likely to get it, as the saying goes. So, self-directed investors need a goal and they need to review their progress towards it at suitable intervals.
I have chosen quarterly reviews because I think a month is too short a period to have anything interesting to say, and a six-month or annual review is a little too passive for my liking.
Know your goals
You should have a set of goals or outcomes that reflect your own personal situation. For the UKVI model portfolio the goals are simply to have higher income and growth than a passive alternative, with less risk. Specifically, I want:
- A higher yield than the FTSE All-Share at all times
- Greater long-term income and capital growth than the FTSE All-Share
- Lower capital volatility (risk) than the FTSE All-Share
Choose your tactics
To achieve the goals set out above I use several tactics including:
- Invest in successful companies with good track records
- Buy them when their valuations and yields are attractive
- Hold them for years rather than months so that they have time to grow and pay dividends
- Sell them if their valuations and yields become unattractive
- Be more quantitative than qualitative (approximately an 80/20 split)
- Be systematic and follow (and improve) a pre-meditated plan
- Focus on the long-term rather than the short-term (again, perhaps an 80/20 split)
Measure your results
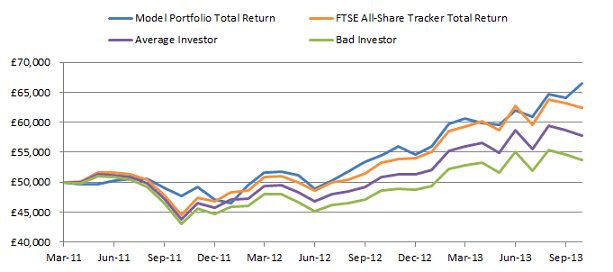
The portfolio has been running since early 2011 and you can see the total returns to date below. Note that the portfolio is compared (including all trading costs) against a FTSE All-Share tracker trust as well as two estimates of the returns to typical self-directed investors. The “average” investor underperforms by 3% a year (a number quoted by Barclays Wealth in a recent report) and the “bad” investor underperforms by 6% a year (taken from the book “Monkey with a pin” by Pete Comley).
In a bit more detail:
- 1 year return is 22.2% compared to 17% for the index
- Return from inception is 33.1% compared to 24.8% for the index
- Annualised return is 11.7% compared to 8.9% for the index
- Total value is £66,537 compared to £62,377 for the index
- Dividend yield is 4% compared to 3.1% for the index
- 1 year beta is 0.6 (index beta is 1)
So the portfolio has met each of its core goals of providing a higher yield, with higher growth, for less risk than the market index. However I’m well aware that this is a short time period, and I’m more interested in how things will look in a few more years; but so far so good.
If you don’t currently track annualised rates of return or beta then here’s a link on how to calculate annualised rates of return using MS Excel and another on how to calculate beta.
Don’t forget income
One part of the investment goal is to grow income faster than the index, which doesn’t really show up very well in the chart above. So here’s another way of looking at the portfolio’s performance, which focuses on dividends paid rather than capital values:
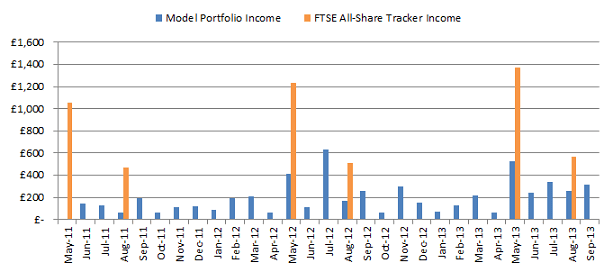
Here you can see the growth of income in both the index tracker and the UKVI model portfolio. These incomes are reinvested, so they are growing faster than if they had been drawn down.
It’s easier to see the growth in the index’s income because there are only two payments a year. In fact it has grown very well as we’ve gradually come out of the great recession. The model portfolio’s income has grown too, and the results so far in each year are:
- 2011 – £825 for the model portfolio compared to £1,531 for the index (because the model portfolio was built up gradually through 2011 and so held large amounts of cash for much of the year)
- 2012 – £2,659 for the portfolio compared to £1,742 for the index
- 2013 – £2,164 for the portfolio year to date, compared to £1,937 for the index (with 3 months still to go)
Dividend growth for the portfolio is a little hard to measure over such a short time period, but the index has done well, growing by 13.8% from 2011 to 2012 and 11.2% from 2012 to 2013.
Analyse what drove those returns
Now that the results have been reviewed it’s a good idea to review what drove those results.
There are three “actors” at play here:
- The companies that you’re invested in, their management and competitors
- “Mr Market”, the excitable and somewhat frantic entity who decides what price each share will have.
- You. Specifically the buy and sell decisions you make.
I don’t really have the space here to go into all the various things that have happened to the 30 or so companies in the model portfolio in the last three months. In most (but not all) cases the companies continue onwards and upwards, continuing to succeed today as they have in the past.
As for Mr Market, I would say that recently he has been relatively calm. The FTSE 100 currently has a CAPE (Cyclically Adjusted PE) of 13, which is slightly below average and nowhere near “frothy”. Mr Market is certainly not irrationally exuberant at the moment.
As for my own actions, I buy or sell one company each month and the last three months has seen the following decisions:
- July – Sold Interserve for a total return of 117%, which gave an annualised return of 45%
- August – Bought a FTSE 250 company with a dividend yield of 4% and a growth rate of 12%
- September – Bought a FTSE 100 company with a dividend yield of 4% and a growth rate of 11%
As you can see with Interserve, I will occasional take profits from companies where the share price has bounced up. I expect that this will help to drive the portfolio forward, in addition to reinvested dividends and growth from the underlying companies.
Make sure your investments are headed in the right direction
It really is important to do this sort of review at least once a year. If you don’t then you won’t have a good idea of how your investment efforts are working. If you’re up 10% for the year then that may be great, but if the market is up 20% then perhaps you’re not doing so well.
They’re also a way to break up the long investment journey. They’re like mile-stones in the road. You can take a rest to see where you’ve been, then make sure you’re still on the right path, and finally think about where you’re going and how you’re going to get there.
Disclaimer
This is not financial advice. Our content is intended to be used and must be used for information and education purposes only. Please read our disclaimer and terms and conditions to understand our obligations.
No comments yet
No one has commented here yet! Why not be the first one?