Do Nothing

One of the great virtues of Stockopedia is its advocacy of a rules based system to select shares to buy, and its provision of a range of metrics that are proven over time to be successful. But how do you know whether its time to sell?
Roland Head wrote a couple of fascinating posts on this topic as part of his Stock in Focus series, here and here . I'm looking forward to seeing how these work over time. But I'm struck by the fact that, even as rational an investor as Roland tries to be, he's proposed rules that are based on personal judgement about what constitutes a sell signal. They look pretty sensible judgements, but do they really yield better performance than the alternative - do nothing?
How do you measure the effectiveness of your selling strategy?
I've been chewing on this problem for a while, as it requires the availability of information about what would have happened in an alternative reality. The one where you didn't sell, or sold less, or even bought more of the stock in question.
At least in principle, the effectiveness of a selling strategy must be that:
- the return made on your alternative use of capital net of frictional costs exceeds the return you would have made had you done nothing.
But how to measure that in practice? Many people track the performance of shares that they have sold, though it isn't a topic that is shared on most of the discussion forums that I watch. However, even where an individual does so, it is unlikely to represent a statistically significant sample across different sectors, geographies and time periods. Terry Smith, Warren Buffett and other notable investors have a common approach: if they believe the company fundamentals remain strong, their holding period is indefinite. But if you are less confident in your judgement about what "fundamentals remain strong" actually means, what mechanical test can you put into place?
Why don't we backtest selling strategies the way we do buying strategies?
Its odd that we have so many backtested models out there that look at the effectiveness of which shares to buy, but few if any that look at whether and when to sell. I looked up on Investopedia and found a number of posts that talked about theory and emotion of selling shares, and different criteria that can be applied. https://www.investopedia.com/articles/stocks/10/when-to-sell-stocks.asp. But, nothing that answered the most important question: do these rules actually work?
Let me start with the pockets of data and evidence that I have seen. These are clearly incomplete (any readers who have other or more comprehensive references, I'd love to hear from you).
- on average, private investor sell strategies destroy value. Although I've not been able to source the original report, the article here cites a study conducted by Fidelity Investments over the period 2003-13 that established that the highest performing private investors were those with no activity in their accounts. Either because they had forgotten about their account, or they were dead. I'm frustrated that I couldn't find a more definitive analysis, but assuming that the same holds true across a longer time period, then the message is clear. The act of selling is generally value destructive (since, as soon as investors stopped doing this, their returns improved).
- a company whose share price is subject to a sudden shock (meaning an intra-day price fall of 20% or more) is likely to continue declining in price for the next 12 months. Stockopedia's research on profit warnings here shows conclusively that, irrespective of the underlying cause, once a company has a sudden decline in its share price it is likely to continue to decline for some time. So, there are clearly circumstances where selling is the right thing to do.
- trading carries frictional costs that definitely exist, but vary widely in size. These can include trading costs, bid-offer spread and capital gains tax. Of equal importance to the cost per transaction is the frequency with which you sell. Sell more often, and you will incur more costs
At present, I sell using the inverse of my buy rules. I buy a sector balanced portfolio of shares with a stockrank of 80+, rebalanced half yearly. I sell any stock whose stockrank falls below 70 at the review point, or if it suffers an intra-day fall of 20% or more. Using a lower threshold to sell than to buy is intended to cover the frictional costs of trading - or at least that's what I tell myself. But I have no idea if this is a good strategy.
Understanding the frictional cost of your current rules
Before thinking about whether you should have done nothing, you have to quantify and measure the frictional costs that apply to your particular investment strategy. Different selection rules result in different levels of trading activity and hence cost. I've been running a Stockranks based portfolio for a little over 5 years now, so was able to conduct my own analysis capturing:
- the number of trades carried out in each year
- the commission charges paid
- the bid offer spread for each traded security (this varied a lot by stock, but was surprisingly consistent on an annual basis at 1.02%)
- the total value of the portfolio (so, what % of my portfolio was subject to a sell in that year)
The table below shows the numbers

What did this show?
Firstly, selling is a material cost to portfolio performance, subtracting 1.49%-3.01% pa. Secondly, it varies widely from year to year. 2020 was characterised by extreme market volatility, which meant that far more stocks met my sell criteria than would normally be the case. Nonetheless - 1.49-3.01% is a very wide spread.
You may ask why I included stamp duty given that this is paid on the purchase of a share, rather than its sale? Although this is a cost of purchasing the first time you pay stamp duty, for all subsequent purchases (assuming that you sell a share in order to release the capital to buy a new one), it is incurred as a result of the sale decision. Therefore, it has to be added as a frictional cost of selling - if you didn't sell, you wouldn't incur stamp duty on the replacement share you bought.
I'm sure that it possible to lower trading costs, although stamp duty and bid offer spread is less controllable. But the central point remains: regular dealing is a significant consideration. Dealing costs consume most of the dividend income that I receive.
Helpfully though, this provides a benchmark: I'm better off selling if I think I can improve my return by more than 1.5-3% return from the alternative investment.
But will I better off, how do I know?
To work this out, you need to compare the performance of your existing investment with the performance of the alternative. This is a brute to model correctly as soon as you complete your second sale. The reason? You need to consider
- the outcome if you hadn't sold the first share and bought the second (i.e. what did the original share do vs. the new one?)
- the outcome if you hadn't sold the second share at a later date (so, what am I comparing the outcome of the second share sale with - the third one I subsequently bought, or the one I bought first time around?)
- etc. Pretty soon it becomes impossible to identify an appropriate baseline from which to compare all the choices, since your future buy decisions are contingent on your past sale decisions.
The closest proxy I could come to a testable sell strategy was to compare investment returns for a basket of shares all selected using the same metrics, but with buy and sell thresholds within those metrics.
For example: Stockranks.
If your threshold to buy is a stockrank of >80, are you better off to hold that same stock even when its stockrank falls below 80? At what point should you sell? What level of volatility is likely in a company's Stockrank, and how do you get the right tradeoff between selling stocks that are likely to underperform vs. incurring the frictional costs associated with regular dealing?
Hard. But may be possible? Could we examine the returns for different Stockrank deciles over time and assess the effect of holding a stock that falls below your buy threshold? How far does it have to fall before you would be better off selling and buying a company that does qualify?
I had a bit of a dive in. You can find a charting tool that models this for different company sizes and selection criteria here. https://www.stockopedia.com/learn/stockranks-&-ratings?cap=2500&period=2.
The first thing I looked at was the annualised return for different deciles. In theory, I just work out which deciles have a greater than 3% difference in annual return, then use that as my threshold for selling. Easy, right?
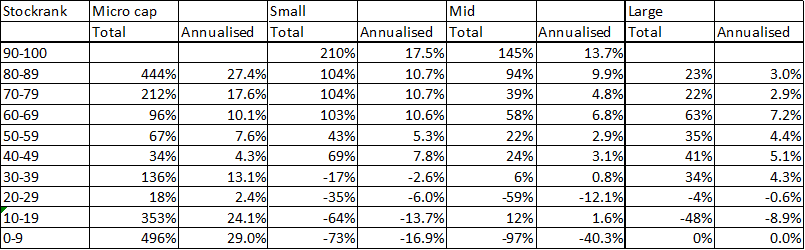
Wrong, because it turns out that Stockrank performance by decile doesn't follow a consistent pattern. In fact, it threw up some very surprising figures. So surprising at the extremes that I have some questions about the data itself. I suspect that there is a survivor bias at very low Stockranks: only a small % of micro caps with low stock ranks actually survive for long enough to register in the dataset. Those that do survive are the exceptions: companies that eventually improved their performance or were acquired at a hefty premium. The rest delist or go to zero. Similarly, at the other end of the spectrum there are relatively few large companies that consistently sit at the highest stockranks. Their prices rise to compensate.
However, for those of us that do use a Stockranks based portfolio to buy shares there are some interesting indicators.
- for micro and small caps, the difference between the stockrank deciles is very large. The difference between the 70th and 80th deciles is nearly 10% pa. Definitely more than the frictional costs of trading. But check the volatility within the numbers. Hard to imagine that a rules based approach here will be good for those of a nervous disposition.
- For large caps, the difference in performance is negligible. In fact between the 30th and 90th decile there is very little difference in annualised returns.
- But, there does seem to be a Goldilocks zone in the mid caps - not too volatile, not too average, where Stockrank deciles provide a nearly consistent prediction of subsequent performance. You might reasonably build a sell strategy based on stockrank deciles here, allowing for your own dealing costs and tax position.
I conclude... what? That if it were easy someone else would already have done it
As I've poked into this problem its become clear how hard it is to systematically backtest or prove the utility of different selling strategies. Its also changed the way I think of investments - I've realised that what and why you sell is probably more important than what you buy. In the short term, I'm tailoring my sell strategy based on the size of the company.
- for micro, small, and mid caps I sell anything that falls below a Stockrank of 90 - since i can recycle the money into a company with materially higher annualised growth prospects
- for mid caps I hold until the stock rank goes below 60
- for large caps I hold until the stock rank goes below 40
What do you think? Do you have a systematic process for deciding whether to sell a share, and how did you come up with those particular rules?
Disclaimer
This is not financial advice. Our content is intended to be used and must be used for information and education purposes only. Please read our disclaimer and terms and conditions to understand our obligations.
20 comments
Yes, absolutely, gari en desti, the whole quarterly earnings routine is a recipe for volatility and unpredictability. Traders like Minervini advise against buying just before the quarterly figures. The most logical approach is to buy a straddle - as Wilbraham mentions - and just gamble on a big move one way or the other so that the profit covers the expenses of the losing bet.
Kelvin this is an excellent and thought provoking article. So thank you for takiing the time to start this discussion.
However, what you are suggesting by using stock ranks in this way to buy and sell could be done by a computer program. It’s all a bit too formulaic for me.
Where’s the gut feeling?
Isn’t that the exciting thing about these risks we all take, that hopefully our gut feeling will be rewarded with big returns?
Paul in The Small Cap Report’s is constantly raving about the potential of Revolution Bars (LON:RBG), Saga (LON:SAGA) and Boohoo (LON:BOO) and so on. These all have absolutely shocking stock ranks, but the gut feeling and experience of many of the subscribers who read these reports, can see the potential of these companies, as can Paul.
So to solely use stock ranks or some other ridged formula, maybe limits you to limited gains. So in the long run, it doesn’t really matter if you just buy and hold or buy and sell.
You also ask if anyone has any particular rules for deciding whether to sell a share or not. But there are so many other things involved than a set system or rules. What about the human touch, to be able to react to what is actually happen and adjust to it.
This leads me on to your other point about frictional costs.
Several months ago I started to wonder if the fees, spreads, commission and stamp duty, affect you in more than a monitory way.
I noticed that I wasn’t always motivated to switch out of a share, as sometimes it seemed like it was hardly worth it.
Maybe there is also the fear of missing out; when you have held it for so long and it doesn’t really perform, one might think it’s got to do it sooner or later. But deep down I think the cost of switching does affect ones desire to switch.
I started to do some research and discovered that most online brokers in the USA don’t charge any fees, there is no stamp duty and the spreads are mostly tiny compared to in the UK.
So 3 months ago I decided to conduct an experiment. I set up a no fee account with an online broker in the USA and also a new account in the UK, with one of the cheapest brokers. I then funded both accounts with exactly the same amount and transferred USD to the US account, so there were no FX charges, then I started to invest.
I have noted the details of each investment on a spreadsheet, so I can review the results on going and do a monthly breakdown.
I did heaps of research, as I didn’t have much knowledge of the American market or the companies. I set up a few screens on stocko using various filters including stock ranks over 90. This throw up lots of companies I had never heard of but after more research, I narrowed it down and started to invest. I also did the same in the UK.
Then I started to move away from stock ranks and did a few different searches and looked out for interesting company news in the USA, as I do in the UK. I found a company in the USA that I really liked the look of, more than one I’d invested in, so I did something that felt quite liberating, I sold that first share after only a few days for a gain of $43. (As these investments are fairly small, if that had been a UK share, the fees, stamp duty and spread would have eaten up all of the gain and maybe created a loss and would have made me consider not selling at that time.) The second round share I switched into went up 7%, which I sold and invested in a third share, which increased in value by 21%. Then I looked at the performance of the first share, it had only increased in value during that time by 3%.
At the end of 3 months the difference is quite startling. My UK test investment fund has gone up by 3%, whereas my USA test investment fund has increased by 30%.
This isn’t all down to the motoring US stock market, as the tech crash in the USA in early Sept badly affected my US test investment fund.
Not having to consider fees, stamp duty and large spreads has allowed me the freedom to carry out nearly double the amount of trades in the USA compared to the UK and I’m starting to see this as a huge advantage over doing nothing.
Gari en desti. Many thanks. You've reached the same conclusion as Donald Pond and me (and probably quite a few others). The US market is remarkably cheap to trade compared with UK. I have used both a commission free broker (IG which has 0.5% FX per trade) and spread betting. Whilst I haven't done a proper comparison of trading costs, I've closed the commission free broker account and stuck to spread betting, not because it is cheaper - except for short term trades - but because of the tax advantages and the inbuilt currency hedging. I have no idea where the USD: GBP ratio will stand in a year's time and there will be plenty of volatility over a no deal Brexit. One big advantage of the commission free broker is that one can buy tiny holdings to test out theories (which is what you have probably done by the sound of it), whilst in spread betting you may be committed to nominal values of up to £7k a punt which is too much for most learners to risk.
One of the challenges for the UK investor is the relative volatility of US shares - you can buy a 'solid' US company like Quidel (QDEL) with great fundamentals and watch it fall from $300 to $150 and then rise back to $250 just after you've sold it. And you have to watch out for the quarterly earnings. US stocks can fall 30-40% after disappointing figures, or rise by a similar amount on a whiff of good news (this happens 4 times a year, of course, so you need to watch closely what's happening in the weeks leading up to the quarterly results - time consuming if you've got a proper day job!).
My solution to the US volatility problem is to buy US ETFs which seldom fluctuate by more than 1 or 2% a day and have spreads in the region of 0.05-0.1% and a cost of 0.3% a month (at DFB rates) in interest. The math is favourable. If your £10K of ETF goes up just 1% in a month and you sell, the return is £100 minus about £40 in trading costs. No tax. No FX. So clear profit is £60 for minimal risk. Since the margin requirement is 20% for a retail investor, that modest £60 is effectively leveraged 5:1, so the monthly return could be £300 if the investor is fully leveraged (this does entail rather more risk and needs sensible risk management strategy).
Wilkonz. Thanks so much for sharing these ideas, that is def a very interesting way to make US investments by using spread bets.
You also mention about how volatile US shares are. Since I started to invest in US shares, it’s hard not to notice how volatile the share prices are around the time they declare earning. I was quite shocked when I first saw how some of these highly regarded and well performing companies would plunge 20+% around the time of earning being announced. I would search all manner of sites to try and find info for the plunge in share price. Most of the time the company announced profits ahead of the brokers estimate and for the life of me I could not see why the share price had plummeted. I now presume that peoples expectations were not met. Anyway, I now research some companies in advance of earnings, so that on earnings day I can decide whether to buy, as these dips can be an excellent time to invest.
For instance, PayPal, $PYPL, which I never thought of investing in until my earnings day research turned it up. Thinking about it, the company should be a huge beneficiary of the Internet shopping boom.
But around it’s latest earning declaration, which showed payment volume up 38% and earning for the year on target 37-38% increase, the share dropped about 17%. It seemed crazy. Since then the share price has increased 22%.
I have had a few swift rises and a few slow burners that have gradually gone back up to pre-earning reporting levels, but as you mention I am just testing out theories at the moment with small $2-4k buys, which the fee free system and tiny spreads allows one to do.
Couple of interesting companies reporting this week. Fedex are up roughly 128% since July, but should still be smashing it and then there is the busy Christmas period and potential of lockdown in some states when Biden takes over.
Yes, that's an attractive approach. I've never used SB's but as I understand it, you're taking a bet on the USD price of a US stock. So if you close out after two weeks at unchanged stock price you breakeven (apart from financing costs and commissions) even if GBP/USD has moved by 2%.
Currently I use DeGiro for overseas securities through a GBP account. There's no hedging, but every transaction is shown in my statement at both the underlying USD value and is GBP value converted at the prevailing spot rate. So, no FX charges, but this simplifies CGT computations as you have the GBP value for each cash transaction.
Interestingly, a few years ago I took lessons from a successful young Hong Kong trader. He typically traded only on the day before and the day after after earnings, using geared variants of a straddle/strangle option strategy but biased in one direction or the other. This had the benefit of largely capping losses (and profits) but the downside was that implied volatility (a key component of option prices) can fall off a cliff once 'uncertainty' is reduced by the earnings announcement. I often wonder if he eventually blew up! Options trading is of course very popular in the US. Many ways to skin a cat......
Kelvin, Thank you for a very thought provoking piece of work. The question you ask is "How do you measure the effectiveness of your selling strategy?" I think that the short answer is that most of us don't because we find it too difficult. If we were able to do it properly, then I believe we could learn a lot from it. But it would be very time consuming. Here is my general approach to this difficult topic:
1) Carefully develop rules as to when to sell and then stick to them.
2) Closely monitor how much you are gaining / losing overall in terms of £
3) Closely monitor how your overall performance compares to your benchmark index
4) Use the folio tools on here. It's useful to look back on the charts of the shares that you have owned. You can see where you bought & sold on the chart. Some time after the sale we can look back on the chart & think about whether selling was the right thing to do (or not), according to what happened to the share price after selling. This might be a good time to review one's rules for selling. Of course this doesn't get us very far along the road to measuring the effectiveness of our selling strategy. But it is about as far as I can get at the moment.
"The trouble with the "Stock Rank" is that it combines different metrics, some of which have very different probability distributions. This waters down how well the Stock Rank can work."
Not just that but the Stock Rank attempts to order all stocks in a way such that if you _bought_ a portfolio of stocks ranked 80-100, they will probably perform over the next year (not sure what the modeled timespan is) better than the ones ranked 60-79.
It does not answer the question "does history matter"
i.e. intuitively I expect
stocks that were ranked at 80-100 and are now 60-79 to perform less well than
stocks that were ranked at 40-59 and are now 60-79
But have no data to support this.
This is what a rule like "sell when SR < 80" means
The trouble with the "Stock Rank" is that it combines different metrics, some of which have very different probability distributions. This waters down how well the Stock Rank can work.
You might find it helpful to look at Quality Rank, Value Rank and Momentum Rank separately for your analysis. Of these the Momentum Rank is the most "pure" in the sense of combining like-minded metrics together.
On a broader point though, there are two kinds of rules you can work with:
I think of rules which try to outwit the market as "alpha" rules - rules which are exploiting alpha. Rules which work just as well when everyone follows them are "beta" rules - they exploit beta, but in particular "smart beta" or multiple beta - in other words you compute the beta for a range of different factors.
The irony is that alpha rules are the ones everyone wants to talk about on forums!
The difficulty of analysing selling comes from how you repurpose the cash.
For example, I have 5k in cash. I sell stock A and realise 3,500.
I buy stock B for 2,500 and stock C for 3,000.
Stock B is Aim and Stock C is main market.
How much of each subsequent stock selection do I allocate to the no longer held Stock A for back testing , how do I allocate the stumpy duty, ditto dividends?
Good effort on trying to apply some analysis to a very complicated topic. Really though, the only way to be able to do this is to start with fixed position sizes and then fix the “pot” of each position for subsequent purchases. An interesting exercise and well worth discussion.
Maybe I missed something with regards to trading costs and failed to understand. If I get this right you’re saying your trading costs are minimum £1500 on a £100k portfolio. I have an expensive broker, £25 per round trip. I hold around twenty positions. 5k each, so stamp duty is £25. So, £50 per sell/buy is 30 sell/buys per year- you’re rotating your stocks 1.5x minimum possibly as much as three times (to achieve 3% portfolio degradation). Seems like this system barely give stocks any time to achieve gains before they’re out the portfolio.
I simplified the issue by assuming that if I was not invested in a stock, I was invested in an index (FTAS), and comparing all performance to that index.
Not systematic at all, but have noticed that outside a shock (profit warning), momentum (perhaps unsurprisingly) is v. important over a 6-12 m timescale -more than SR.
... and then all too frequently I ignore my own rules.
Yeah I wrote post about using QM and VM ranks - the thing I got stuck on was how/when to rebalance. That seems to be the secret sauce in making those strategies work and I don’t have the time to plot out rank/time and crunch optimum selling points. Of course, further complication is the M component is made of different timescales and you can have two stocks with the same M but vastly different profiles of how that score is calculated.
Your breakdown of the differences in market cap throws another variable in that would need to be taken into consideration.
TL:DR, picking winners is hard!
agree that modelling how you repurpose cash is really difficult. Position size is one big factor, and also the fact that you may buy and sell multiple times over time. When I have the time I will try to create a rigorous way of modelling it, but I need a refresher on statistical analysis. It all reminds me of the Monty Hall problem.
You are right, my dealing costs in 2020 were unusually high - driven by the huge volatility we saw in the first half of the year.
Interestingly, though, my results for this year have been outstanding... +27% year to date compared to an annualised average of 13.7% in the prior 5 years....
It was this that, in part, prompted me to review the sell rules that I had operated in the prior 5 years. I wondered whether I could have done better, or whether the discipline of selling when the "odds" were against me was the right strategy. I still don't really know.
I’m only up 16% ytd, but I am up 23% yoy, I had a really strong Santa rally last year! Still, when I look back, on 20th March I was down 30% ytd, so happy to end the year +16, esp as the Stocko benchmark is down 11.6.
Very strange year indeed.
Nice write up Kevin - this remains the true dark art of investing/trading!
I track the movement of closed trades, partly because I may want to get back in but also to get a feel for the effectiveness of my selling. I think investors are more likely to berate themselves for selling "early" than congratulate themselves for avoiding a loss/losing profit by selling "late" - all while completely ignoring the return they made on the replacement investment in comparison.
I buy on fundamentals and momentum/TA (both must pass my tests) but I am willing to sell on just one of those deteriorating - and it's normally the latter that moves the quickest so I'll tell you my method for that. My momentum indicator is made up of 7 elements (each worth 15 "points" other than PE vs Ind which is worth 10) which make up a total score of 0-100, 100 being good:
Momentum Screens: 2 or more screens passed
10d/3m Volume %: must be greater than 0
Relative Strength 3m: must be greater than 0
Momentum Rank: must be >60
Price vs 200MA: must be greater than 0
vs Industry Momentum*: rank must be better than the average for the stock's industry
PE vs Industry*: must be greater than 80%
(*The last two are not Stockopedia metrics, I calculate this manually in excel using the industry data from Stocko)
If my proprietary scoring drops below 50, it goes on a "sell watchlist" - from then on it's about watching the chart, the same way I'd add a potential buy to a watchlist and monitor closely for signals (Weinstein based).
If I sell but the fundamentals are still good, it stays on my buy watchlist and I might get in again once my momentum score is >85 again.
This is probably far from perfect but it gives me comfort and structure! My portfolio does chop and change and I probably incur higher than average trading costs but it keeps me on my toes and means my portfolio is more often than not reflective of the prevailing medium term trend so I don't suffer large drawdowns. A price worth paying in my view.
Matt
Interesting. I think the last line "it gives me comfort and structure!" is probably the most important. Even in the absence of a backtested system, I think the more you are able to use a system the less likely you are to sell for emotional reasons.
Thanks Kelvin Prescott. A very worthwhile and disciplined study of the perpetually vexing question about when to sell. I am trying to work out my own set of rules which go something like this.
1. Only buy mega caps, Investment Trusts or ETFs (i.e. low risk).
2. Minimise transaction costs, FX and taxes by using a spread betting account and buying only securities with a spread of 0.05-0.5%
3. Buy when stocks bounce off the 20 day EMA (or other TA buy signal)
4. Sell after a price surge when the price is well above the 20 day EMA by using a tight stop loss set 2-3% under the price.
5. Buy back next time the stock bounces off the 20 day EMA.
6. When the spreads are around 0.1%, I sell when the profit is 10% and buy back immediately as the transaction costs are minimal (<1%)
I've been doing this since 1st October. My trading costs are about 3% of my profits. Mean holding time is 29 days. I have not back tested yet, but my impression is that this is going to be more profitable than buy-and-hold strategy in a conventional ISA. However, this strategy has not yet been tested in a bear market, so I am not recommending it. It might turn out to be a total disaster! It's all part of the learning process.
thanks for the response Wilkonz. I hadn't realised the implications of trading via spreadbetting on transaction costs. Something to look into...
The costs on spreadbetting big US stocks are often pretty minimal: if you want to buy 20,000 worth of an Apple or MSFT, you can often do so for a spread of £20 and no other costs. It’s quite eye opening, doing the same with a UK company would often be many multiples of that. Mind, that’s because the US has hundreds of stocks worth over 100bn, whereas the UK has about 3!
One thing to remember with spread betting is that there is a daily interest charge for keeping a bet open. If you buy on a DFB (daily funded basis) the annual interest cost work out at around 2.5% of the nominal value of your holding (i.e. what your holding would be worth if you bought it in a conventional portfolio). This can be reduced to around 1-1.5% by funding the bet over 9 months. If you're a 'buy and holder' it makes sense to pay for a larger spread. If you're short term trader (say up to 90 days holding period) it's more cost effective to go for a DFB option. As Donald Pond points out, a quick 5% on £10K of Apple or Microsoft gives you £500 profit for a trading cost of £10-20. (Compare that with the £225 it would cost you in commission and FX on the HL platform.)