Do operating margins matter to SuperStock performance?

When I wrote about Three small cap SuperStocks worthy of further research last year, a subscriber, sevenccc, responded by saying:
…there is one big but for all 3 from my perspective. Low Operating Margins. Does this not concern you? To me this largely invalidates the Quality scores, which are all 80+. Is that unfair?
This thoughtful comment has stayed with me. Are low operating margins a sign of a poor business to be ignored, or is that already in the price and then some? The good news is I’ve now been able to test this empirically.
Operating Margin
Before I go into the details, here is a reminder of what the operating margin is:
Operating Margin = Operating Profit / Revenue = (Revenue – Operating Costs) / Revenue
The operating profit excludes taxes and interest payments and allows investors to compare businesses regardless of how they are financed or conduct their tax affairs. A business with a low operating margin has a minimal difference between the revenue it generates and the costs of those sales. A low-margin business works very hard to eke out a small profit. It is likely to operate in highly competitive industries. Typical low-margin businesses include distributors, such as NWF (LON:NWF) , or contractors, such as Balfour Beatty (LON:BBY) . It is often said that contracting businesses are always one onerous contract away from insolvency. While this may be an exaggeration, the low operating margins mean that any slip-up can have a big impact on the profitability of such companies.
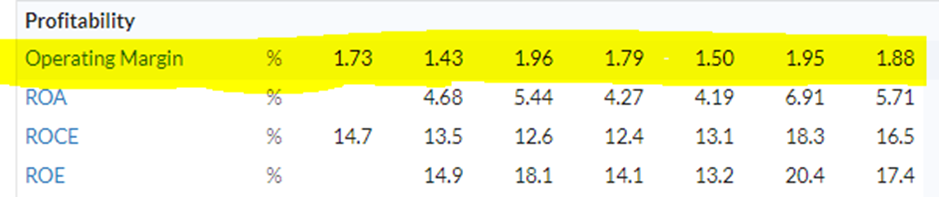
The operating margin figure can be found on the StockReport here:
And graphically, like this:
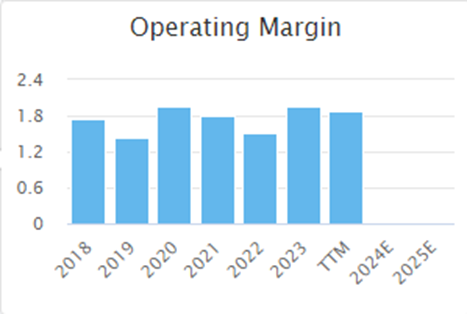
In this example, which is from the StockReport from NWF (LON:NWF) , the operating margin is never above 2%, reflecting their fuel and feed distribution operations.
On the surface, it makes sense to avoid these types of businesses. However, investing is one of the fields that confounds conventional thinking. The reason for this is that every investment opportunity doesn’t just consist of what an investor buys into but also what they pay for it. This is at the heart of the Value Investing anomaly – where cheaply-rated stocks have outperformed highly-rated ones over the long term. Everyone wants to own well-managed companies with great products in exciting, growing industries, and no one wants to own poorly managed companies with poor products in declining industries. However, because of this, the great companies tend to be bid up until they are overvalued, and the bad companies sold off until they are undervalued. Investors who can stomach it are better off being contrarian and buying into the bad companies, on average.
The Data
So, what about operating margins? The data heads at Stockopedia provided me with the list of SuperStocks at the end of March for each year of the last decade, together with their operating margins at the time, and their subsequent one-year returns. I then sorted the stocks into quartiles based on their operating margins, from highest to lowest. After a bit of data cleaning, I ended up with about 40 stocks in each bucket and compared the average returns for each group. Here are the results:
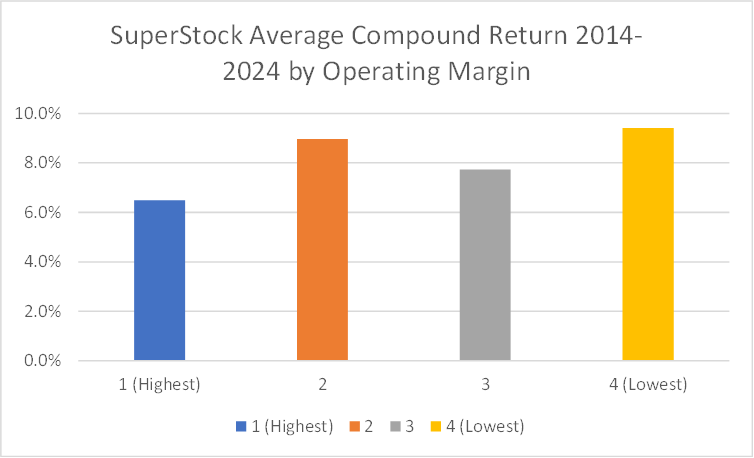
These results may surprise some investors. Rather than being the laggard, the lowest operating margin stocks ended up with the highest average return, and the highest operating margin stocks were the ones to avoid. It is worth noting that this was a period of weak performance for the FTSE All Share, which only generated around 5% compound annual price return over the same period, so all of these figures represent outperformance.
One challenge can be that these sorts of analyses can be prone to being impacted by one or two good years, so it is worth considering the full performance over time:
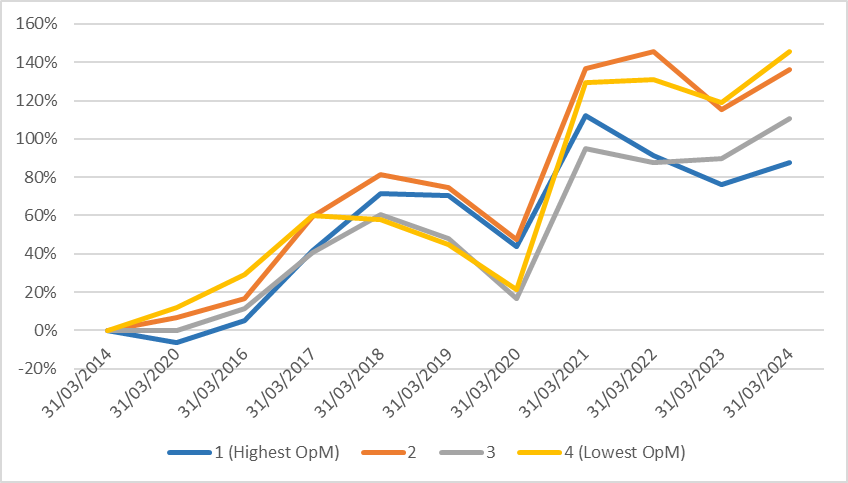
I don’t have data for portfolio performances in the intervening time, so calculating Sharpe ratios or similar is impossible. Instead, these results are for holding the quartile of SuperStocks based on their operating margin for one year and rebalancing into the same quartile next year. Importantly, these ignore costs and are not indicative of the net returns an investor would have generated.
Looking at the performance over time, I see that the underperformance of the highest operating margin quartile is almost entirely post-COVID. This means I would need longer-term data to conclude that high-operating-margin SuperStocks will always underperform. However, it is clear that investors should not ignore a SuperStock simply because it has low operating margins.
Gross Margin
Many investors, including myself, like to use gross margin as an indicator of business quality. Here is how that is calculated:
Gross Margin = Gross Profit / Revenue = (Revenue – Cost of Goods Sold) / Revenue
The rationale is that companies with a high gross margin sell a product for much more than it costs to make. If they can maintain this gross margin over time, they will likely have a competitive advantage that others find hard to replicate. Take Bioventix (LON:BVXP) , for example, with a gross margin of over 90%. Their knowledge and patent protection mean they can sell their monoclonal antibodies for far more than it costs to manufacture them. One complication is that companies can vary in how they allocate some costs, and some companies may not report gross profit at all, thinking this reveals too much to customers or competitors. The principle is sound, though – companies with consistently high gross margins will likely possess a moat.
The gross margin isn’t immediately visible on the StockReport but can easily be calculated from the income statement data:
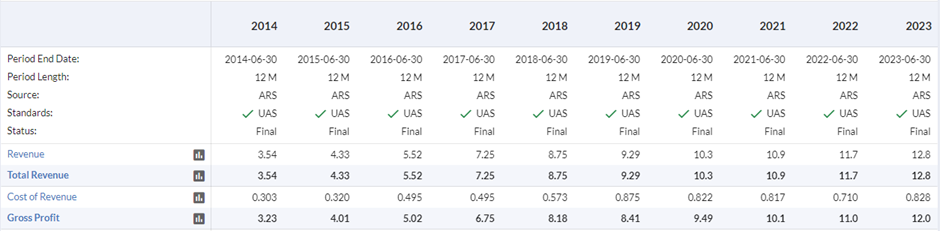
So, if operating margins don’t allow investors to narrow down the field of SuperStocks into the best companies to invest in, perhaps gross margins will do the trick.
The Data
Thankfully, the database team also gave me the gross margin data. Following the same analytical methodology of sorting in quartiles, but this time based on gross margin, I get the following results:
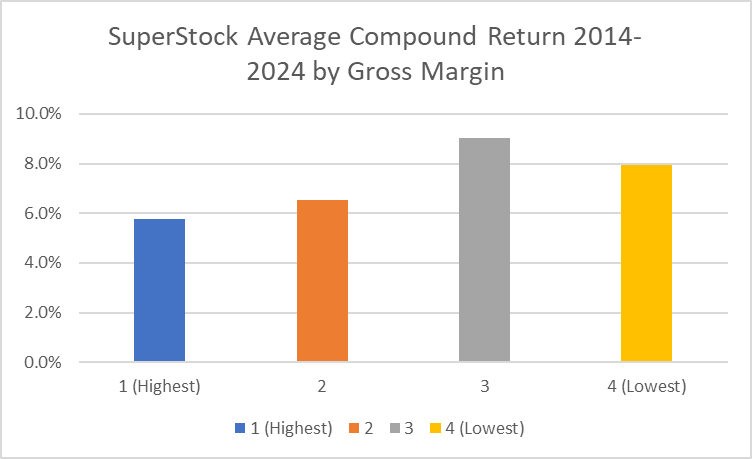
With gross margin, the lowest quartile was not the best performer, but the highest was still the worst.
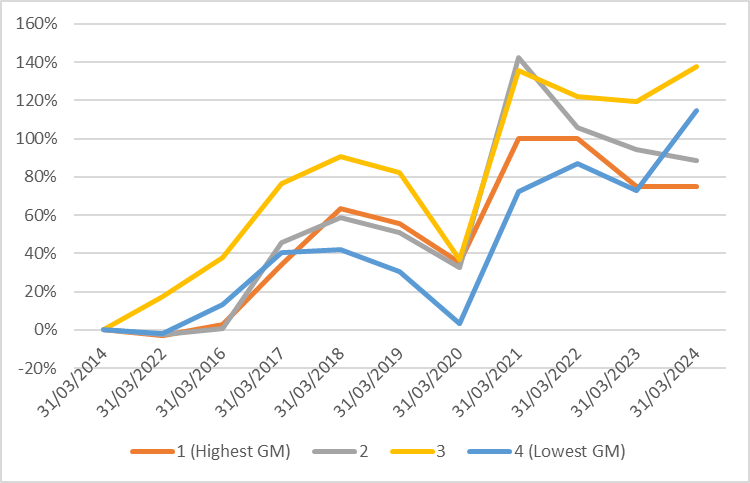
Again, the path of outperformance is variable, but the difference in performance is significant. By consistently favouring low-margin businesses, investors would have around 40% higher returns for the decade. Again, this excludes costs and follows a specific rebalancing methodology, but there is no evidence that SuperStock investors should favour high gross margin stocks.
One possibility is that the very high-margin stocks are not trading companies, such as funds or REITs, and these are confusing the calculation. However, the distribution of gross margin between the quartiles looks as one would expect:

Other factors are likely at play here, such as investors’ preference for high-gross-margin stocks bidding these up to higher valuations. Given the whole picture, investors may actually want to avoid the highest-margin SuperStocks:
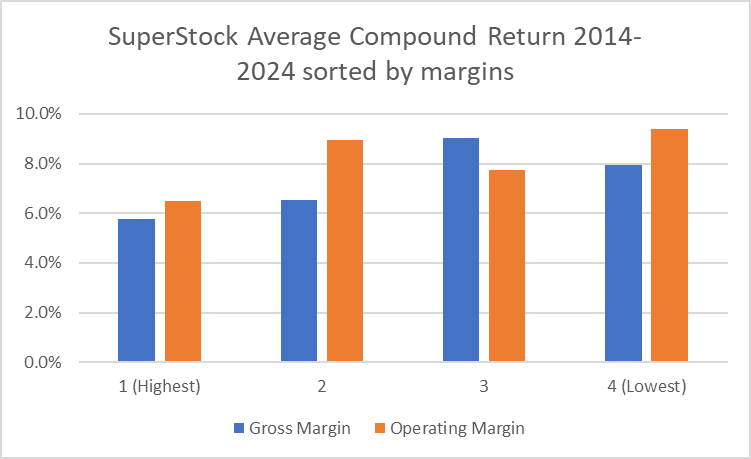
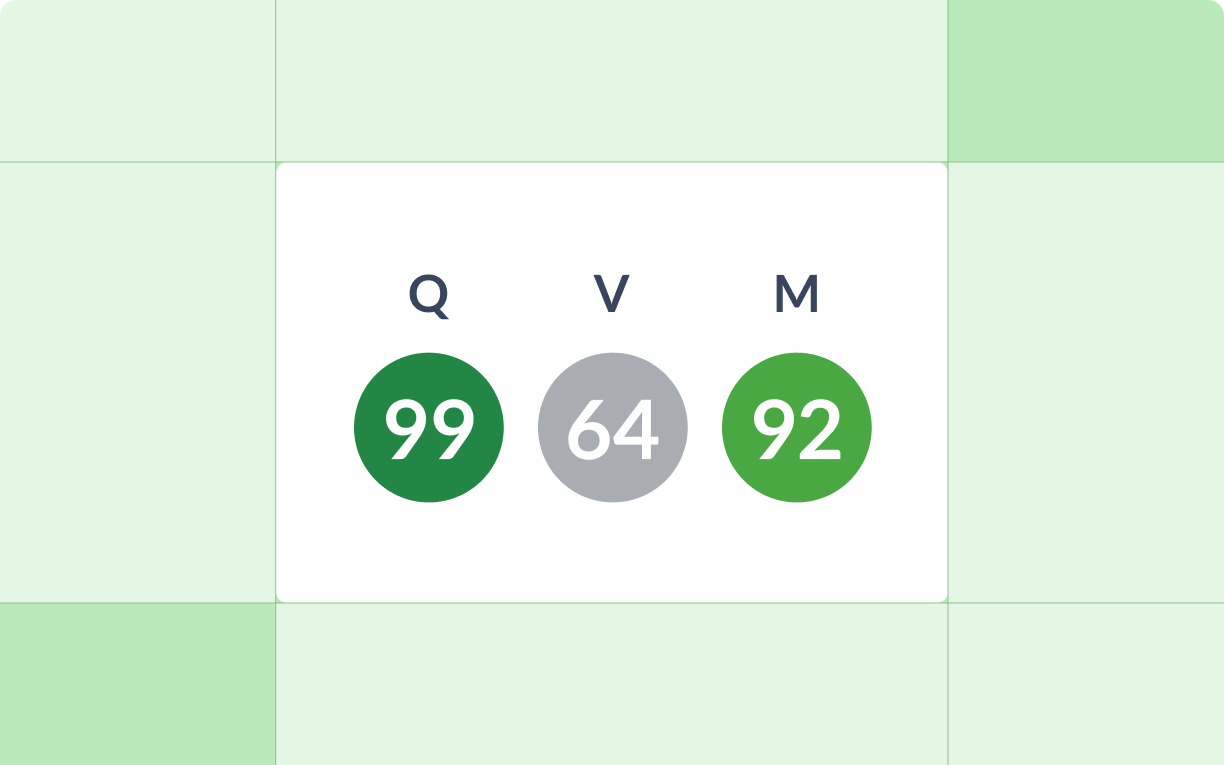
Of course, this result may not hold for non-SuperStocks, where paying greater attention to margins may be useful. However, focusing on cheap, high-quality stocks with good momentum and ignoring the margins is a much easier way to outperform the market. The Stockopedia QVM framework helps investors to do exactly that.
Disclaimer
This is not financial advice. Our content is intended to be used and must be used for information and education purposes only. Please read our disclaimer and terms and conditions to understand our obligations.
20 comments
Useful analysis Mark - thanks for posting - gross/operating margins vary enormously by sector (i think you alluded to this being a complicating factor in your comments) - so unfortunately there are very heavy sector bias effects on the analysis. If so if you have the sector classification data for the returns data you might want to try sector adjusting so that the each of the top quartile bucket contains stocks in the top quartile for margins vs other stocks in the same sector etc. Best, Steve
Margins and profits are calculated in relation to revenue whilst share price is a function of MarCap. Therefore any examination of margins or profits must take into account the relationship between MarCap and Revenue.
I'm curious as to why Gross Margin is not included in the Stockreport. To me it's one of the first items that I like to look at to understand the business. Could it be added above the Operating Margin line?
Yes, Yes and Thrice Yes!
Good analysis Mark, and has challenged my thinking.
Stocko team - I'm curious as to why Gross Margin is not included in the Stockreport. To me it's one of the first items that I like to look at to understand the business. Could it be added above the Operating Margin line? Thanks
Agreed. I have made a request for this feature to be added to the Stock Reports.
I'm curious as to why Gross Margin is not included in the Stockreport. To me it's one of the first items that I like to look at to understand the business.
One of the many ways in which Sharepad is superior to Stocko in its presentation of the data.
Wow Mark. Hadn't meant to send you off into analysis overdrive with my initial comment. Interesting results within Super stocks. Without encouraging you to broaden your research I wonder whether my thinking is more applicable across the market rather than in this category. Perhaps I have just become more risk averse after suffering through Dotcom crash, GFC and more recently COVID and Russia induced energy price shock.
Reading Richer, Wiser, Happier in snatches at the moment only reinforces risk aversion! Reviewing my own portfolio currently and putting holdings into similar 'buckets' is helping me structure my thinking and finesse watchlists. Might also help me develop a selling strategy!Broadly pf is in 3 buckets with a few 'punts' on top.
1 - Income based for long term hold: Mainly REITS yielding 6-9% eg Supermarket Income REIT (LON:SUPR) Tritax EuroBox (LON:EBOX) Legal & General (LON:LGEN)
2 - Balanced (depends on your perspective): c5% yield with reasonable PE and growth prospects BlackRock World Mining Trust (LON:BRWM) Eurocell (LON:ECEL) Taylor Wimpey (LON:TW.)
3 - Growth focused: Low or no divi, generally higher PEs eg Volex (LON:VLX) Zotefoams (LON:ZTF) On Beach group (LON:OTB)
On Stocko categories all green bar 5 neutral (all REITS) and 2 red Sucker stocks, which fortunately are in my punts, out of 28 holdings. Now I need to go back through and look at the margins - and reduce my bias if the rest of the rationale stacks up. Thanks for prompting this reappraisal.
No problem. It was a great original question, one I didn't know the answer to definitively, and one that intrigued me.
I agree that margins may be useful across a wider set of stocks. For example, it may help investors screen out persistently loss-making businesses. But it seems that when it comes investing in businesses that already pass some basic quality, value and momentum checks, investors will generate higher returns (at least over the next year) by investing in low-margin businesses rather than high.
The result surprises me a little, I was expecting no clear winner, so that the fact that high-margin SuperStocks appear to be poor performers is a bit of a shock. There may well be other trade offs that we don't see, such as the being higher risk in crises, as you say. However, in terms fo raw performance, low-margin appears to be the place to be!
There is a lot of food for thought in this article Mark and I say that as someone who has a known bias for high operating margins. One small point of correction, Bioventix (LON:BVXP) don’t have any patents on their antibodies on the basis that once they have been adopted they are unlikely to be switched (and this has been shown to be true over the years).
Interesting, Mark. Thank you. Food for thought.
Realise this is probably off topic to the core thrust of your article but you say in here “Investors who can stomach it are better off being contrarian and buying into the bad companies, on average.” I certainly feel in recent weeks there’s been more momentum with lesser quality companies, but over the longer term what evidence would you reference to support your assertion?
That's the crux of the Value Investing anomoly - cheap beats expensive over time - there are probably more academic finance papers written about this effect than any other topic. In recent years this has weakened for US equities, but is relatively persistent across other spheres of investing such as investors are better off in low-GDP-growth countries vs high-GDP-growth companies. This suggests the effect is behavioral and to do with how investors price assets rather than a risk factor to me, but of course, this is one of the biggest debates in academic finance.
I wonder to what extent variability of operating margins is impacting results. A highly cyclical business might have great operating margins at the top of the cycle, just in time to send investors into the tank. Contrast this with a company that has stable margins, where the results might be different.
Yes, I suspect that if you look for businesses with *consistently high* operating margings you will get a totally different answer. I am extremely suspicious of any conclusions drawn from statistics. Almost anything can be proven with the wrong statistics. The devil is in the detail. The article is interesting nevertheless.
Interesting article.
Some businesses have low margin, but high stock turnover, whilst other businesses are the other way around. High margins imply better quality, but it's not necessarily the case that this type has better growth prospects.
Looking at a long term average ROCE might be a better guide, perhaps, although I don't think it's a panacea either.
I think better to have rising operating margins, such as Warpaint London (LON:W7L) and Kitwave (LON:KITW) or ones where it jumps up like Good Energy (LON:GOOD) and Yu (LON:YU). The share price will usually increase as well.
Some sectors have low margins, construction, example Costain (LON:COST) and Kier (LON:KIE), also food example Hilton Food (LON:HFG).
Some low margin stocks, have had a pretty chequered past and some have gone bankrupt.
Great analysis thanks Mark. I assume that a low operating margin company selling products at high volume nonetheless generates large revenues and sizeable profits - perhaps this is also an factor that explains the lack of correlation between operating margin and share price performance?
It would have probably picked up Yu (LON:YU.) in 2023, since then the share price has trebled. Op. Margin in 2023 was 2.13 then it jumped to 8. 28
Are you using around 40 stocks per year or 160? Because there are only 149 Super Stocks at the moment.
It varies from year to year. 160 is an approximate number for the total number of UK SuperStocks each year with the right data to make the analysis, so each quartile is approximately 40 stocks but it does vary.
Certainly a low operating margin growing will likely deliver great returns if you can predict this happening.
Mark, thanks. Just thought it would be difficult to find 40 in each band. One stock is not likely to affect the results that much then.
Very thought provoking Mark, and something I have been wondering about. I see some low margin companies that seem to produce consistent and growing profits, and in a sense I believe that their ‘moat’ is their ability to eke out a small but consistent profit within their niche, which usually comes from deep operating experience and reputation, both of which can be hard to replicate.
I would be interested to vary the rebalancing criteria and look at average price range during each period. I suspect that higher margin stocks may show more price volatility as growth prospects and market perceptions of those prospects will likely have higher impact on price. In other words while point to point price performance may tend to the low side I wonder if there are wider price swings (and therefore opportunities) during the period.