Does the change in StockRank matter to SuperStock performance?

When I wrote an article looking at when to sell SuperStocks, I controversially suggested that investors may want to ignore SuperStocks that have remained SuperStocks for an extended period. Rather than being undervalued stocks that are ripe for a re-rating, they are instead likely to have features that the algorithms like but investors won’t. This led to an interesting debate in the comments as to whether stocks that have risen recently to become SuperStocks should be favoured over those that have been SuperStocks for some time. I now have the data to investigate this hypothesis further.
The data-heads at Stockopedia have given me the list of all SuperStocks for each year, plus their subsequent 1-year price return. Due to a quirk in how the database is structured, the team have only been able to provide me with the StockRank 1 year and six months prior for SuperStocks in 2016, 2017, 2021, 2022, and 2023. (StockRanks tend to change relatively slowly and the changes are often driven by results, hence choosing the StockRank change over one year, and six months, for this study.) Despite the limited number of years of data, I have been able to draw some meaningful conclusions. But first, let me answer another question that has been bugging me for a while:
Are all SuperStocks created equal?
It can be tempting to think that a stock with a StockRank of 99 is better than one with a StockRank of 90, but is that true? Here is the average subsequent 1-year return of each SuperStock on the same date in each year from 2014-2023, by rounded down StockRank:

[Note that these are price-only compound returns without dividends. When I do the straight average, I get a bigger variation, but when I calculate the compound return, which more accurately reflects the returns an investor may get, it is largely removed.]
So it seems bigger is indeed better when it comes to StockRank, but the difference is very slight, at perhaps around 0.4% between the highest and lowest SuperStocks in annual return. On top of this, the relationship here is very noisy. I’m not sure there is any reason, other than pure chance, why the 94th percentile StockRank should perform so badly and the 93rd so well. Even owning just the 99th Percentile StockRank stocks isn’t a guarantee of success every year. This was the best-performing bucket in 2016 and 2017, but the worst in 2019 and 2021. In reality, there seems to be little reason to favour the highest-ranked SuperStocks. Other stock-picking tools will likely make a more significant difference than a few points on the StockRank.
Does the change in StockRank matter?
One of the most straightforward ways to look at this is to see if there is any correlation between the change in StockRank and the subsequent 1-year price change. Here is the plot for the 1-year change in StockRank:
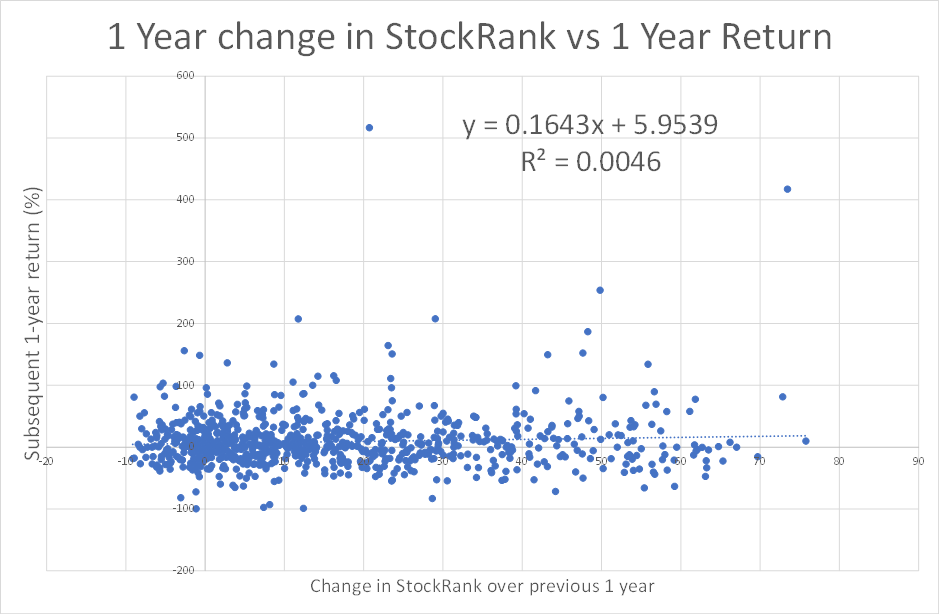
Note that these are SuperStocks only, so the maximum the StockRank can have fallen over the previous year is 10, or they wouldn’t still be SuperStocks. The relationship here is slightly positive, but the data is noisy, and it is hard to draw definite conclusions. Here is the same plot for the six-month change in StockRank:
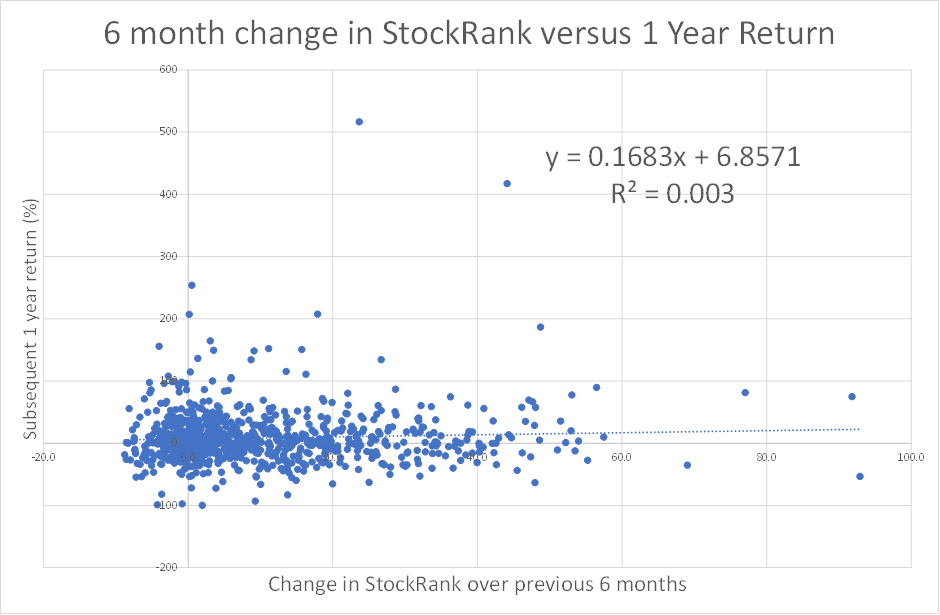
Again, it is hard to conclude that StockRank change matters from this data, even though the relationship is mildly positive.
A different approach
Instead of looking at the whole data set, I bucketed stocks by the rise in StockRank they experienced in the previous year. I then calculated the average performance of the SuperStocks that met that criterion for change in StockRank and compared it to the average of the SuperStocks that didn't meet that criterion. Here, the results are quite encouraging:
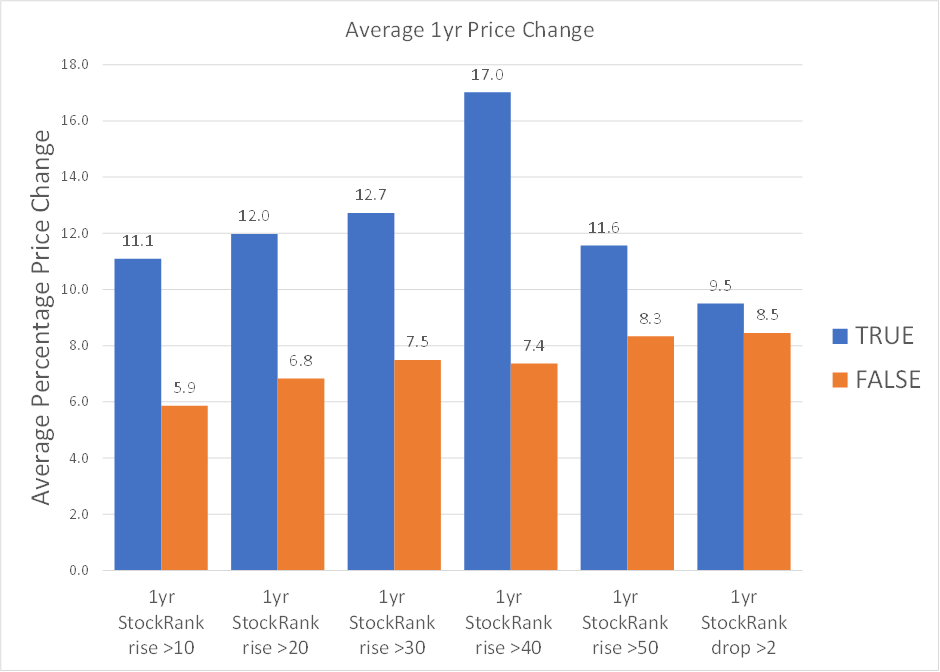
Stocks that had become SuperStocks over the past year (i.e. had a rise of at least 10) trounced those that were always SuperStocks, with a 5.2% return spread. It seems that the results get better the bigger the increase. However, the number of stocks that have significant rises is much fewer, so we should rely much less on the absolute return numbers here.
[Just for clarity, it is worth noting that these are not unique sets. Stocks whose StockRank rose by greater than 50 in the past year also rose by more than 40, 30, 20, and 10. Because of the different numbers of stocks that meet these criteria, the straight average return of each TRUE/FALSE bucket does not add up to the same figure.]
The performance of the 40+ StockRank Rise bucket is even more pronounced when the rise happens over six months:
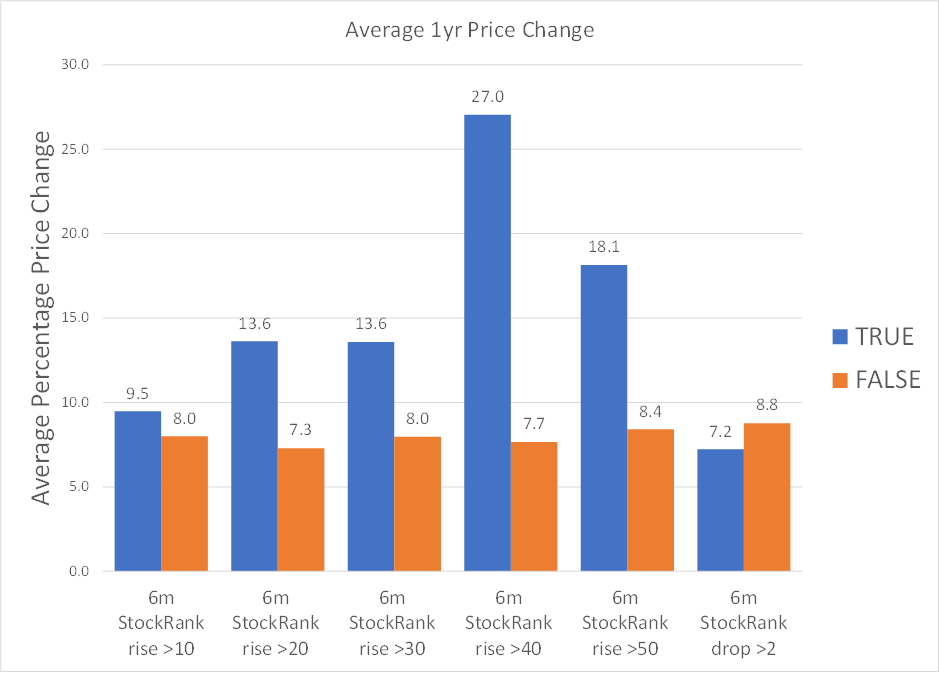
However, the difference between the stocks that became SuperStocks over six months and those that were already SuperStocks is less pronounced.
Interestingly, in both cases, a small drop in StockRank didn’t appear to impact potential returns significantly. It is possible that more significant drops, where stocks stop being SuperStocks, will impact returns, but we need a different data set to answer this question.
This data suggests that the average SuperStock that recently gained at least 40 StockRank points will generate phenomenal returns. Breaking this down further, it seems that it is the six-month change in StockRank that has the largest impact:
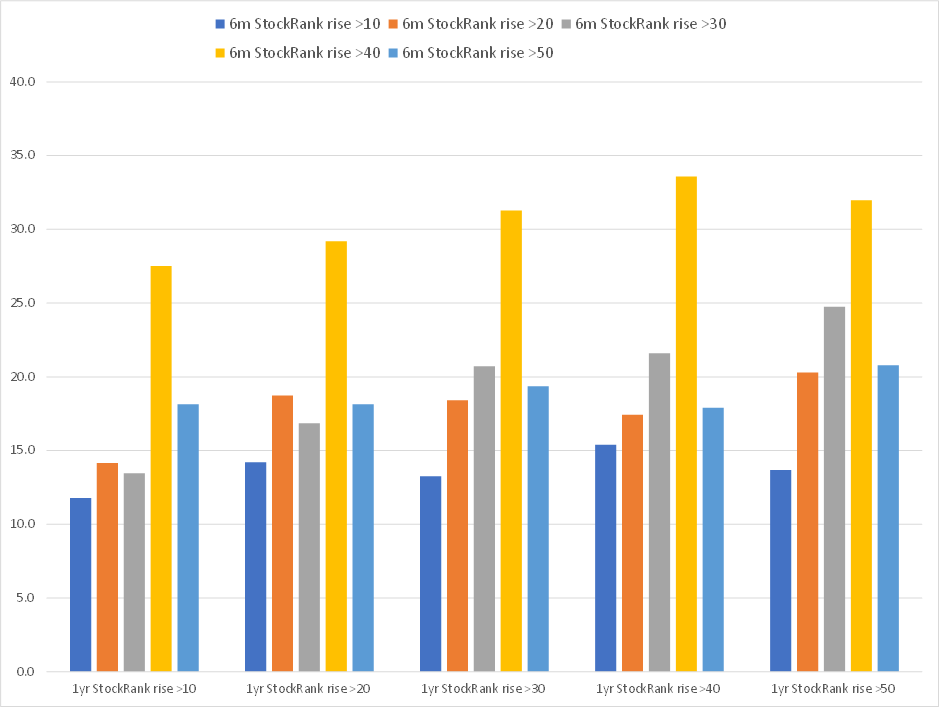
This is highly promising, but before I get carried away, it is worth looking at where those great returns come from.
Caveats
The StockRank is relatively slow to change, and many of the metrics that go into the calculation are only updated by published financial results. This means that the number of stocks that have large StockRank gains is quite limited:
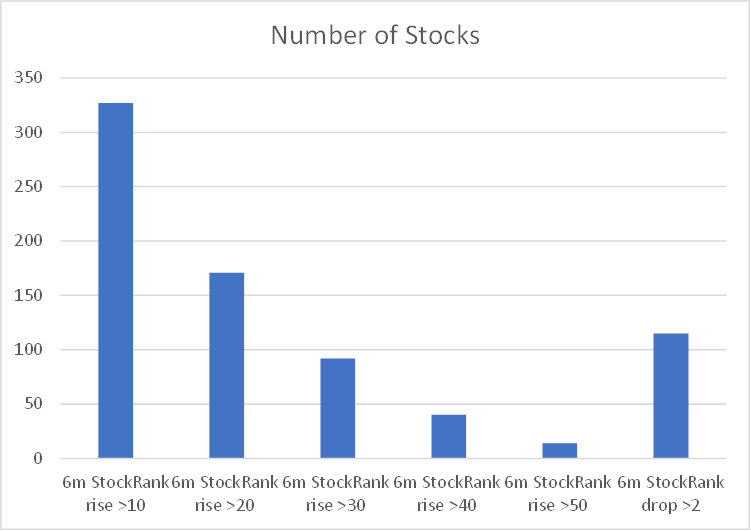
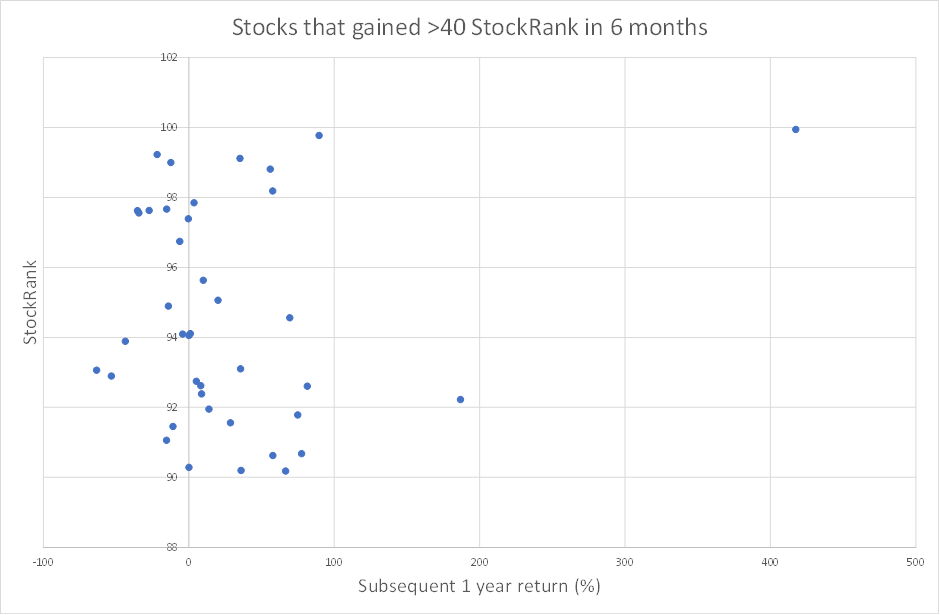
With just 40 stocks, the results are dependent on a few big winners:
And overall, the winning percentage is only just above 50%:
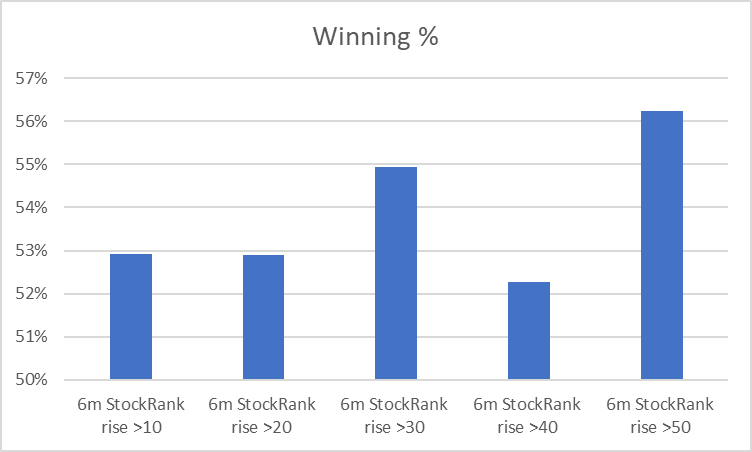
The great returns come from a few stocks generating great returns, and the losers not losing too much. This is exactly what we expect from stock market returns, but it highlights that if an investor misses out on the high-return stocks, the results may be materially worse.
The final caveat is that the results I am giving are absolute returns and may vary depending on wider market conditions.
Despite the caution required, the overall finding is that stocks that have risen in ranking to become SuperStocks outperform those already there, which seems relatively robust.
Returns over time
While I have data for the subsequent 1-year returns of all the SuperStocks from the Stockopedia database, I don’t have any intervening price data. So, I have turned to Google Finance. Here, there is no data for stocks that have been delisted, and the exact returns may vary for that reason. However, it gives a feel for the shape of the returns to these strategies. Here is the best performing greater than 40 point gain in six months, over the following two years:
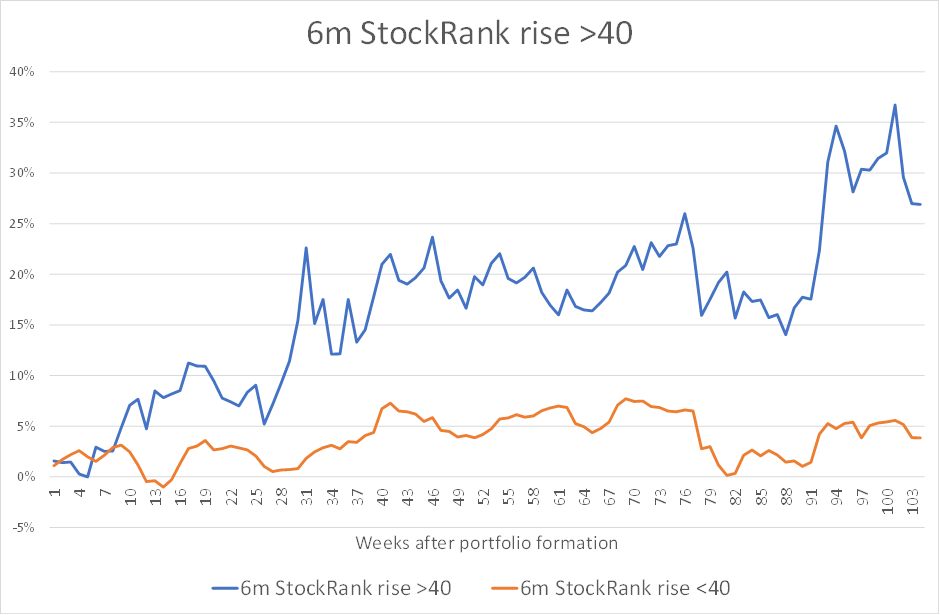
Again, this highlights the volatility of the average returns and how they may not be fully representative of the future. However, what perhaps stands out most is the lack of price return generated by the rest of the SuperStocks. This is perhaps another challenge for the idea that one can pick just a few SuperStocks at random and always get great results with a long-term hold. This is a strategy that requires both a diversified portfolio and yearly rebalancing.
Conclusion
It appears that when investing in SuperStocks, the recent change in StockRank may be as important as the overall StockRank. In this study, stocks that had gained at least 40 points of StockRank in the last six months generated a phenomenal return, almost 20% higher than those that didn’t. However, the low numbers of stocks in this category and the reliance on just a few very strong performers suggest this will not be repeatable in the future.
However, the finding that new SuperStocks over the last year beat existing SuperStocks by approximately 5% seems more robust, given the almost 450 individual stock data points in the study for this category. It is certainly possible that investors would also do well by focusing on stocks that have gained 20 StockRank points over the last six months.
Unfortunately, it is not currently possible to screen for the change in StockRank. However, given these results, I imagine this will be a popular request for future site enhancement.
Disclaimer
This is not financial advice. Our content is intended to be used and must be used for information and education purposes only. Please read our disclaimer and terms and conditions to understand our obligations.
15 comments
I find it interesting also that the winning percentages seem smaller than those for example for 90+ stock ranked stocks at approx. 67%. I have a variation on a NAPS portfolio which I will admit has taken me a little while to iterate towards but I am slightly ahead of the 67% mark with a 25 stock portfolio based on a mix of NAPS style choices + a few high dividend plays which keep the money coming in so I can reinforce the portfolio. Whether its doing well because of the market generally or because I've managed more by luck than good judgement to pick some decent stocks I don't know. I've only recently started so still have a heck of a lot to learn. I still struggle with momentum stocks (buying at high prices when momentum seems strong has cost me every time)/when to take profits but I find all of these articles and the daily small caps very rewarding. Some of the omissions on the Stockopedia data you can put into a downloadable data set are quite frustrating such as the momentum direction arrows which can clearly be generated but not added to a portfolio dataset.
Not sure where the 67% comes from, can you share more details?
In the data I've been given, taking the list of 90+ StockRank UK stocks at the end of March for every year 2014-2023 gives 1759 stocks, of which 922 are winners, 780 are losers, and 57 show no price change - presumably because they trade very little. This works out to be a 52% win rate for the whole set by my calculations.
Interesting analysis and many many thanks for your efforts. Got a question though, is this not just mirroring the idea that momentum investing has the biggest effect on stocks. Stocks which have high stock rank changes must surely have exhibited very positive momentum changes as well?? Is there some correlation between the two that would allow one to screen more easily for the stock rank change via momentum trends/changes.
The momentum factor is a mix of price rises in the last 6 and 12 months and increases in earnings forecasts from analysts. These forecasts are usually only available for large cap firms and they tend to be revised close to the release of accounts, so they are less useful or forward looking than they might appear.
So the momentum factor represents share price rises for most firms. But price rises depress the value factor because this is composed of a number of fundamentals like earnings divided by price. The quality factor is high profitability, low risk and the Piotroski F score which is profitability, leverage and a positive change in these in the last year.
This means that an increase in the QVM score is a strange animal. Broadly it could be described as fundamentals increasing more than the increase in share price. Which suggest that price will catch up, as Mark's analysis indicates.
As you say, this is not a clear signal. I would suggest that the best indicator is a rise in the QV score. Or alternatively a rise in the QV score which has been noticed by the market as indicated by a rise in share price in the last month.
It is certainly possible. Although without further data impossible to say for certain. There are certainly challenges with Momentum and most Momentum funds fail to generate the theoretical outperformance that academic studies suggest they should.
We picked 6m and 1yr change in StockRank because that means that the fundamentals will have changed due to at least one set of published accounts and then the subsequent 1yr return means that the return will it be entirely due to Momentum traders or speculative rises.
Lots of potential follow up studies could add further clarity or robustness to this finding. I will certainly be trying to get the data that will enable some of these questions to be answered.
For those who haven't spotted this useful detail of the StockReports, the PRINT button (top right, just below the ranks) gives a drop-down list of earlier Stockreports on the same share, so it's easy to find a date around 6 or 12 months earlier and to look at that report to see the earlier ranks.
Thanks, that very useful. A weekly archive of past reports.
Mark, thanks for a very interesting article, it must have been quite time consuming so it's very much appreciated. I do consider an upward trend in stock rank important when considering stocks. When one opens a folio and hovers the cursor over the stocks name a pop up appears which amongst other info gives a graph of price movement, I think it would be useful if below the graph the same green bullish strip could be included which is available on the stock report. This would save opening a new tab each time. As the info is already on the stock report hopefully it wouldn't be too difficult to implement. I know it would be useful to me and hopefully others would find it useful as well.
I have often tried to find stocks with fresh momentum, but find it quite tricky and normally arrive rather late to the party, so any ideas are always welcome.
Great article. I don't suppose you tried this using pure momentum rank?
Exactly what I was thinking.
Thanks, an enormous amount of work here. I do research in finance so i know how long this takes!
I originally asked about this because i had bought Oceans Wilsons three times in the last ten years due to its very high rank and each time had poor results. Which seemed to confirm the efficient market idea that i battle with at work. Some stocks are low price (have high value and quality metrics) because they are perceived to be high risk. An argument that is impossible to refute because we do not know what the mass of people perceive at any point in time. And the fact that they later on show that they are not high risk does not disprove the theory.
The alternative argument which Stocko espouces is that low prices are produced by investor mistakes. The fact that some high rank stocks do well and some poorly indicates there is truth to both viewpoints.
It seems to me that those that are high rank for long periods of time are just not liked by the market, perhaps because as the efficient market guys argue they are high risk. But those that recently became low price and hence high stock rank may just be suffering from a temporary decline which will rebound. Essentially we are separating out fresh value/ quality from stale value/ quality. The work by Mark Simpson above seems to confirm this.
I agree with Mark's conclusion, recent rank risers RRR give a very substantial additional boost to returns of more than 5%. Secondly those with a very large rank rise give an even better return but are few in number, which makes them much more volatile and difficult to trade.
The momentum factor is a confounding factor here because it moves in the opposite direction to value and so a rise in the M factor creates a fall in the V factor. I suspect that the results above would be stronger if it was just conducted on the VQ value quality risers. Enabling an investor to get in on the act earlier. As Mark points out, most of the boost from the recent rank risers RRR fizzles out after 6 months.
Again thanks for the huge amount of work in doing this very interesting article.
Mark,
Are you able to get the current list of companies that have increased their Stockrank over the last six months from Stockopedia? I keep my own database of historic Stockranks and from my sample I can find very few that meet the criteria.
This is the list I have for the biggest gainers with a Stockrank gain of 40 or more and a current Stockrank >= 90:
And this is the list gaining 20 or more:
Mark
Another thought provoking article. Your findings chime with Fresh Momentum whereby the Momentum stocks that do best are the stocks with poor momentum in their previous year to the year in which they gain momentum.
Of course big improvement “Fresh” Superstocks have a momentum element, and are likely to have improving fundamentals (such as a significantly improved F-Score) and are probably still relatively good value too.
Investors are often slow to notice such improvements so these shares take a while to re-rate, hence a significant gain over the next 12 months.
I recently invested in Brand Architekts (LON:BAR) because the stock rank had risen ~40 points in the past 6 months and was now a Super Stock.
Brand Architekts (LON:BAR) short term downside is limited by the cash balance covering most of the market cap, is getting rid of the poorest performing brands and still has feet in big, quality, worldwide retailers, so wouldn't need sales to pick up much for big gains in profit.
Would be interested to hear about other stocks that had risen 40+ points in the past 6 months into Super Stocks, as that is clearly where this research indicates the best results are found.
Mark. Thank you for a very interesting and detailed piece of work. I will give some thought to how I can use it.