Episode #1 - Tutorial in Technical Analysis by Alan Hull

Alan Hull is a renowned technical analyst within the Australian Market. He has educated thousands of investors on how to apply technical analysis within their overall strategy. In this special monthly series, Alan has agreed to share his Technical Analysis tutorials with Stockopedia members. To learn more about Alan you can read his profile here. Or visit his website alanhull.com.au
Introduction to charts
Technical analysis or charting can be split into 2 schools. The oldest form of analysis is pattern recognition which is based upon human behaviour and history repeating itself. The newer school of charting is based upon probability and statistics. With mathematical and graphical analysis a chartist can calculate the most probable direction of price movement. These 2 forms of analysis overlap each other and most chartists use both. All charts are based on three elements; price, volume and time.
Different types of charts
There are many different types of charts in use throughout the world. All of the following examples are in common use today. The type of chart used is not a right or wrong decision but rather a question of personal choice. Different types of charts have their own strengths and weaknesses but it is never a good idea to use a type of chart that you do not feel comfortable with or confident in using.
What we are looking at when we study a price chart is the change in price over a given period of time. Hence the vertical scale on any price chart is the price of the instrument in question, while the horizontal scale is time. The following chart of BHP Billiton showing slightly over 12 months of weekly price activity is a typical example of the sort of chart you would see in a newspaper or magazine and is the simplest form of price chart…
Line-on-close weekly price chart of BHP Billiton
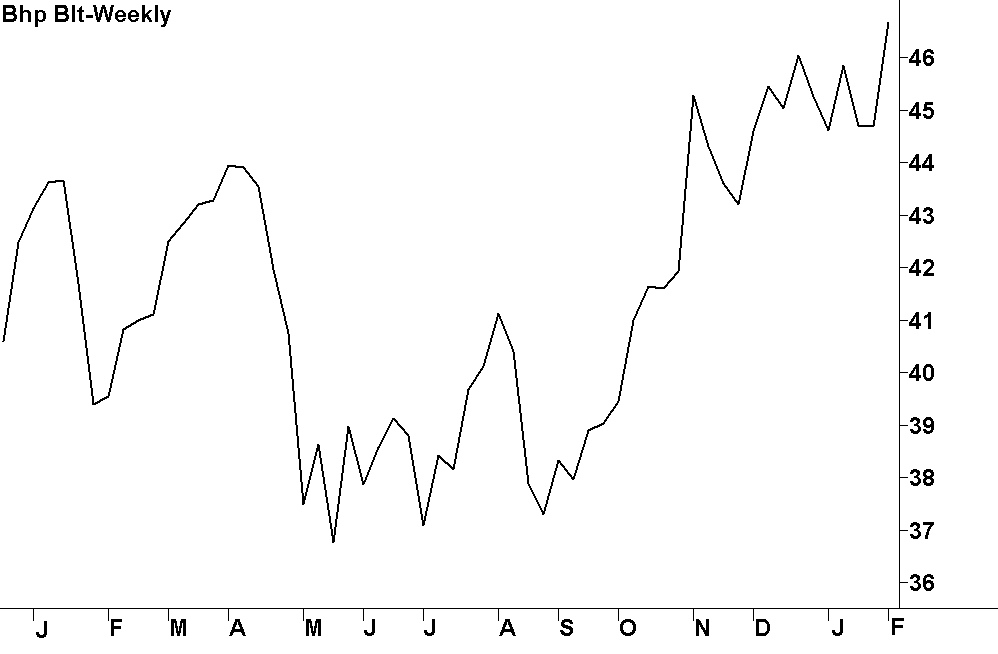
This chart would technically be referred to as a weekly line-on-close chart and is created by drawing a line connecting the weekly closing prices of BHP (ASX:BHP) during the period shown. The closing price is considered to be the most important piece of price information but there is more to the story on price than just the closing price. There is in fact four individual bits of price information and they are;
Open => the price the market initially trades at when it first opens
High => the highest price the market trades at during the trading period
Low => the lowest price the market trades at during the trading period
Close => the last price the market trades at just before the market closes
Note the use of the word ‘Market’ in the above explanation and in this context I am using it in its generic form. In other words I may describe the buying and selling of any individual share or financial instrument, such as BHP Billiton, as a ‘Market’ or I may use it to describe the Stockmarket as a whole. Whichever the case, it should be reasonably obvious what I mean from the context in which I am applying it.
Furthermore, as a form of shorthand, I may identify a specific share, such as BHP Billiton, by just its share code and not its full name. Usually I will use the Company’s full name initially but then refer to it by its share code from that point on. Anyway let’s get back to our discussion on price charts.
OHLC bar charts
Probably the simplest way in which to display all four bits of price information is with the aid of the OHLC bar chart, where OHLC is shorthand for Open, High, Low and Close.
OHLC weekly bar chart of BHP Billiton where each bar represents one week

In the above chart each trading period is represented by a bar that has a tick to the left of the bar and another tick to the right. The top of the bar and the bottom of the bar represent the price range of a given trading period (i.e. the high and the low) whilst the tick to the left of the bar is the opening price and the tick to the right represents the closing price.
All fairly straight forward and as I said; probably the simplest way of displaying all 4 bits of price information.
Candlestick charts
Now let’s move on to the type of chart that’s my personal favourite…the candlestick chart. It also conveys all 4 bits of price information and whilst it is the type of chart that I’ll be using most in this series of tutorials, you will also see the other chart types from time to time as well. Hopefully this will help you to familiarize yourself with all these different types of price charts.
Anyway, candlestick charts are a little more complex than the chart types that we’ve looked at so far and therefore they warrant a slightly more detailed explanation. Candlestick charts are so-called because they use a single candle for each trading period and I personally find them, visually speaking, very easy to interpret. The larger section of each candle is called the ‘Real Body’ whereas the thin parts on the top and/or bottom are called ‘Shadows’.

White Candle
A white candle is an UP candle where the close is higher than the open.

Black Candle
A black candle is a DOWN candle where the close is lower than the open.
Candlestick charts originated in Japan and have been in use for several centuries. There is a vast body of material on how to interpret these charts, including a wide variety of names for the different types of candles that can occur. But in order to keep this discussion as simple as possible, at this stage there is only one special type of candle that I will introduce you to…the Doji candle.

Doji Candle
A doji candle is where the Open and Close are equal of very similar.
Given that the open and the close of the Doji candle are the same, it doesn’t have a ‘real body’ as such. And, as you will see, this lack of trading range between the opening and closing prices has a very special significance that we’ll be looking into in greater depth later on. In fact one of the key reasons why I am such a fan of candlestick charts is because they visually emphasise the trading range between the opening and closing prices and this part of the price activity is of major significance.
Anyway, let’s now go back to our 12 month chart of BHP but this time let’s use candlesticks. Compare this chart (at the top of next page) to the earlier 12 month chart of BHP and you can see how it graphically conveys far more information. Note how the rising price activity is made up of mainly white candles whilst the down trends are dominated by black candles.
Candlestick chart of BHP Billiton

In the next module we will continue our introduction to charts by looking at the significance of trading volume and the different timeframes we can select.
Alan Hull’s company ActVest Pty Ltd is a Corporate Authorised Representative (CAR No.306718) of Avestra Capital Pty Ltd AFSL 292 464 ("Avestra"). This document has been prepared for the general information of investors and does not take into account the investment objectives, financial situation and particular needs of any particular person.
Past performance is not a reliable indicator of future performance.
Persons intending to act on information in this document should seek professional advice to confirm that the investments or strategies mentioned are appropriate in the light of their particular investment needs, objectives and financial circumstances prior to taking any action.
While reasonable care has been exercised and the statements contained herein are based on information believed to be accurate and reliable, neither ActVest, Avestra, nor their employees or agents shall be obliged to update you if the information or its advice changes or be liable (unless otherwise required by law) for any loss or damage suffered or caused to any person or corporation resulting from or contributed to by any error or omission from such statements including any loss or damage caused by any fault or negligence on the part of ActVest, Avestra or Stockopedia, whether direct, indirect, consequential or otherwise, whether foreseeable or not.
Direct investing in the stock market can result in financial loss. This document, and any associated files, is intended solely for its intended recipient. The contents are confidential and may be legally privileged.
Disclaimer
This is not financial advice. Our content is intended to be used and must be used for information and education purposes only. Please read our disclaimer and terms and conditions to understand our obligations.
1 comment
Straight up, I am a fundamentalist /sceptic, but I’d like to improve my buy/sell timing skills. I found this well explained and easy to follow. I appreciate this series and the efforts of the Aussie editing team. It is a valuable resource that I am just beginning to explore.