Episode #10 - Tutorial in Technical Analysis by Alan Hull December 13th, 2023

Dow Theory
Charles Dow proposed several theories on the markets from the late 1800’s to the early 1900’s as part of his work as a journalist (and co-founder) of The Wall Street Journal. Most of his work centered on the relationship between business and financial markets. However one part of his work that is of interest to chartists looks at the identification of trends using an analysis of peaks and troughs. This is a useful technique to understand and is the subject of the next two modules.
Peaks and troughs are the pivot points or reversal points in price movement. It is the relative position of successive peaks and troughs that help determine if a market is rising, falling or moving sideways.
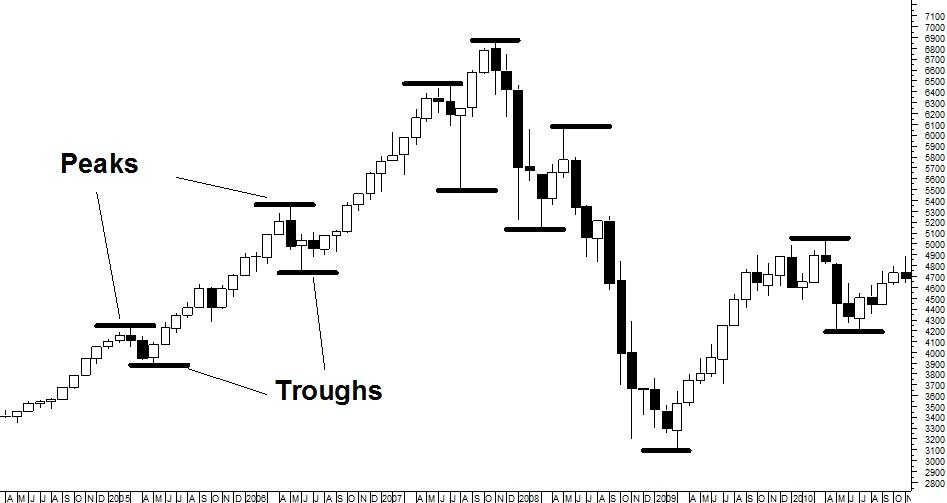
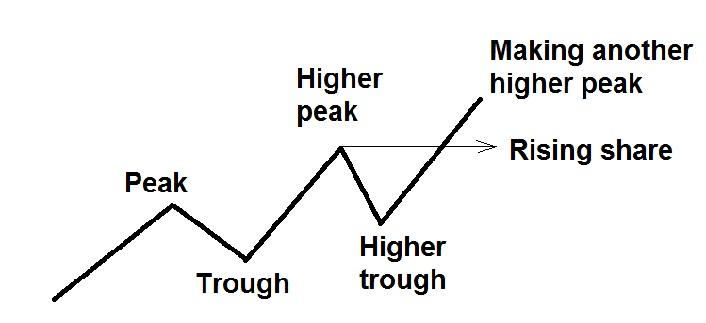
When a series of peaks and troughs are rising, the market is rising. When a series of peaks and troughs are falling, the market is falling. However it can be a little difficult to understand exactly how many peaks and troughs it takes to make a meaningful series, so consider the following diagram.
Here you can see a peak and trough followed by a higher peak and a higher trough. The market is considered to be rising after the formation of the higher trough. This is confirmed when the price rises above the higher peak, as shown in the diagram below using the thin line with the arrow to the right.
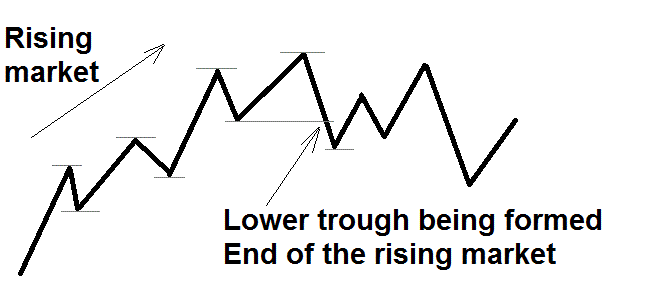
An end of a rising market is triggered when a lower peak or a lower trough is formed. This is illustrated in the diagram below. Starting at the left hand side of the diagram you can see the peaks are rising, and the troughs are rising as well. However, about half way along, a lower trough is formed. At this point, when the market falls below the previous trough, the market is no longer rising.
And it is important to note that the end of a rising market is not necessarily the beginning of a falling market. In a similar fashion to a rising market, a confirmed falling market requires a lower peak, a lower trough and a fall past the previous trough, as illustrated in the following diagram.

So there will times when the market is neither rising nor falling and is classified as sideways. What’s more, it should remain classified as sideways until there is a confirmed rising market or falling market.

Interestingly, there are actually two ways in which a market can be classified as sideways. A market can either be making a series of outside swings or a series of inside swings. In the following case, the All Ordinaries index was making a series of higher highs and lower lows in a widening pattern.

Whilst this widening pattern signals that the market is becoming increasingly unstable with growing volatility, Dow Theory is only concerned with trend direction. Thus, consider the following chart of Oil Search from the same period where it’s consolidating by forming lower highs and higher lows (i.e. decreasing volatility). It is also trending sideways when viewed from the perspective of Dow Theory.

Of course these are pristine examples and whilst using Dow Theory for trend analysis may seem an entirely mechanical process, there can be ambiguous cases. So I recommend that you find a source of price charts and have a play with Dow Theory for yourself. It is simple and robust technique that I often use to identify trends and set trailing stop loss levels. The simple approach is often the best
Alan Hull’s company ActVest Pty Ltd is a Corporate Authorised Representative (CAR No.306718) of Avestra Capital Pty Ltd AFSL 292 464 ("Avestra"). This document has been prepared for the general information of investors and does not take into account the investment objectives, financial situation and particular needs of any particular person.
Past performance is not a reliable indicator of future performance.
Persons intending to act on information in this document should seek professional advice to confirm that the investments or strategies mentioned are appropriate in the light of their particular investment needs, objectives and financial circumstances prior to taking any action.
While reasonable care has been exercised and the statements contained herein are based on information believed to be accurate and reliable, neither ActVest, Avestra, nor their employees or agents shall be obliged to update you if the information or its advice changes or be liable (unless otherwise required by law) for any loss or damage suffered or caused to any person or corporation resulting from or contributed to by any error or omission from such statements including any loss or damage caused by any fault or negligence on the part of ActVest, Avestra or Stockopedia, whether direct, indirect, consequential or otherwise, whether foreseeable or not.
Direct investing in the stock market can result in financial loss. This document, and any associated files, is intended solely for its intended recipient. The contents are confidential and may be legally privileged.
Disclaimer
This is not financial advice. Our content is intended to be used and must be used for information and education purposes only. Please read our disclaimer and terms and conditions to understand our obligations.
1 comment
Thank you