Episode #11 - Tutorial in Technical Analysis by Alan Hull January 11th, 2024

The count back line
A close relative to Dow Theory is the count back line. The count back line (CBL) method was developed by Daryl Guppy and is used to fine tune market entries and exits. Thus when a market stops falling and starts rising, we are faced with the question of when we should enter. Inversely, if we own a share that is rising in price and it suddenly starts falling then when do we decide to sell.
The CBL provides a mechanical solution to these questions and is considered to be a relatively tight stop loss, whereas the Dow Theory stop loss is a wide stop loss. For an entry, the CBL is applied by drawing a line, towards the left, from the high of the bar with the lowest low (also known as the pivot point low). You can see how this is done by looking at the following chart, in the lower left corner.
The first bar that the line hits is then used to set up the second line to the left by starting from the high again. From the next bar in the sequence, a line is then drawn from the high towards the right. A close above this level indicates an entry point. The technique involves three bars (or trading periods) and is called the 3-bar count back line. Hence this technique is adjustable by using more or less bars.
The reverse procedure from an entry is used to calculate the CBL stop loss. The CBL stop loss can be recalculated after each trading period has occurred to provide a new stop loss. Every time a new high is made, the CBL stop loss can be adjusted upwards, otherwise it simply remains where it is. But note that it should never be lowered and therefore it will ratchet up with a rising trend but never drop back when the trend falters. Hence the CBL stop loss is a trailing stop loss and can be seen giving an exit signal in the top right corner of the following chart.
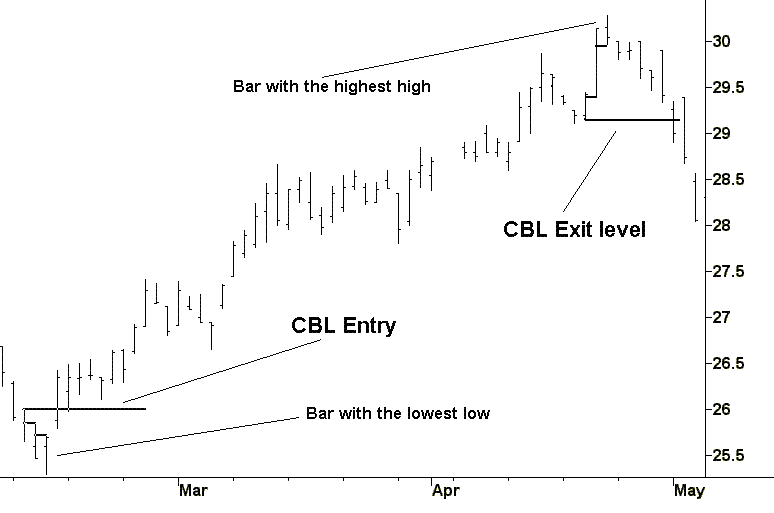
The above chart shows the CBL method being used for an entry and exit on National Australia Bank. The CBL method responds to recent price volatility and adjusts the entry or exit point accordingly. The use of the CBL on the above chart gives an entry of $26.50 and an exit of $29.00. This is a return of just over 9% for a trade lasting 10 weeks. The CBL method is a completely mechanical approach that can help traders to overcome indecision at the moment of entering or exiting trades.
Exercises
As the CBL is primarily used as a stoploss these exercises will mainly focus on this aspect. The chart below shows the pivot point high (the dotted bar) and the CBL stop loss (the short line). The first thing you must do is identify the pivot point high and then count back 3 bars, jumping any gaps as you go.

Please identify the current pivot point high and the 3 bar CBL stop loss on the following charts. In all instances please assume that you entered the market four trading periods back. And be warned….the first one is easy but then it gets a little tricky. Help; in the 3rd chart the stop loss = $6.42


Alan Hull’s company ActVest Pty Ltd is a Corporate Authorised Representative (CAR No.306718) of Avestra Capital Pty Ltd AFSL 292 464 ("Avestra"). This document has been prepared for the general information of investors and does not take into account the investment objectives, financial situation and particular needs of any particular person.
Past performance is not a reliable indicator of future performance.
Persons intending to act on information in this document should seek professional advice to confirm that the investments or strategies mentioned are appropriate in the light of their particular investment needs, objectives and financial circumstances prior to taking any action.
While reasonable care has been exercised and the statements contained herein are based on information believed to be accurate and reliable, neither ActVest, Avestra, nor their employees or agents shall be obliged to update you if the information or its advice changes or be liable (unless otherwise required by law) for any loss or damage suffered or caused to any person or corporation resulting from or contributed to by any error or omission from such statements including any loss or damage caused by any fault or negligence on the part of ActVest, Avestra or Stockopedia, whether direct, indirect, consequential or otherwise, whether foreseeable or not.
Direct investing in the stock market can result in financial loss. This document, and any associated files, is intended solely for its intended recipient. The contents are confidential and may be legally privileged.
Disclaimer
This is not financial advice. Our content is intended to be used and must be used for information and education purposes only. Please read our disclaimer and terms and conditions to understand our obligations.
No comments yet
No one has commented here yet! Why not be the first one?