Episode #7 - Tutorial in Technical Analysis by Alan Hull August 09, 2023

This is another article in a series of education posts from Alan Hull. Alan Hull is a renowned technical analyst within the Australian Market. He has educated thousands of investors on how to apply technical analysis within their overall strategy. In this special series, Alan has agreed to share his Technical Analysis tutorials with Stockopedia members. He has committed to provide one ever three/four weeks. To learn more about Alan you can read his profile here. Or visit his website alanhull.com.au
To re-acquaint yourself with Alan's prior postings, please go to “Discuss” in the left hand column and selecting “Aus/NZBlogs” (see below). Scroll down and you will find a contribution one to every three/four weeks. All graphs are for education purposes only and are deliberately out of date for that reason.

Other important patterns
Line of best fit
If a group of traders and investors believed $7.50 is the true value for a share then it is logical to assume that they would be buyers if the price fell below $7.50. Conversely, if the price rose above $7.50 they would become sellers. This causes the share price to return to $7.50 whenever it tries to move away from this level.
A horizontal line at $7.50 is called the line of best fit or line of linear regression. A line of best fit is similar to a support and resistance line but of different significance. As the volatility of price activity diminishes and settles at the line of best fit, agreement is being reached by the bulls and bears.
From this point there will be a breakout and the chartist will use other indicators and methods to determine the direction of the breakout. If the price activity remains around the line of best fit for a prolonged period, the price will develop support and resistance characteristics as well.
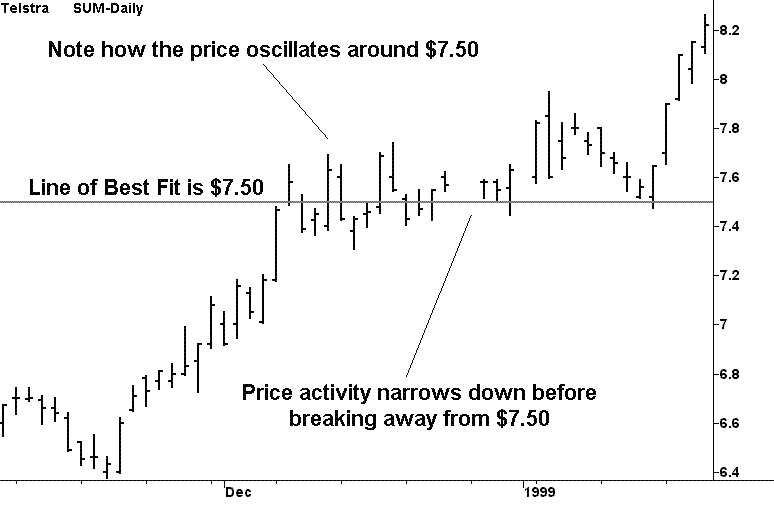
The above historical chart of Telstra shows the price activity oscillating around $7.50 in late 1999 and how this price activity gradually narrowed down before breaking away from $7.50. Furthermore, towards the right hand side of the chart, the price activity comes down and bounces off $7.50 before continuing on its upward trend. Because the price has remained at this level for some time, it developed support/resistance characteristics as well.
Lines of best fit are of less importance than lines of support and resistance. They are characterized by price activity oscillating around a particular price level rather than bouncing off it as would be the case with a line of support and resistance.
Double top
A double top (or bottom) is where the market takes the price up or down to the same level twice. When the price pulls away for the second time it is usually a strong move. This pattern often occurs with large capitalization shares and market indexes. The chart below of Telstra is a classic example.

Head & shoulders
A head & shoulders pattern occurs when the market moves price from one level up to another. The price breaks back to the original level and then breaks down from this level. This is an extremely bearish signal as shown with the correction of 1997, below. And just like double tops, this pattern can also occur upside down and is often seen in both large capitalization shares and market indexes.

Rounding top
Double tops and head & shoulders patterns are specific types of rounding top patterns but chartists should always be on the lookout for more generic forms of rounding tops as well. These patterns indicate the imminent failure of the underlying trend and can also occur upside down as dish patterns. Again they are common in blue chip shares and indexes. The chart below is the S&P500 Futures…

Exponential trend
This last pattern is an exponential or accelerating trend where the trend is defined using a curve. This pattern indicates that the underlying trend is most likely going to be strong but short lived. And unlike the previous patterns it most commonly occurs in small to mid capitalization shares.

Alan Hull’s company ActVest Pty Ltd is a Corporate Authorised Representative (CAR No.306718) of Avestra Capital Pty Ltd AFSL 292 464 ("Avestra"). This document has been prepared for the general information of investors and does not take into account the investment objectives, financial situation and particular needs of any particular person.
Past performance is not a reliable indicator of future performance.
Persons intending to act on information in this document should seek professional advice to confirm that the investments or strategies mentioned are appropriate in the light of their particular investment needs, objectives and financial circumstances prior to taking any action.
While reasonable care has been exercised and the statements contained herein are based on information believed to be accurate and reliable, neither ActVest, Avestra, nor their employees or agents shall be obliged to update you if the information or its advice changes or be liable (unless otherwise required by law) for any loss or damage suffered or caused to any person or corporation resulting from or contributed to by any error or omission from such statements including any loss or damage caused by any fault or negligence on the part of ActVest, Avestra or Stockopedia, whether direct, indirect, consequential or otherwise, whether foreseeable or not.
Direct investing in the stock market can result in financial loss. This document, and any associated files, is intended solely for its intended recipient. The contents are confidential and may be legally privileged.
Disclaimer
This is not financial advice. Our content is intended to be used and must be used for information and education purposes only. Please read our disclaimer and terms and conditions to understand our obligations.
No comments yet
No one has commented here yet! Why not be the first one?