Evaluating the Performance of Factors in Investing: A Reflection on the Past Year

I feel a growing sense of despondency in the discussions while reading the SCVR. It appears that people's portfolios have not been performing well, and the Stockopedia factors that we previously relied upon seem to be losing their effectiveness. Certain comments, such as "fundamental-based factor investing has become less successful," go unchallenged, and even Ed's new series of articles on proven strategies only generate brief and limited discussions. It's possible that factor investing is indeed on the decline, and we may need to explore alternative approaches. With that in mind, I decided to delve into my database and attempt to answer the question: "Have any investing factors been effective in the past year?"
Stockopedia concentrates on three recognised factors with the Quality, Value and Momentum ranks alone or in combination. To these three I have added Size (small cap beats large cap) and Volatility (low volatility is best). I collect data from Stockopedia and over the last 12 months from June 2022 to date I have information on over 680 companies which are part of my investment universe. I have combined a snapshot of this data from 3 June 2022 with total return data from an alternative supplier between that date and now. I then sorted the data according to each of the factors and recorded the average performance of the top and lowest quintiles. I also recorded total return data for various indices over the same time period and calculated the mean total return of all 680 companies.
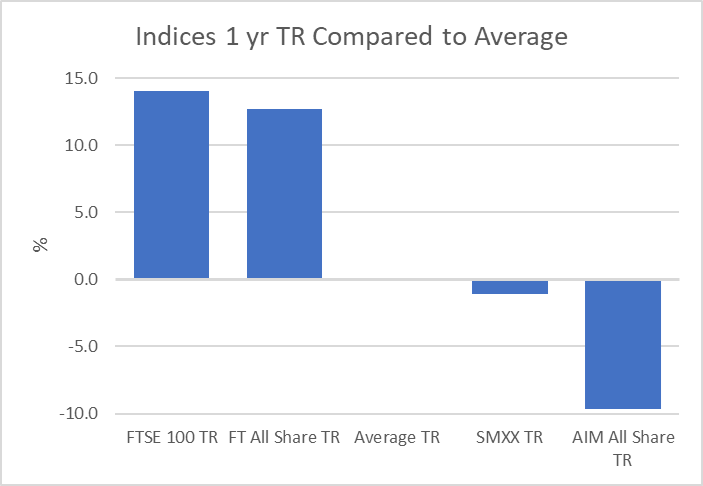
First, I had a look at the indices and average of all the companies to get a feel for the overall performance. The best return has been from the FTSE 100 with a positive return of 5.1% and the worst from AIM with a real loss of 18.6%. The overall average is a rather poor loss of 8.9% so hardly surprising that most investors aren’t jumping for joy. If we subtract the average from the actual, we get an indication of the relative performance which is graphically illustrated in the bar chart. The star is the FTSE 100 with relative performance of 14.1% and the laggard AIM with the dismal relative performance of -9.7%
% Total Return |
Relative to Average |
|
FTSE 100 TR |
5.1 |
14.1 |
FT All Share TR |
3.8 |
12.7 |
Average TR |
-8.9 |
0.0 |
SMXX TR |
-10.0 |
-1.1 |
AIM All Share TR |
-18.6 |
-9.7 |
I then looked at each of the factors independently. The first table is the average total return of the top quintile for each factor in the "%TR" column. The "Relative to Average" and "Relative to FTSE 100" columns represent the relative performance. Looking down the "Relative to Average" column we see there has been a satisfactory positive return for Q, V, M and Low Volatility but the smallest companies have substantially underperformed.
Table 1: Top Quintile |
% TR |
Relative to Average |
Relative to FTSE 100 |
Quality |
-1.85 |
7.1 |
-7.0 |
Value |
-3.09 |
5.8 |
-8.2 |
Momentum |
-1.745 |
7.2 |
-6.9 |
Small Cap (smallest) |
-16.6 |
-7.7 |
-21.7 |
Volatility (lowest) |
0.02 |
9.0 |
-5.1 |
The second table shows the bottom quintile in the same format. The lowest ranked Q, V and M shares plus those with the highest volatility have substantially underperformed the average but the large cap shares have streaked ahead of the average.
| Table 2: Lowest Quintile | % TR |
Relative to Average |
Relative to FTSE 100 |
Quality |
-24.2 |
-15.3 |
-29.3 |
Value |
-18.3 |
-9.4 |
-23.4 |
Momentum |
-17.98 |
-9.0 |
-23.1 |
Small Cap |
4.21 |
13.1 |
-0.9 |
Volatility |
-23.7 |
-14.8 |
-28.8 |
I then combined the two tables with the figures expressed relative to the average.
Top Quintile |
Lowest Quintile |
Difference |
|
Quality |
7.1 |
-15.3 |
22.4 |
Value |
5.8 |
-9.4 |
15.2 |
Momentum |
7.2 |
-9.0 |
16.2 |
Small Cap (smallest) |
-7.7 |
13.1 |
-20.8 |
Volatility (lowest) |
9.0 |
-14.8 |
23.7 |
Presented as a bar chart it looks like this:
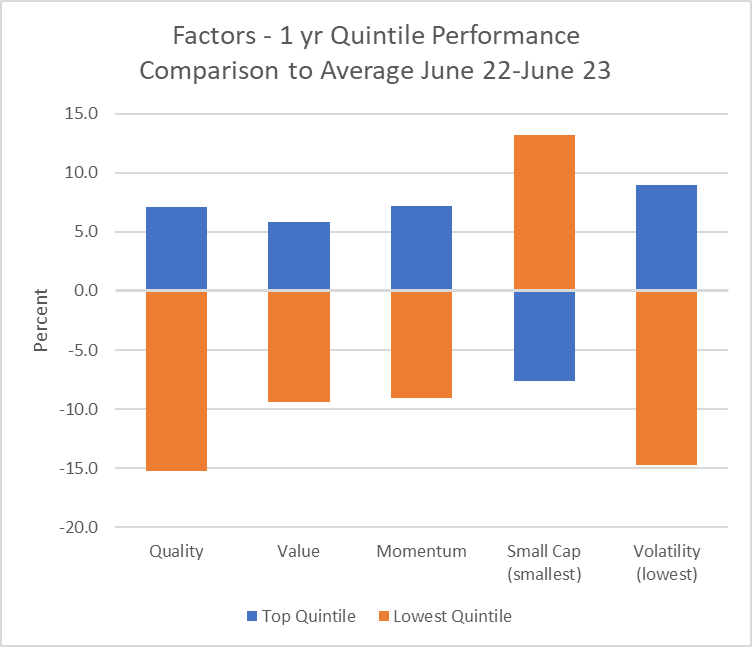
This chart clearly shows that the Quality, Value, Momentum ranks and Low Volatility have generated good differentiation of performance between high and low ranking companies but Market Cap is the exact opposite to that anticipated. Large cap companies have on average substantially outperformed the small. I think we had an inkling that this would be the case when looking at the performance of the indices.
Overall, for small cap investors our preferred factor (smaller companies) has indeed failed us quite dramatically over the past twelve months. However, by keeping exposure to Q, V, M and Low volatility the effects of this failure of the small cap effect may have been mitigated. In my own case, my portfolio of 40 shares whose selection is driven by a combination of all five factors, has underperformed the FTSE 100 but beaten the average by a satisfactory margin despite the portfolio skew to smaller companies.
The big unresolved question is when, or whether, the small cap effect will reassert itself.
Disclaimer
This is not financial advice. Our content is intended to be used and must be used for information and education purposes only. Please read our disclaimer and terms and conditions to understand our obligations.
10 comments
excellent analysis DWit199
Great post. I was thinking about writing a post on this at some point soon. There is a lot of research which shows that Smallcaps tend to underperform as you go into a recession, but afterwards and coming out of it they do far better. They cut costs quicker and so return to bumper profits faster.
I am tracking the small cap trends consistently. AIM yet to base, but SMX and small cap QVM much healthier.
We’re in a different world with rates higher and competition from gilts/bonds. But bear markets don’t last forever.
Don’t give up on stocks right at the time when everyone else does. We might not have hit bottom yet - but when we do there will be rapid multi-bagging!
Thank you for an interesting piece of work. My main take on it is that, if current trends continue, then we would achieve better performance by investing in bigger companies. Do you have any data to suggest what is the minimum market capitalisation we should be looking at?
My data from the last 6 weeks suggests that over this time period there is no clear trend towards any particular size company outperforming. I am cautiously optimistic that small caps are returning to the long term trend of outperformance so I would hesitate to reposition a portfolio into large caps at the moment. In general the market cap effect is imprecise so my portfolio is simply tilted towards small cap. I don't have any strict thresholds but I do tend to exclude shares below £20-50 million. I don't have any evidence to support that lower limit but it seems rational from a liquidity point of view and the higher spreads at the lower end of the market.
Don’t the data suggest the opposite? After a period of underperformance, regression to the mean with reassert itself and selected small caps will come good.
Yes Doctor Dave. But I am not a contrarian. I am a momentum follower. So I will follow a trend which has already started rather than hope that a trend will start soon.
Do you have any data to suggest what is the minimum market capitalisation we should be looking at?
This is a a very interesting question and something I have been thinking about for a while.
In diagnostic testing the ROC curve provides useful information about the characteristics of a test and optimal thresholds for diagnosis depending upon the purpose of the test. I have never seen it described in the financial literature but I think a modification of the ROC curve can be useful when looking at factors in investing. Once I have my thoughts clear on the subject I will try to make a complete post, but the chart below is an example. It plots the proportion of total gain on the y axis against proportion of total loss on the x. You would be looking for a point where that ratio is substantially above 1. The orange line is the curve you get if the test has no powers of discrimination. The observed blue line is above the orange so a year ago Mkt Cap would have been a useful discriminator.
If you were an investor a year ago with perfect foresight you would pick point 1 where the gains are rising rapidly with hardly any losses. This corresponds to companies with a Mkt Cap of above about £2.5 billion. Alternatively, if you wanted to have a greater choice of companies then the gain/loss ratio remains favourable to point 2 which corresponds to Mkt Cap of about £650 million. Adding smaller companies beyond that threshold leads to progressively more losses for very little extra gain.
However, if we do the same exercise for the last 6 weeks we get this curve, which shows that in the recent past Mkt Cap had little if any discriminatory power. The area under the curve is 47% which if anything just favours smaller cap companies.
Dwit199. Thank you! That's a great piece of original work! I have never heard of ROC before, but I think I can get to some sort of basic understanding of what you are saying. If the trend of the most recent data was to continue, then smaller companies would be doing marginally better than larger companies. It's still rather difficult for me to reach any actionable conclusions. I guess one thing that might stand the test of time is that it would generally be better to own a wide selection of company sizes , so as to always have some which are currently performing well. The only free lunch is diversification?
Would it be possible please to run the data for a much longer time period like 10 years? That might help us to understand how the more recent periods compare with the long term picture?
Would it be possible please to run the data for a much longer time period like 10 years?
That is extremely hard to do. You would be amazed at the number of corporate actions, name changes, suspension, mergers etc that happen over that timescale To do the job properly would require a database that can be queried at a point in time. That may be available to academics and financial institutions but not to me, unfortunately.
I think the academic evidence available supports the long term effectiveness of the small cap premium and as Ed says, now is probably not the time to throw in the towel. I think there is a very good chance that over the next three to five years, a portfolio tilted towards small cap shares will perform well.
Thank you for your reply. I now understand that it is not feasible for you to run the data for 10 years. I am not thinking about throwing in the towel at the moment. I was more thinking about what to buy now and in the future.