Finding the companies most likely to be acquired

One of my big calls for 2026 is that takeovers will continue to be a big feature of the UK markets. Given the valuation disparity as you go down the size of listed companies, my theory is that smaller fish will increasingly be seen as dinner for larger predators from the UK and beyond. In a world where UK retail funds continue to see outflows, I also expect takeovers to be one of the primary sources of “accelerated price discovery” for investors this year. I laid out my full argument in the first article in this series.
Charlie Mungers, not Ben Grahams
Last week, Alex added a more rigorous analysis of the data on what type of companies had received takeovers over the last few years. To be honest, the results surprised me. Acquirers were far more likely to be “Mungers” than “Grahams”. On the whole, they haven’t been buying companies significantly cheaper than market averages on most valuation metrics:
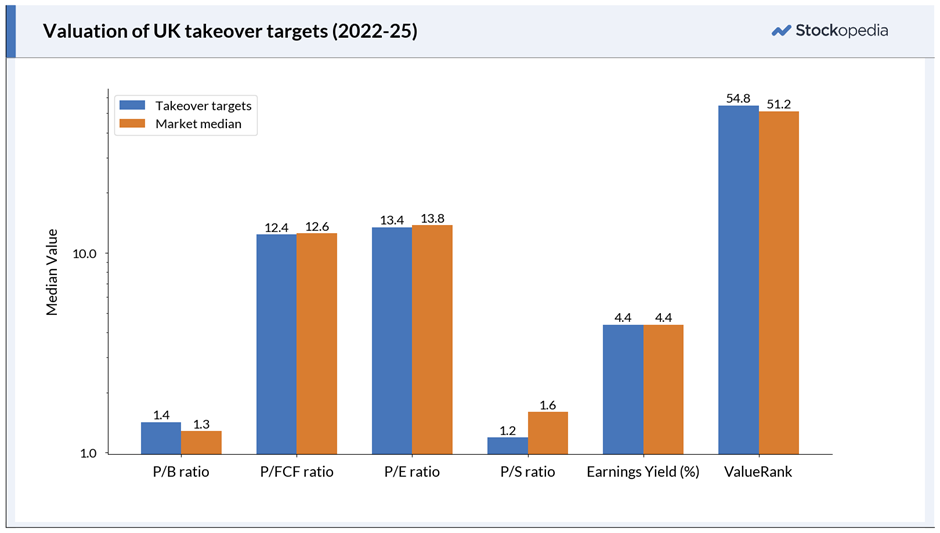
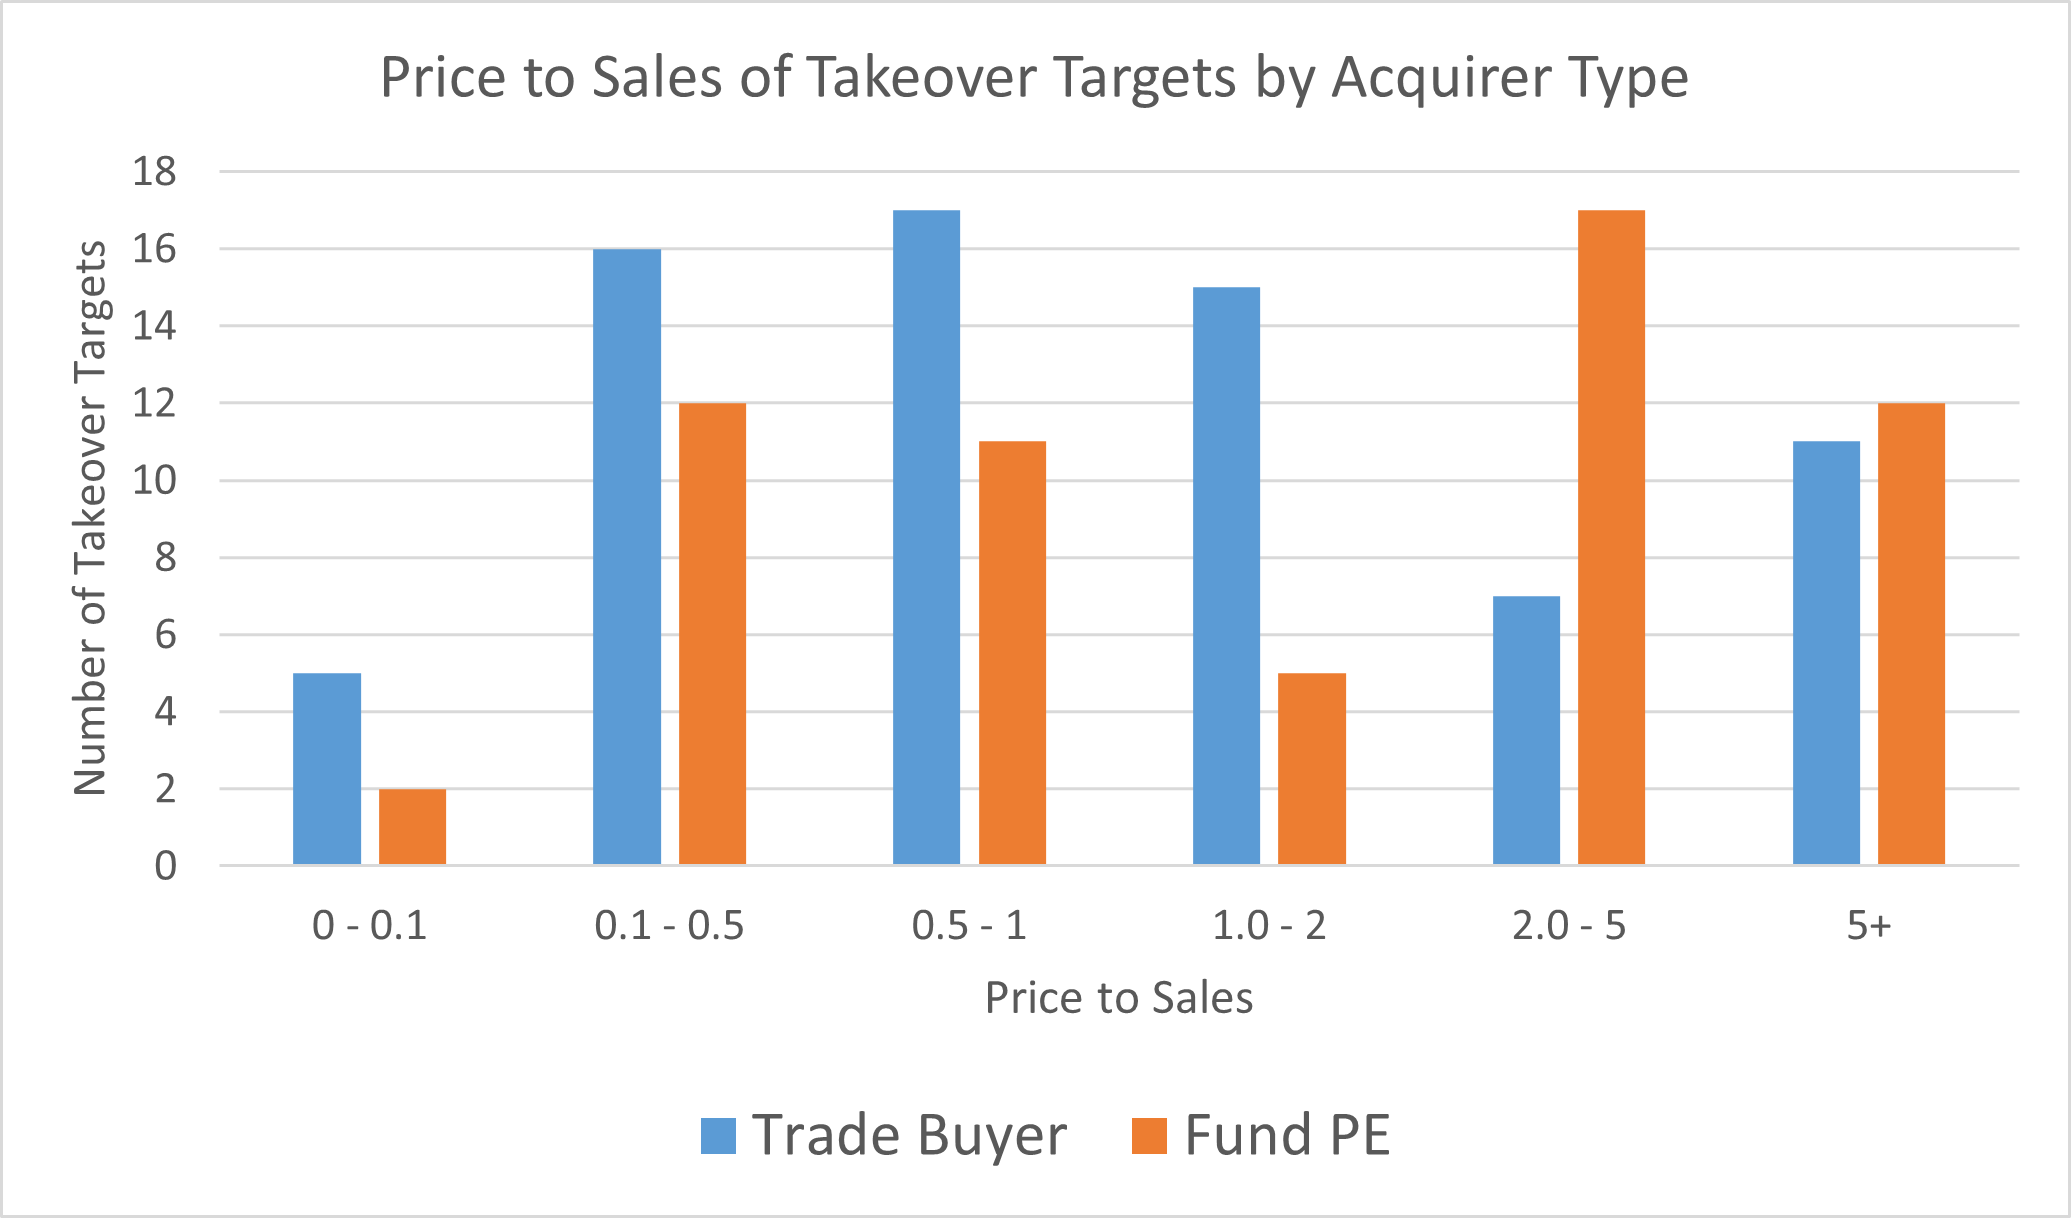
I would argue that valuations do matter, and it is the availability of stocks on a Price to Free Cash Flow of 12 that makes the UK a rich hunting ground for acquirers. However, once you go below market medians, this doesn’t make companies more attractive to the average acquirer. While companies aren’t necessarily buying bargain assets or earnings, they appear to be more discerning when it comes to sales. The lower-than-average Price-to-Sales ratio suggests that acquirers may be keen to acquire sales where they can generate higher margins through cost-cutting or synergies. Looking into the details, I find that Trade Buyers are less keen to pay a high P/S than Private Equity, giving credence to this theory:
The most significant difference between takeover targets and the general market was the higher Quality Rank. Although again, this varied between the types of buyers:
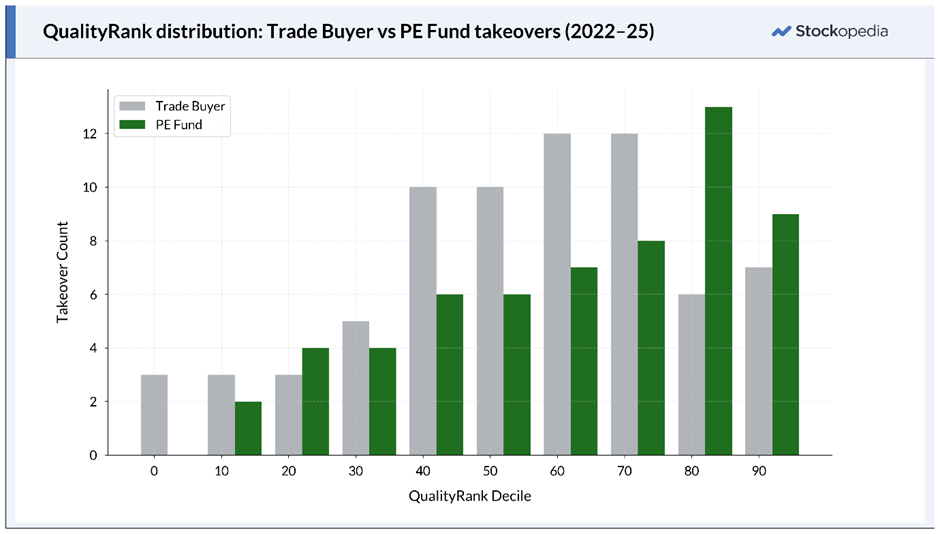
Private Equity almost always preferred higher-quality stocks. However, anything above around 40 seemed to be ok for the majority of Trade Buyers. Part of this difference appears to be due to the preference for Private Equity buyers for a higher Piotrowski Score (which is weighted strongly in the Quality Rank). The median value in the Private Equity takeovers was 6, versus 5 for Trade Buyers. Since this is primarily a measure of fundamental momentum, such as improving profitability, buyers appear to be waiting for signs of a turnaround before jumping in.
Screening for Takeovers
I’ve set myself the (perhaps daunting) task of screening for the types of stocks that have historically received takeover offers, with the possibility that these qualities may lead to offers being made for these types of businesses in the future. It is worth reiterating that there is a lot of randomness involved in which stocks are snapped up and which remain on the shelf. However, I think the exercise is still worthwhile. Both trade buyers and private equity buy listed businesses because they have attractive qualities that make them good long-term investments. I would argue that acquirers engage in a form of time arbitrage; they are willing to look through the types of short-term issues that scare investors (none of us wants to be the chump that buys a stock just before a profits warning).
Acquirers are willing to buy growing high-quality companies that are out of favour due to problems that are either cyclical or solvable. They may have some levers to pull when they own the whole business that the minority holders don’t. However, these qualities should still deliver above-average returns to investors in these types of businesses, even if they don’t end up being taken over.
While it is clear that there are a lot of similar factors that mark out both trade buyer and private equity acquisitions from the general market, there are also some subtle differences between the two types. Therefore, I think it makes sense to create two screens rather than one. Here’s what I’ve come up with.
Size
When it comes to acquisitions, size does matter. While there were a few larger transactions, they tended to look more like mergers or less attractive all-share offers, rather than a nice, clean cash exit at a decent premium for holders. For both types of buyer, I stick to companies with a market cap of less than £2.5bn before the offer, where cash offers were more abundant. I’ve also excluded stocks below £10m market cap as we tend to do at Stockopedia.
Value
The only value factor that appears to differ from market averages was price-to-sales. Trade buyers appear to prefer a P/S ratio below 2 (see graph above). However, Private Equity seemed largely indifferent to this. My screens will reflect this.
Quality
Private Equity buyers largely wanted high-quality stocks, so I demand a Quality Rank of over 60 for this screen. However, Trade Buyers were less discerning. Junk stocks were still unlikely to receive offers, but I set a less-demanding threshold of 40 for this screen.
In his checklist, Alex suggested investors should demand Gross Profits to Assets > 15 and Long-Term FCF to Assets > 2. However, I find that this latter requirement only really applies to takeovers by Private Equity Funds:
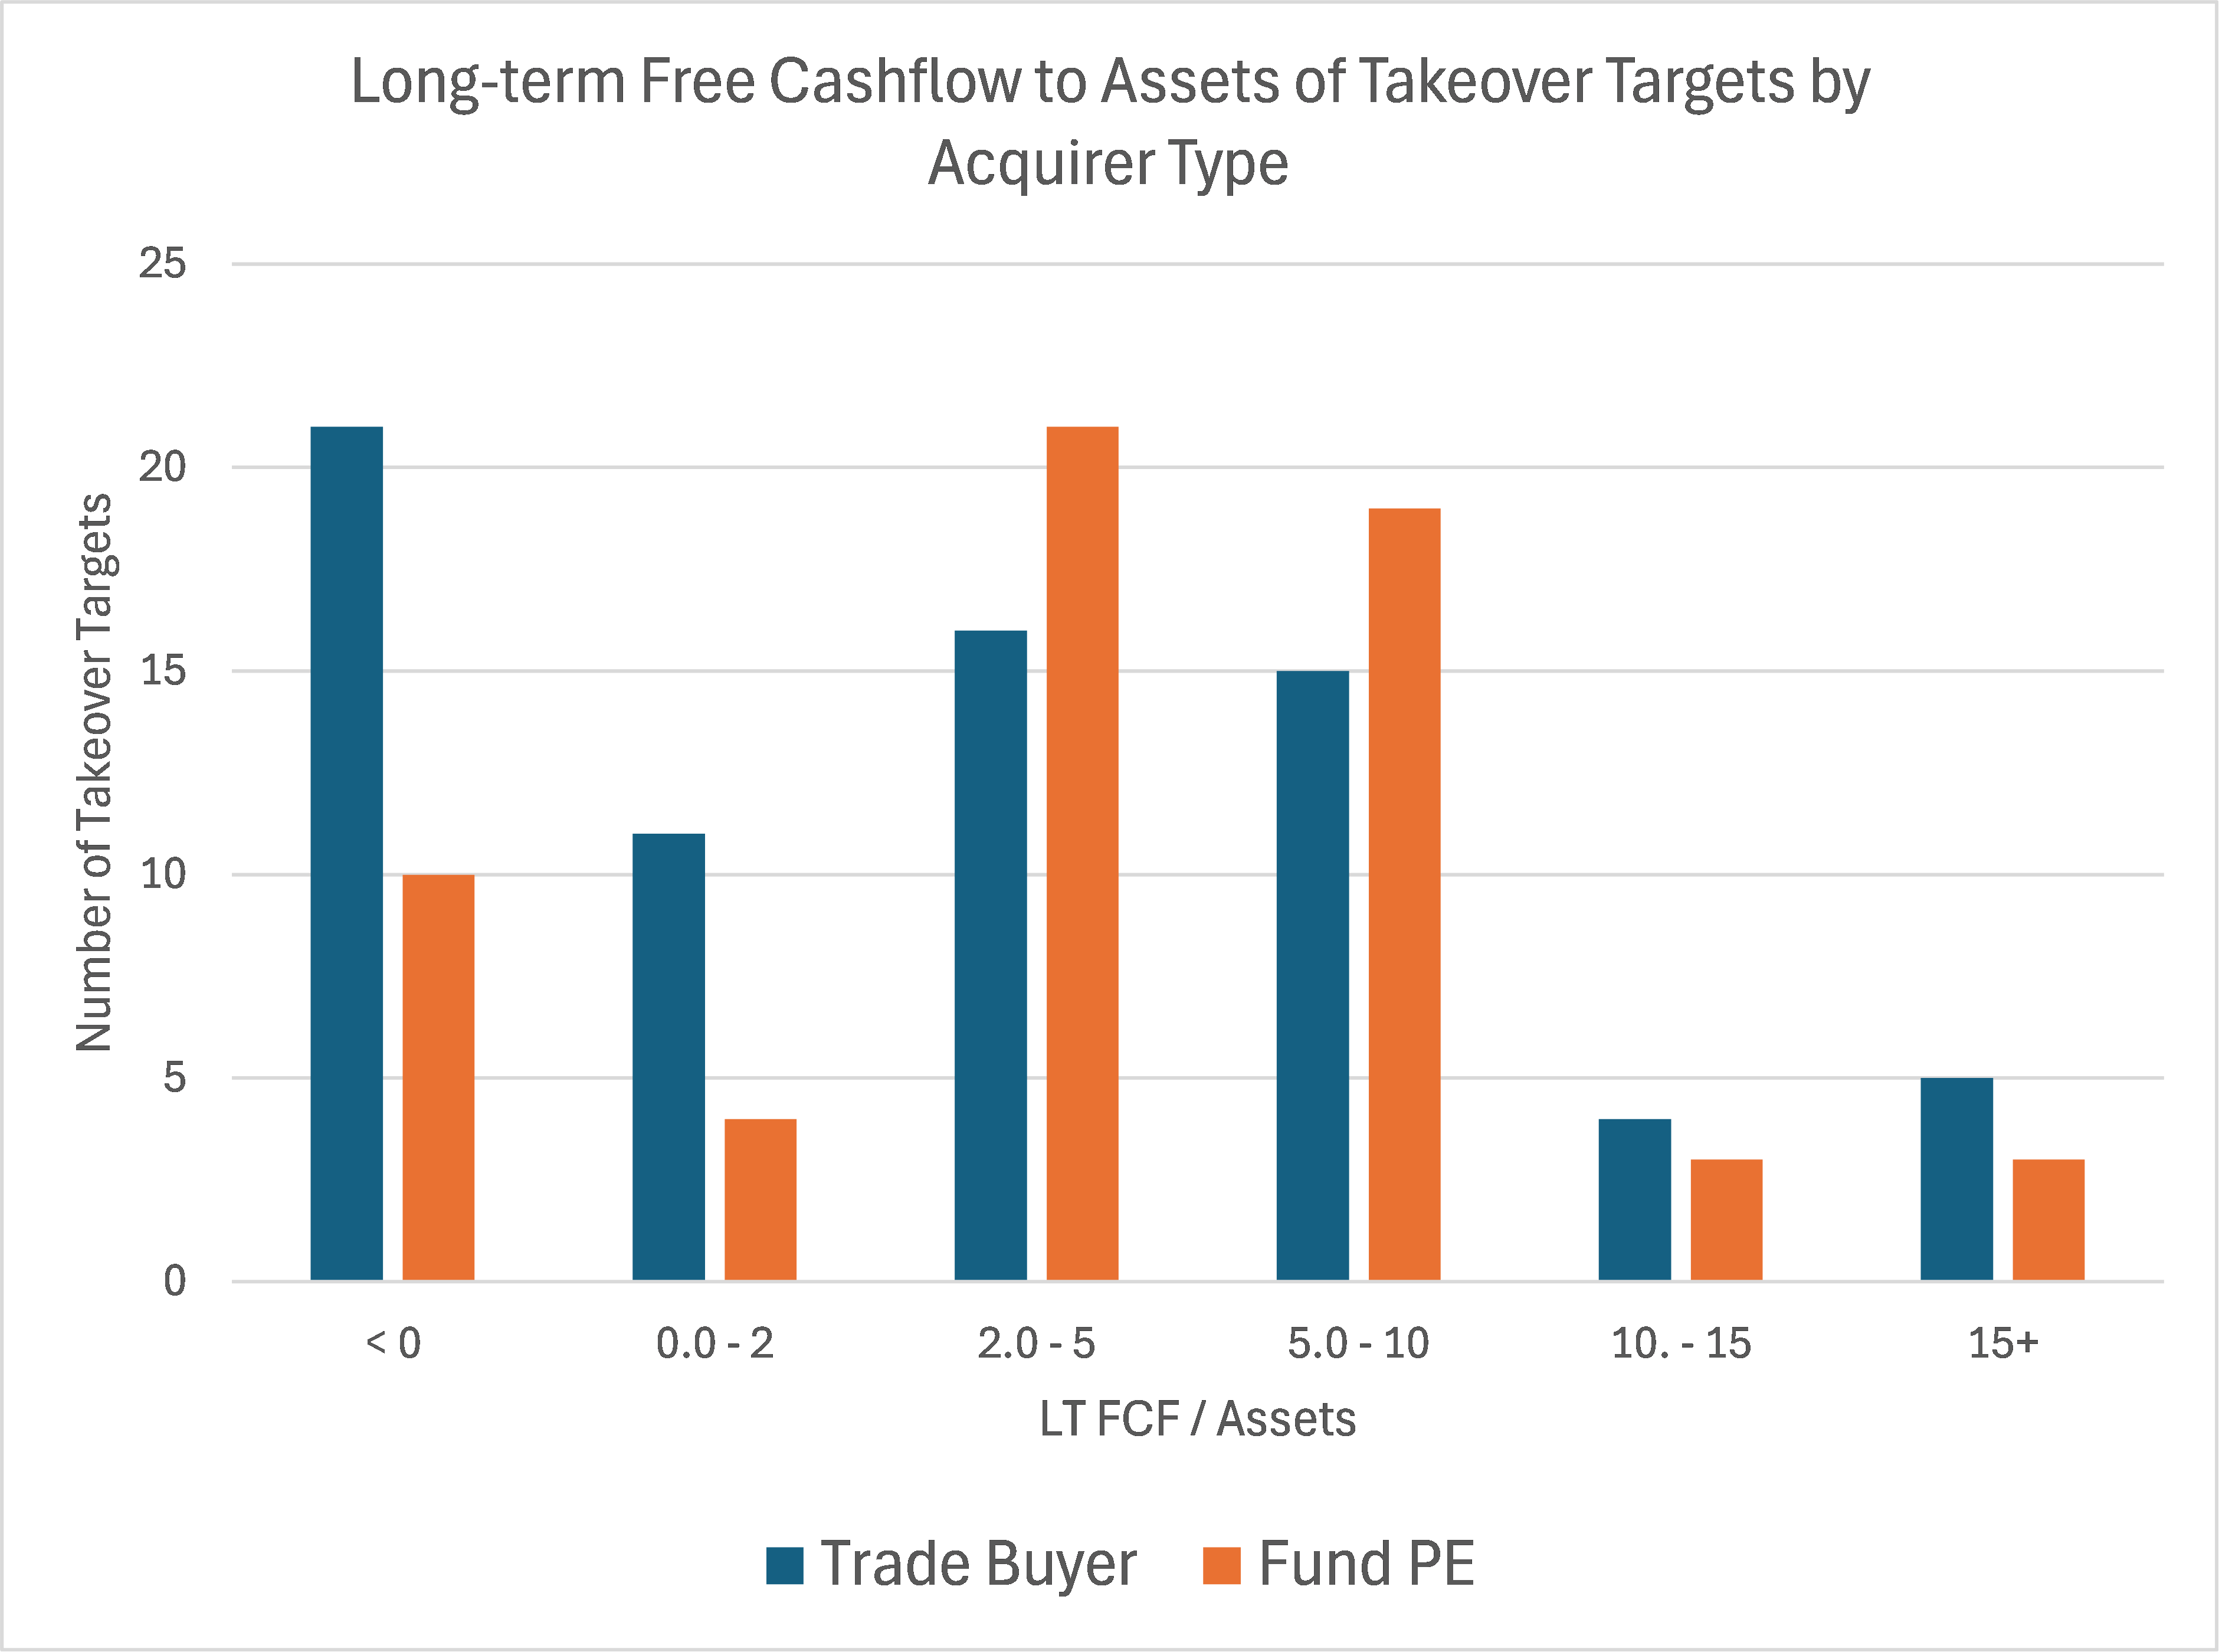
I find that both types of acquirers were equally attracted to high Gross Profits to Assets, although I suggest that we should be a bit more demanding at 20%+.
Growth
Alex found that although recent sales and EPS growth rates were largely similar to market averages, takeover candidates were associated with higher long-term growth rates:
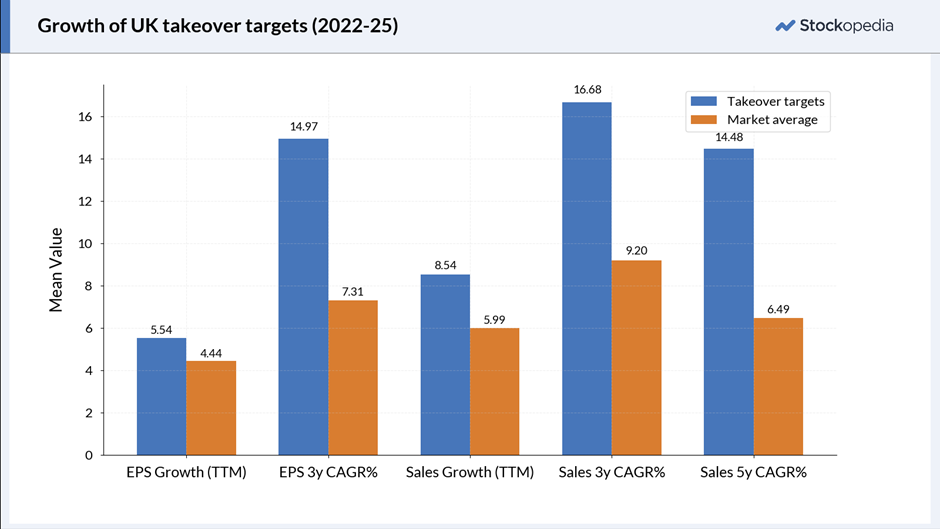
The biggest spread between takeover candidates and the market median was for 5-year Sales CAGR. However, when I dive into the details of this, a more complex picture emerges:
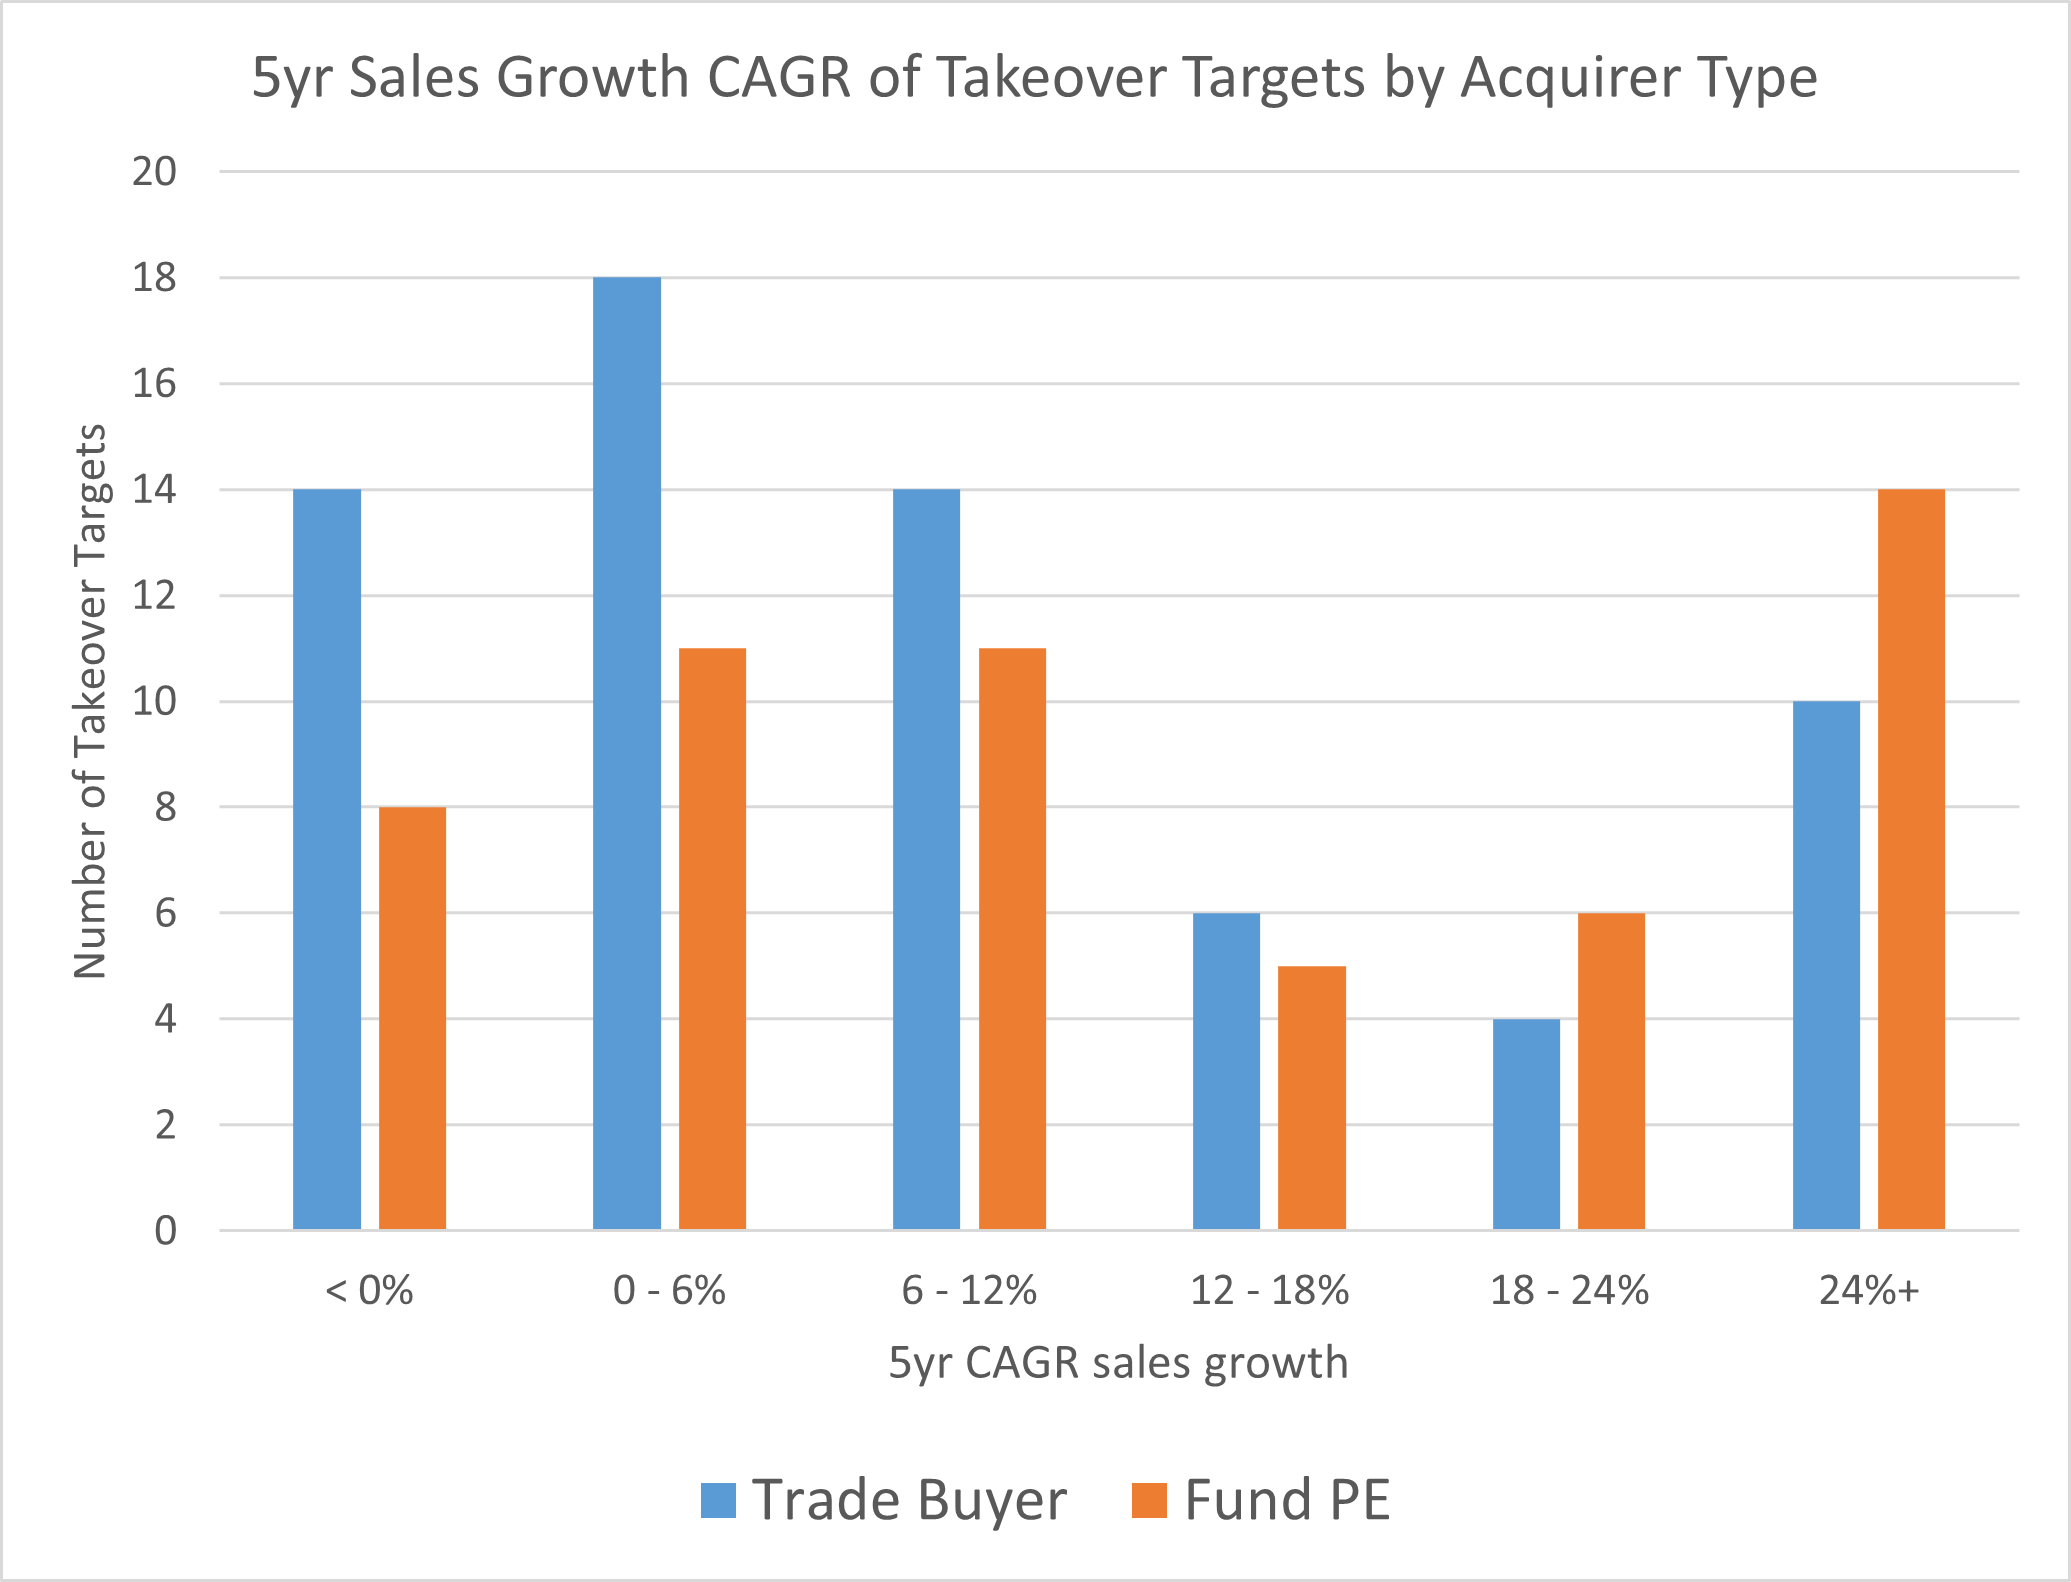
Both types of buyers, and especially private equity, are attracted to the fastest-growing companies. However, they seem equally attracted to companies where the 5-year sales growth is negative. I can’t see an obvious cutoff point where it would make sense to set a screening threshold, so I will leave this out. Subscribers may want to create their own copy of the screens and include this if they have an idea of how this can be used effectively.
Leverage
In his analysis, Alex noticed that the median net debt to assets of takeover candidates was significantly above the market median. He theorised that takeover candidates would have something wrong with them that was easy for an acquirer to fix. An overleveraged balance sheet could be one of those things. However, drilling down into the details, I actually see two trends. Either companies had underleveraged balance sheets as indicated by a negative number, or a higher than market average figure:
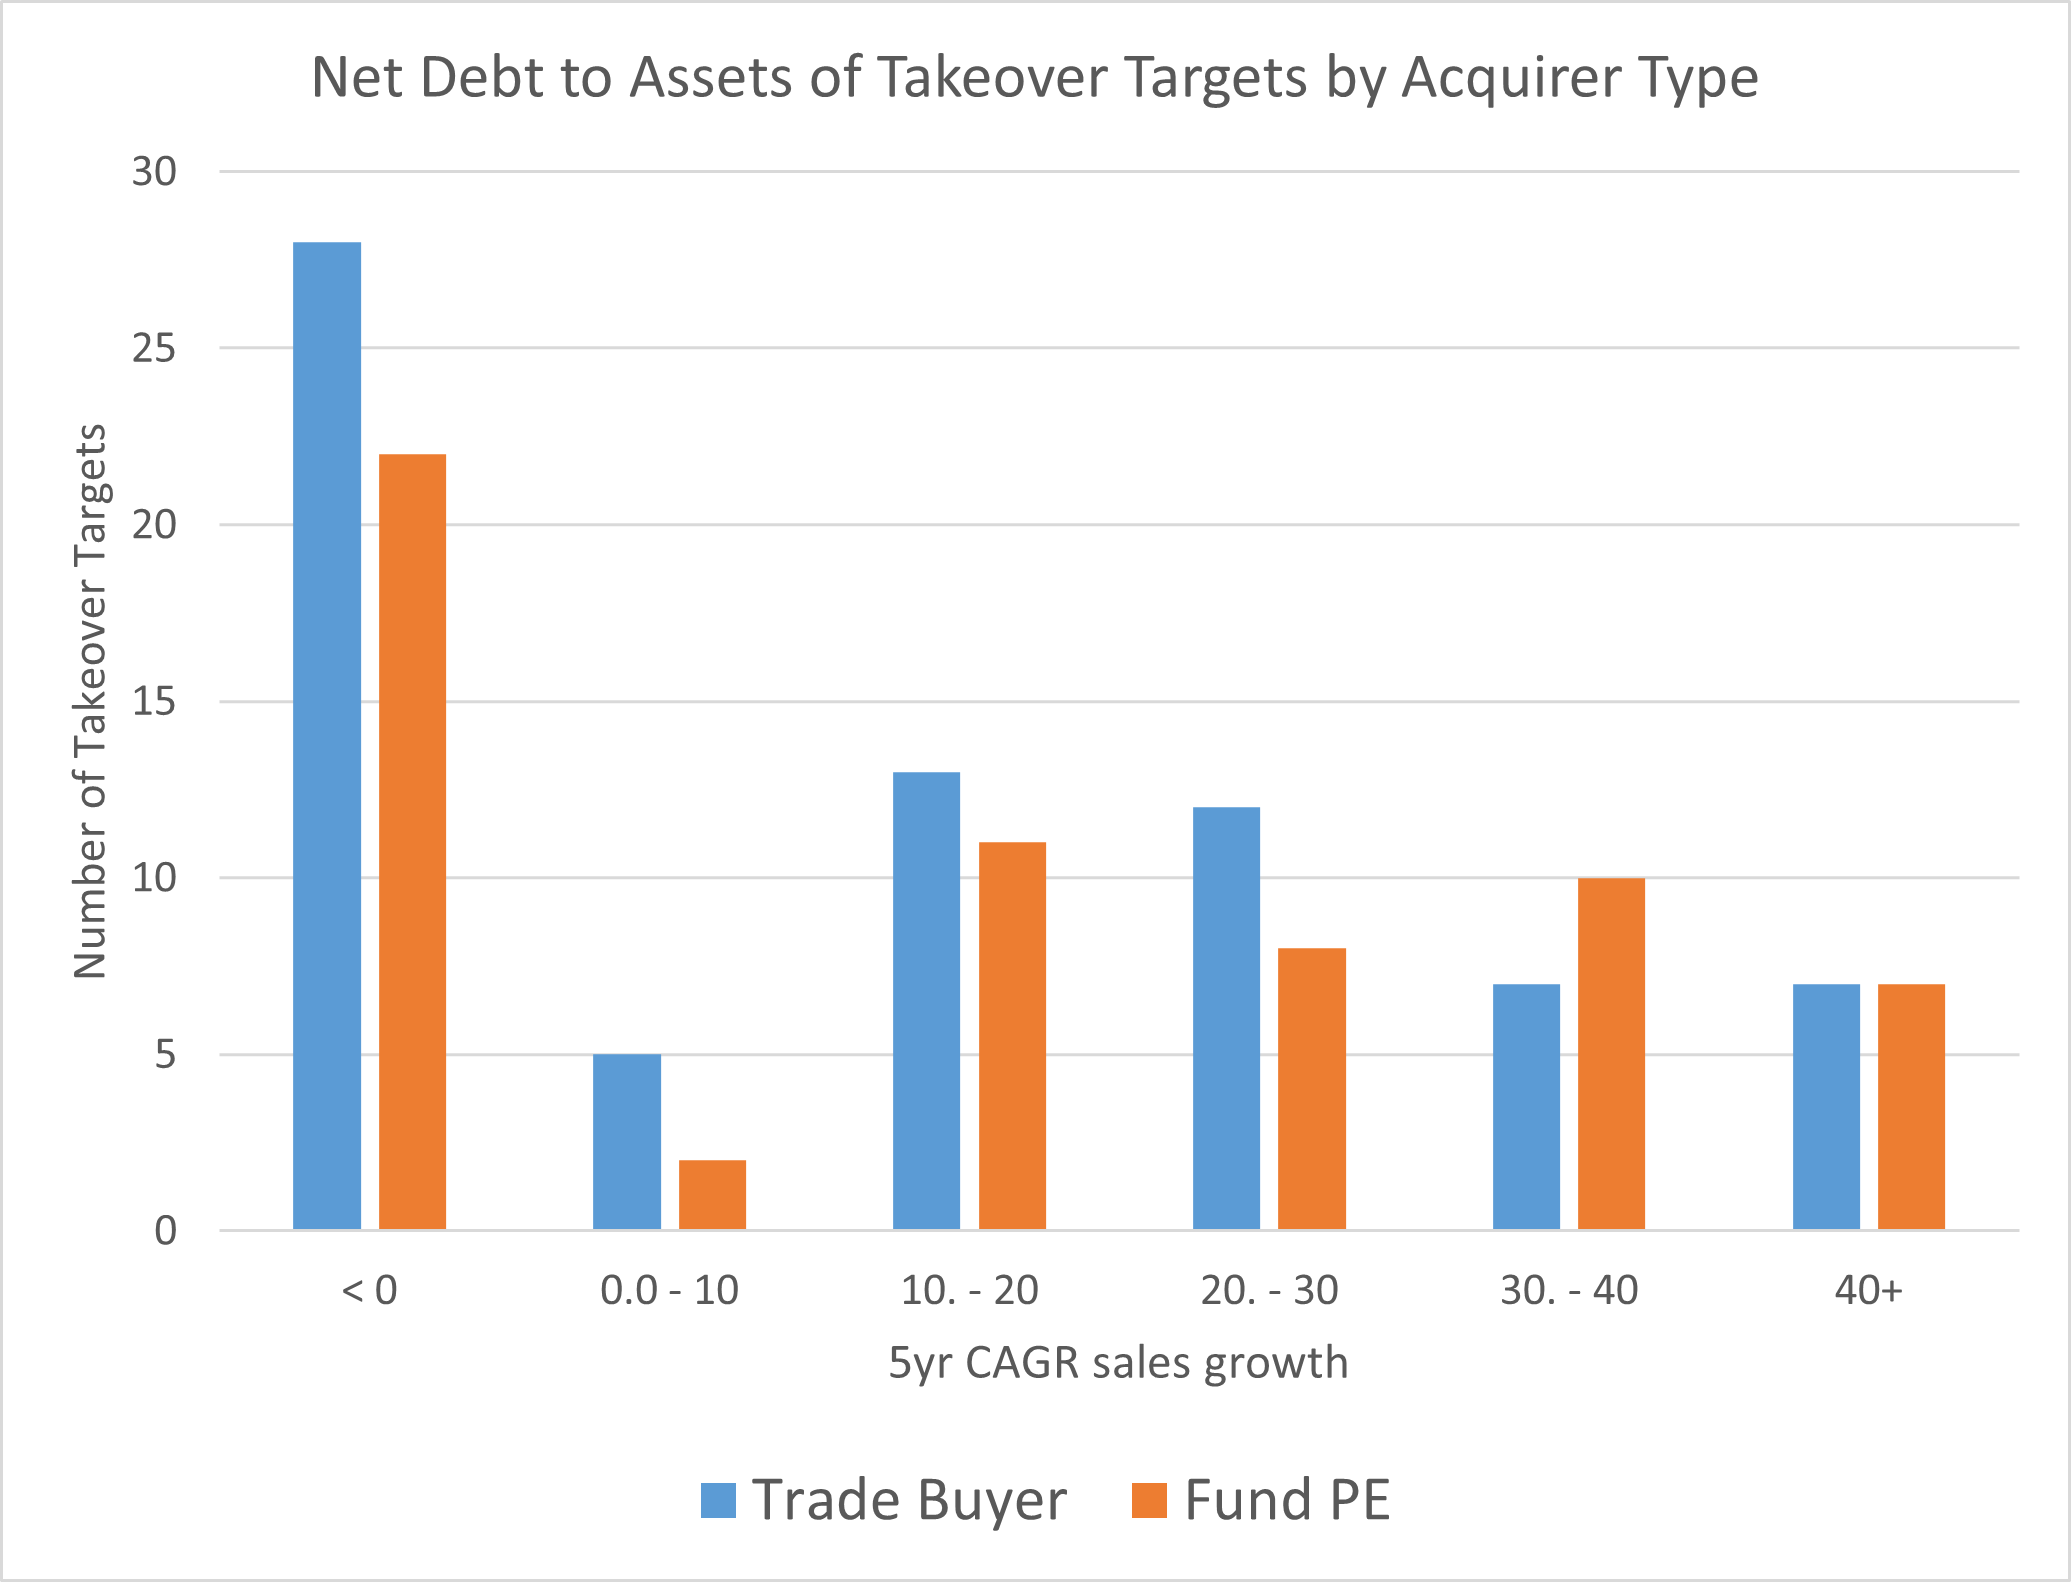
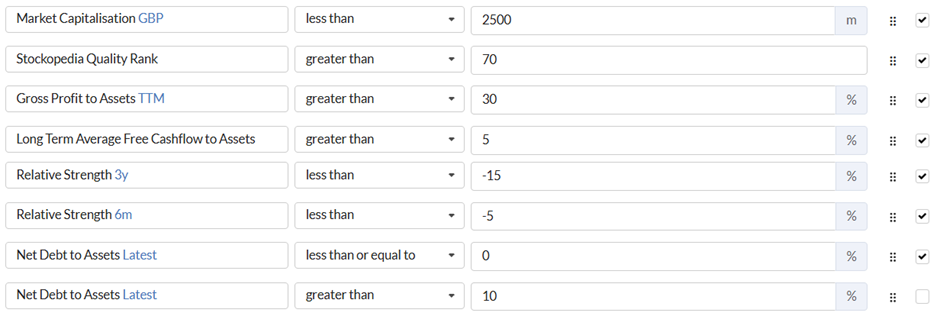
In order to reflect this in my screens, I need to have two criteria for this factor: less than zero and greater than 10%, and turn these on and off alternatively.
Price Action
There are some interesting patterns that emerge when we look at the relative price performance of takeover candidates versus the general market. Firstly, the idea that acquirers are attracted to a bargain bears out; 1-year and 3-year price performance is typically negative for the takeover candidates:
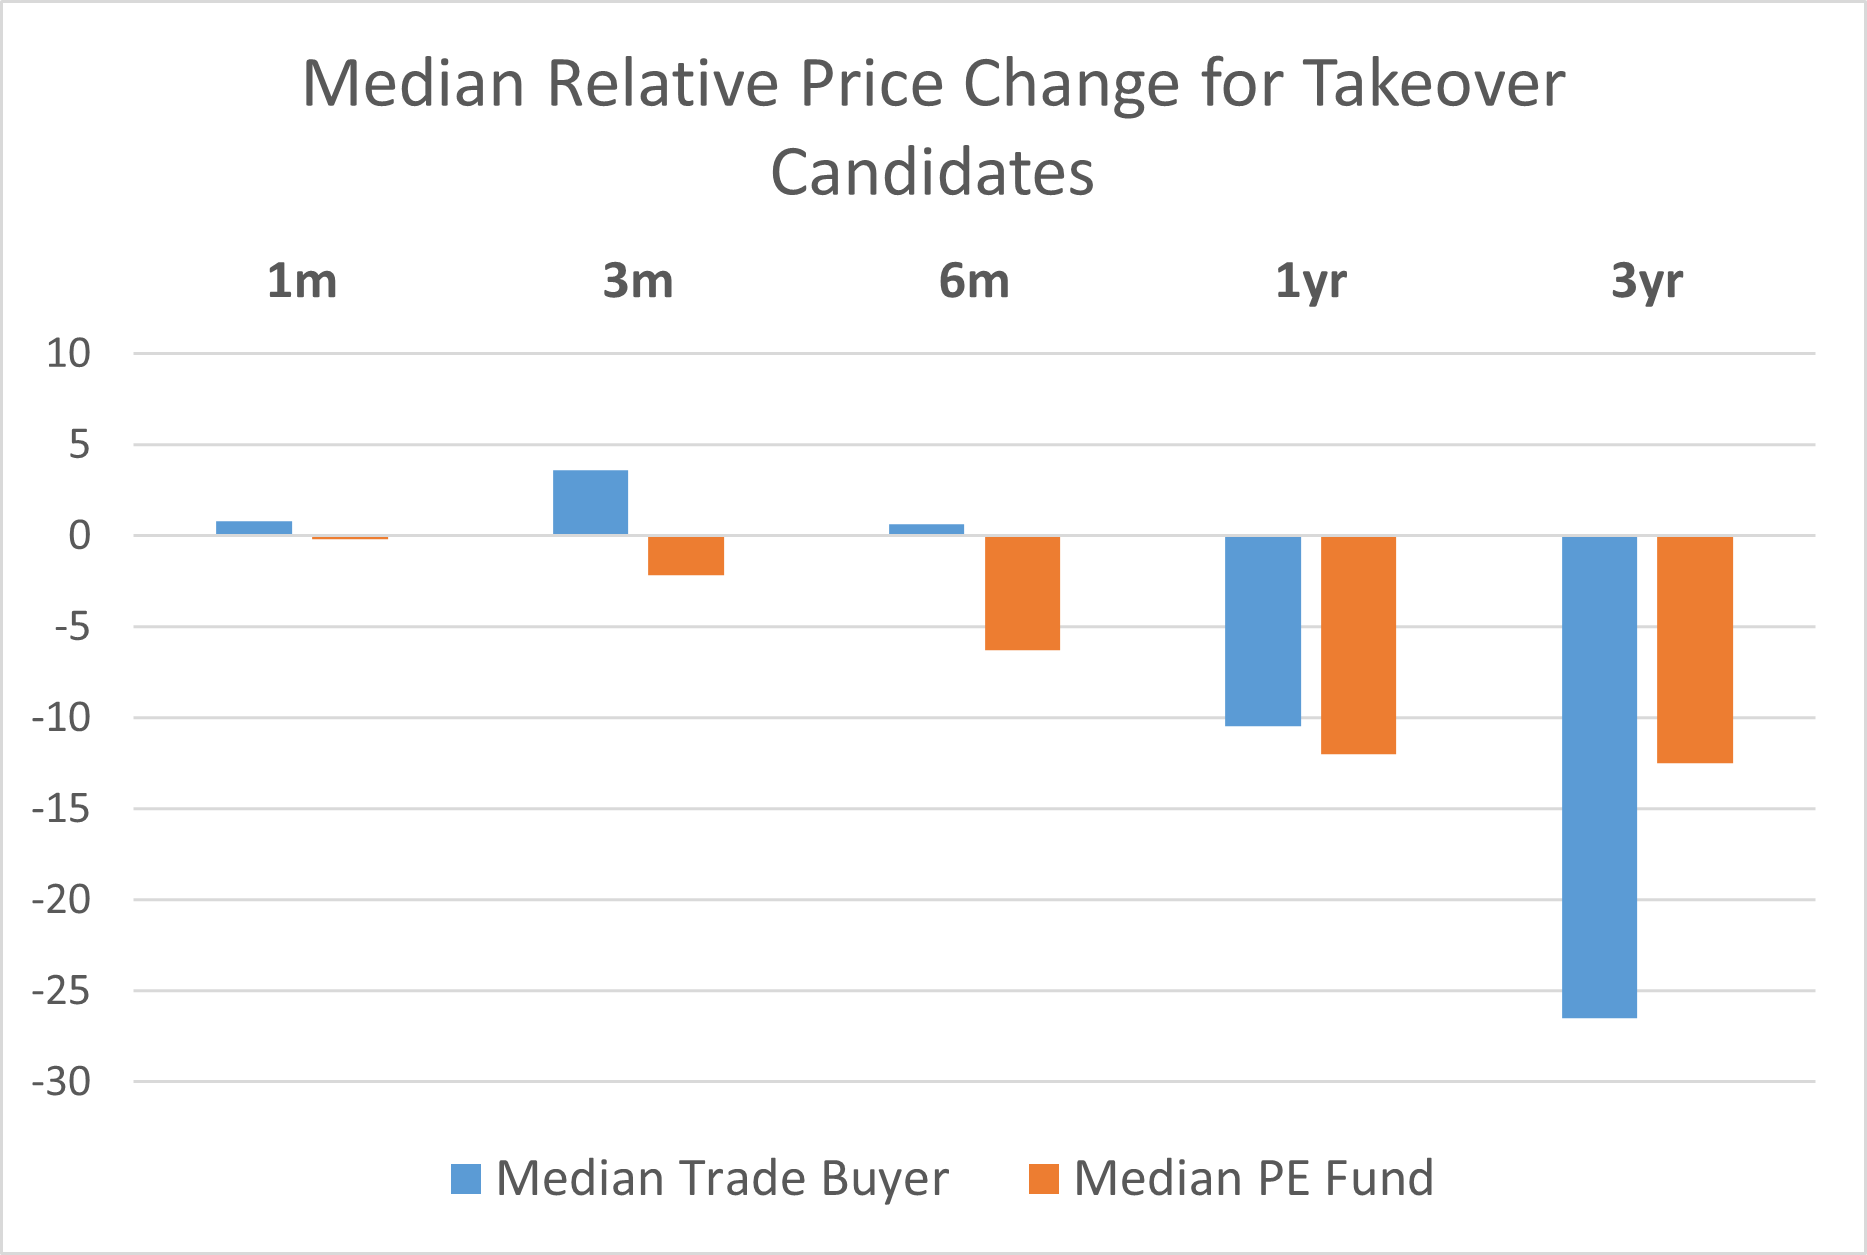
However, a different pattern emerges between Trade Buyers and Private Equity. On a three-month view, companies that receive a trade buyer offer outperform the market, whereas those that are attractive to private equity buyers continue to underperform. This is what Alex showed in his analysis last week:
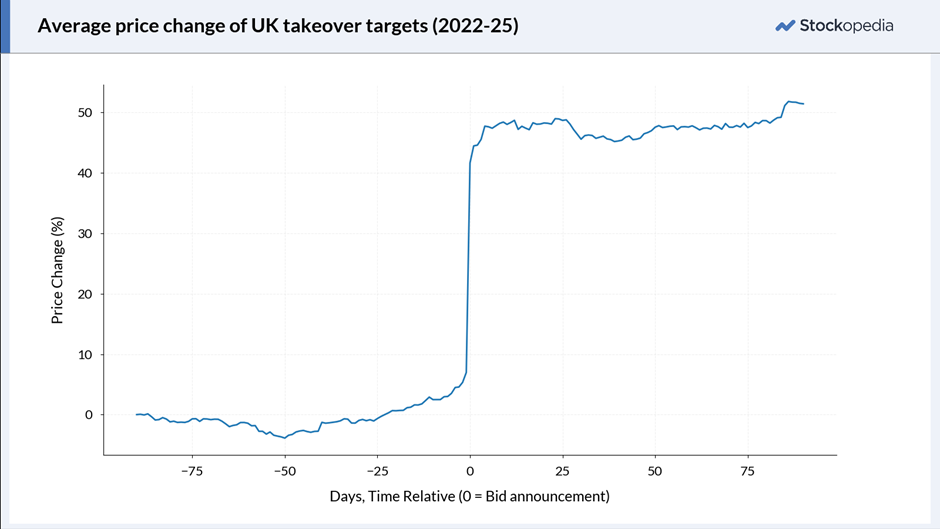
I see two potential reasons for this. The first is that Trade Buyers are more likely to bolster their position by acquiring shares ahead of their offer, and we are seeing this buying pressure. Secondly, there will be more people in the know about a trade purchase, meaning the chance of information leakage is much higher.
Whatever the reason, I am going to demand a -15% 3-year relative strength for both screens, but add the requirement that 3m price action should be +5% for Trade Buyer takeover candidates, and 6m price action should be -5% for my Private Equity screen.
Trade Buyer Screen
Putting all this together, here is what the Trade Buyer candidate screen looks like:
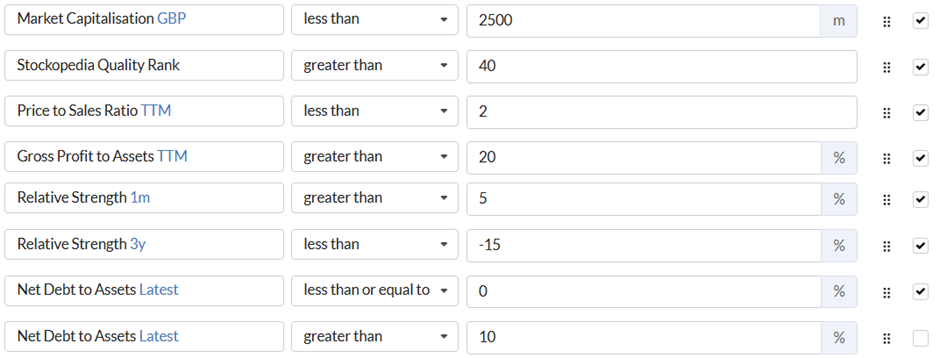
With this as the second variant:

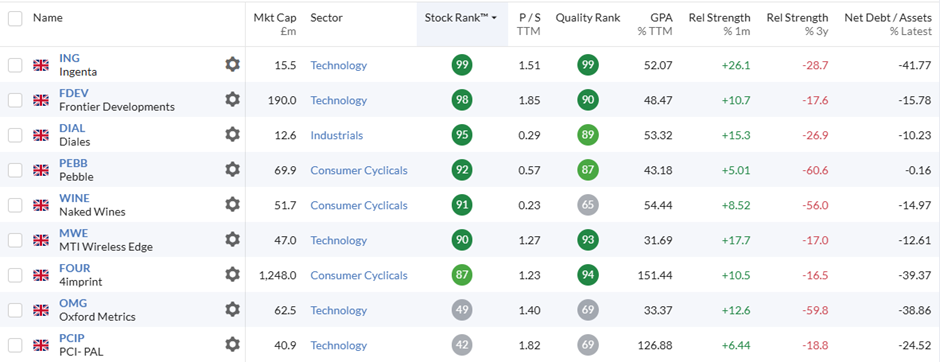
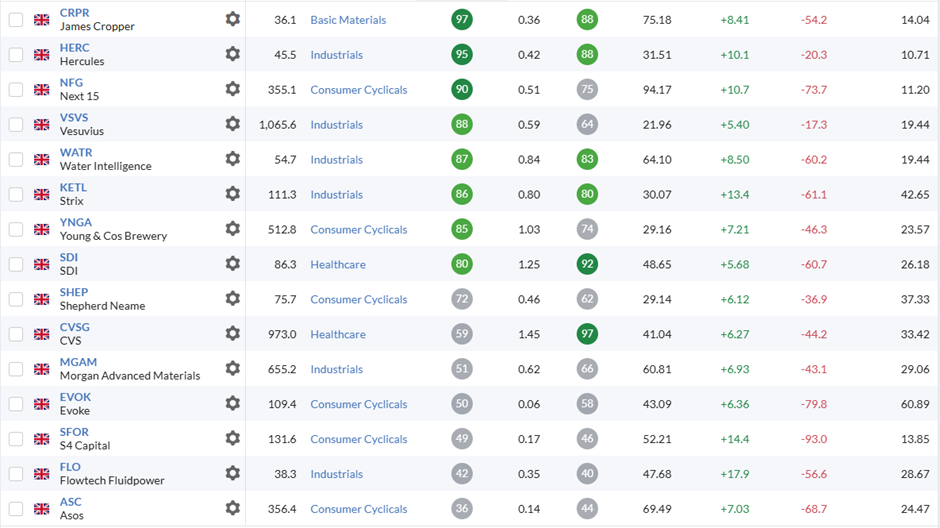
And here are the current screen results:
Private Equity Screen
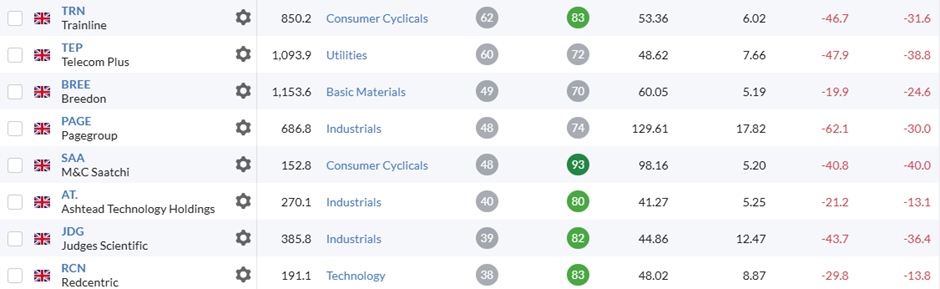
Running the Private Equity takeover candidate screen, I ended up with 39 results for the negative net debt to assets option and 36 for the net debt to assets > 10% option. This probably reflects reality; many companies could be taken over, and we should cast our net widely. However, I wonder if I should narrow the field somewhat by being a bit stricter on some of the criteria. Here’s what I came up with:
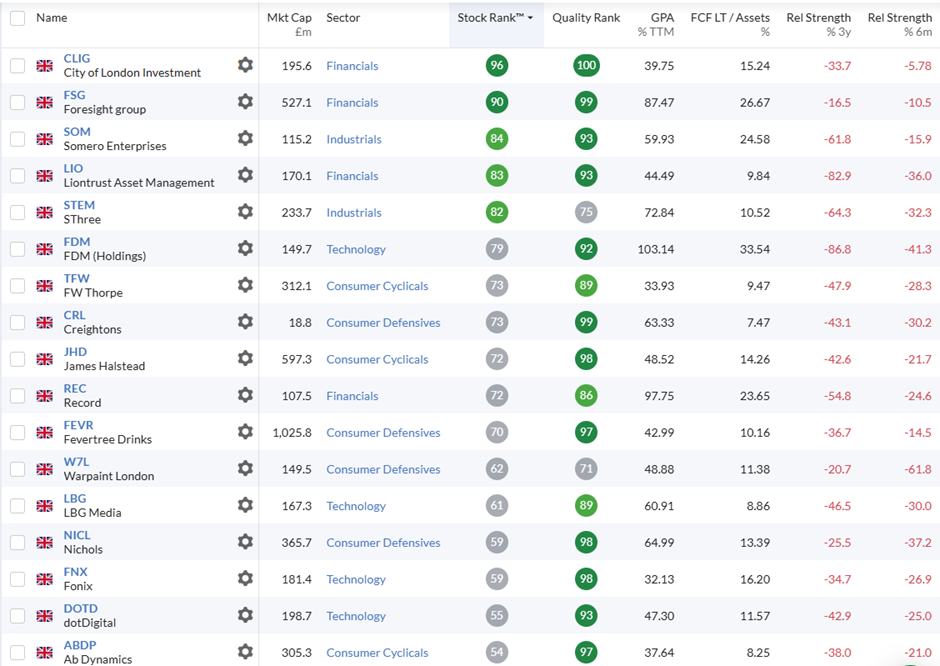
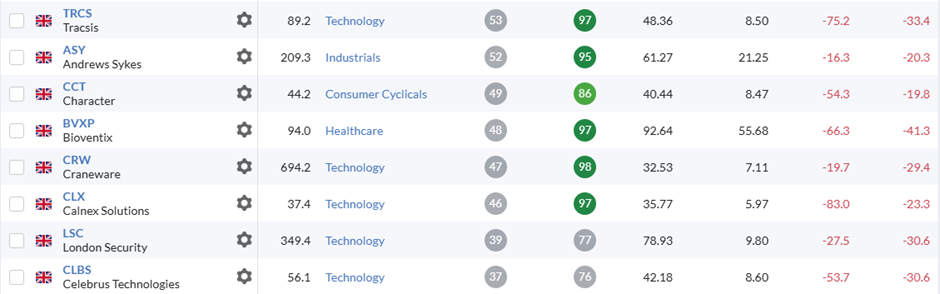
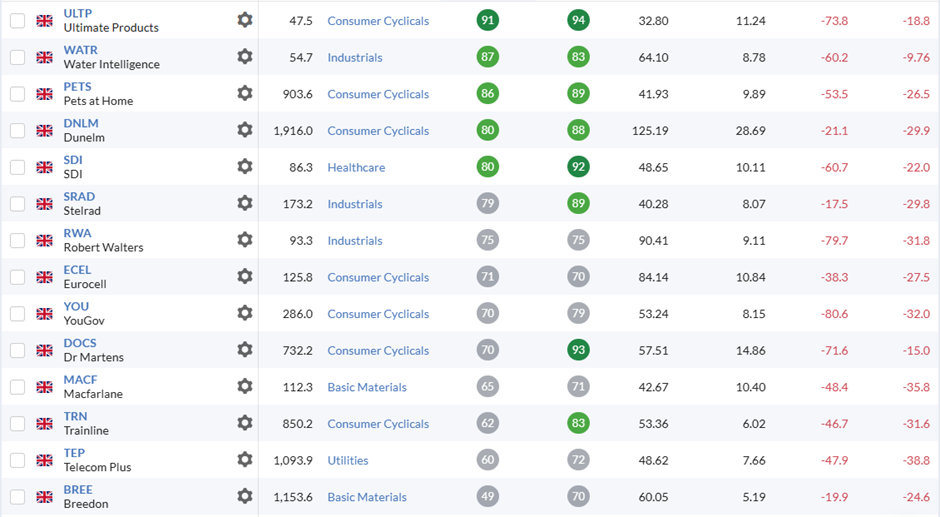
And here are the current screen results across both net debt to assets options:
Conclusion
I don’t think investors should jump into this list of stocks based on a screen alone (not least because it would be a very large portfolio). However, by screening for the types of stocks both trade buyers and private equity firms tend to prefer, investors are identifying the types of companies that are likely to be good long-term performers. And you never know; you could get lucky!
Addendum
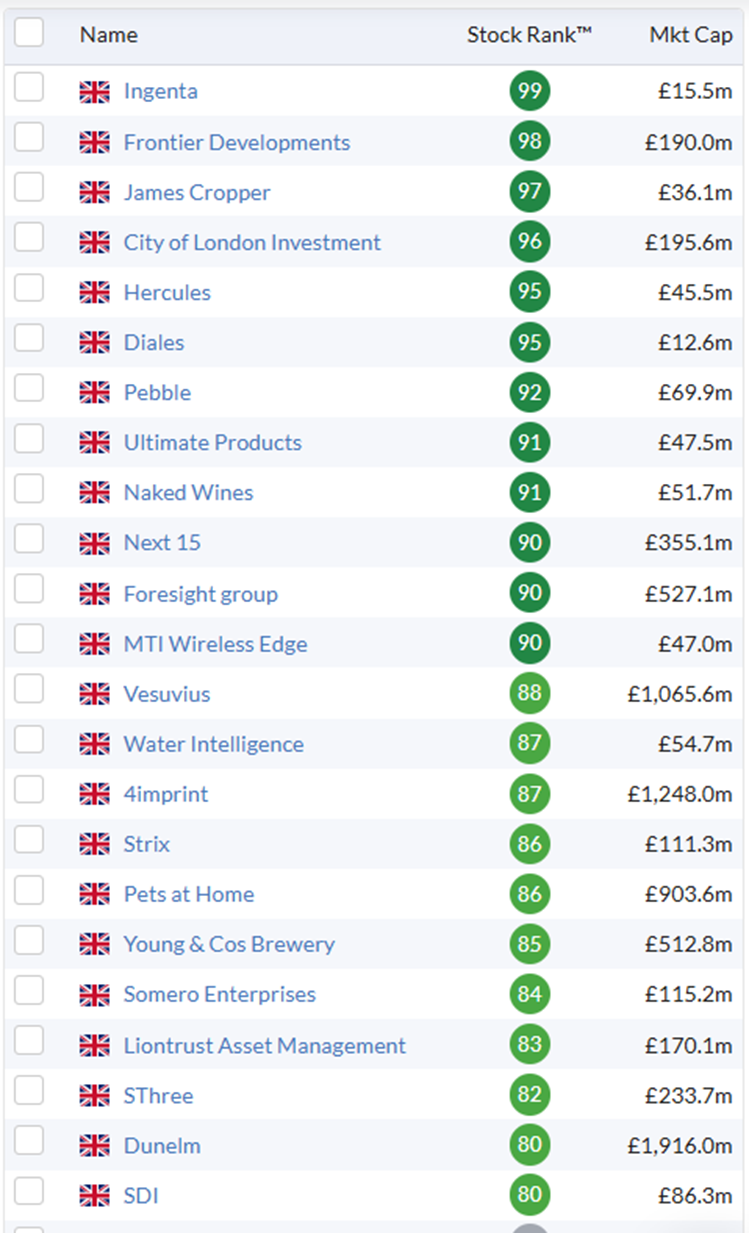
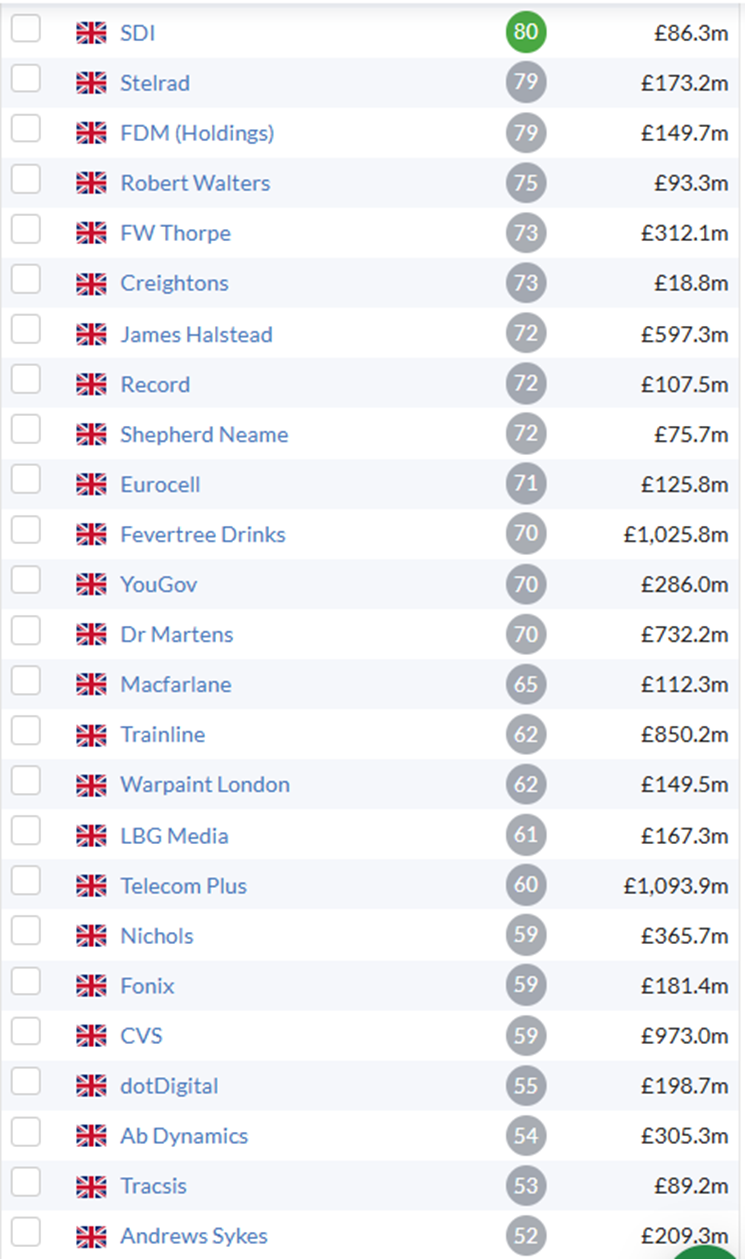
I’ve created a portfolio so I can track whether Alex and I are really onto something with this research, or whether we have been busy fools. Here’s the complete list:
[Disclosure: Mark owns shares in Ingenta]
Disclaimer
This is not financial advice. Our content is intended to be used and must be used for information and education purposes only. Please read our disclaimer and terms and conditions to understand our obligations.

9 comments
There are others ways. The takeover panel and rns 8.3. (Which is where firms already know the takeover is happening and trying to get in on the act)
The takeover panel will show firms that have made offers and have deadline dates. If rejected they have another 6 months to make a offer and process starts again . You can watch these and watch the form 8.3 and how much firms are betting for the sale. If rejected put a note in your calendar as in 6 months the same firm rejected may put in an offer
Although if another bidder puts in this 6 months is lifted.
The 6-month bar can be lifted if any of the following occur:
Another bidder announces a firm offer
1) Original bidder may re-enter.
2)Target board invites them back
Explicit invitation resets the restriction.
3)Material change in circumstances
Examples:
https://www.thetakeoverpanel.o...
e.g form 8.3 example where firms have bought
Form 8.3 – Position Opening Disclosure
BlackRock, Inc.
Holds 2.34%
Bought 150,000 shares at 312p”
Some firms hope a rival bidder will enter hence entering via for a form 8.3 where they may a small profit.
You can see 8.3 examples on investigate rns site by putting 8.3 , normally hundreds of entries
https://www.investegate.co.uk/...
Further to this there a chap on x called peter higgins (conkers) who had a incredible rate of takeovers.
https://x.com/conkers3/with_re...
Good article but I think a further aspect ought to be added analysing large shareholdings. If there are controlling stakes by families, owner managers or other Directors then it could be that the chance of a takeover could be minimal whilst the risk of being taken private on the cheap high
I guess another factor that should be testable and screenable for is major holdings. If insider holdings are over 50%, a hostile takeover will clearly not succeed, but I imagine also there's probably a more general relationship between concentration of holdings and a company's takeoverable-ness.
Hi grb,
I did think about this but couldn't think of an obvious screen or comparison. A big holding can go both ways - it can block an offer, or it can make it easier for one to succeed if the acquirer gets the major holder on board. Therefore, it may decrease the frequency of offers as the speculative ones are non-starters, but it may increase the premium or chance of one succeeding. Sadly, I just don't think we have enough, or the right type of data to fully test this assertion. That doesn't stop it being an intersting idea, though.
Cheers,
Mark
Though-provoking research. Many thanks.
Trying not to get too excited, as there a few of my current holdings in the lists. I don’t buy in expectation of takeovers, although they have averaged 1.6 pa over the lost 10 years, on a rolling average portfolio of 30 stocks, which seems to suggest that, perhaps more by luck than judgement, I’ve selected some which have proved to be of interest to purchasers.
Whilst not backed by solid evidence, there does seem, in my takeover successes, to be a strong bias towards stocks where there is not too much debt, relative to equity. Perhaps where there was an opportunity for the purchaser to fund the purchase, in part, with higher levels of debt.
Hi Chris,,
Thanks. Low gearing was certainly what I was expecting to find, so I was actually a little surprised when Alex found the opposite with his data. That's why I went into the details and in the data it seems that acquirers actually look for two types of stocks - the under-leveraged, where the takeover can be financed by borrowing against the acquistion, and the over-leveraged where the acquirer can use their balance sheet strength or lower cost of debt to add immediate value. Alex found some academic research that backed up that last assertion.
I, like you, would never own a stock purely as a takeover candidate, but I may hang on to a company for longer, or buy sooner, if I think there is the potential for an offer to come and generate a short term uplift in price. This is where I find this research most useful.
I also have a preference for net cash over debt, even if it is suboptimal some of the time, it gives optionality and safety that highly-indebted companies don't have. So I don't think it is surprising that we notice the big cash balance stocks getting offers, becasue those are on our radars. The data seems to suggest that both types recieve offers, we just don't tend to remmeber the highly-leveraged ones.
Cheers,
Mark
the portfolio link didn't work for me.
Ah, thanks. I guess portfolios are probably private. I'll remove the link. Thanks.