Fleas and Elephants

I first came to the thoughts in this post when I noticed that for the universe of stocks that I track, the median Quality Rank was about 63 rather than 50 as you would expect. So I decided to have a look at how the QVM ranks change with Market Cap, as my universe is limited to stocks with Market Caps over about £90m.
Jim Slater famously said that "elephants don't gallop" to describe the fact that share prices of large market cap stocks tend to move slowly. He later extended this by adding that "fleas can jump many times their own body height" to describe the behaviour of micro-cap share prices.
The implication is that small cap stocks and micro-cap stocks can provide much better returns than the blue chips. However this is a simplification of the true situation.
The distribution of Market Caps in the market: fleas, elephants and woolly mammoths
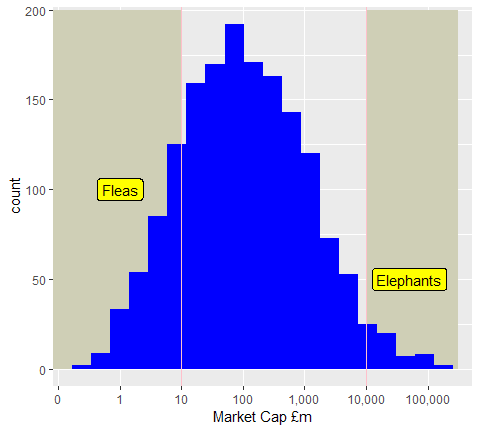
Slater defined an elephant as a stock with a market cap above about £5bn to £10bn and a flea as a stock with a market cap below about £5m to £10m.
These definitions correspond to the bottom 10% and top 5% of the UK stock market as you can see in the histogram. The elephants roughly correspond to the FTSE100.
This histogram has a log scale for the x-axis. Elephants are 1,000 to 10,000 times bigger than fleas.
The median market cap is about £100m. In other words, half of the companies have a market cap below £100m and half above £100m.
However because this is a log-normal distribution, if we ask about the balance of money across the market we get a different result.
If we ask for the market cap where half of the total value of the market is above that value and half below that value, it is at about £28bn. To put it another way, the top twenty stocks account for half of the total value of the market and the remaining 1600+ stocks account for the other half.
So half the stock market's total capitalisation is not even all the elephants. You just need the twenty heaviest elephants - the "woolly mammoths" of the stock market absolutely dominate a weighted index.
The question to consider is whether fleas really are a better bet than elephants. So now let's look at the Quality, Value and Momentum Ranks across the whole market and compute the percentile breaks based on Market Cap.
Value versus Mkt Cap
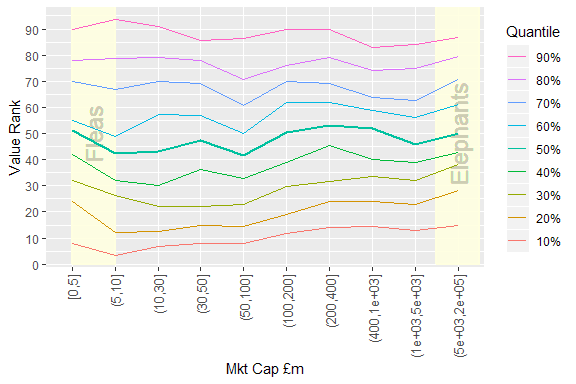
This graph and the following two can be a bit confusing, so to get your eye in, we consider the easy case first.
What we have here is a plot showing the 10% to 90% percentile values of Value Rank for given bands of market cap. The 50% percentile (median value) is made thicker so that it is easy to pick out.
The x-axis labels are using interval notation. For example, (100,200] means the interval 100 < x <= 200. I have added panels indicating where the fleas and elephants are along the axis. As before the axis is (approximately) logarithmic (and incidentally, approximately equal sized quantiles).
Because Value Rank is largely unaffected by Market Cap, the percentile points are roughly the same as the Value Rank values. You will find an even spread of Value Ranks in any subset of Market Cap. So this is the "control" plot. This is what we see when there is nothing much to see.
Quality versus Mkt Cap
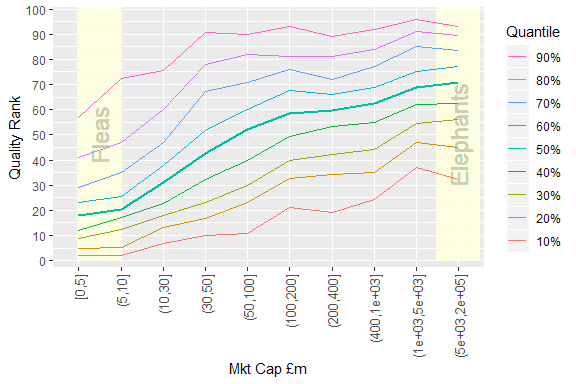
The picture changes significantly if we look at Quality Rank (QR) instead. The median line which should be at roughly the QR=50 level in fact passes through the 50 value at a market cap of about £100m. Below that size the median QR gradually falls below 50 and gets as low as 20 for the fleas.
Above £100m, the median line is flatter but there is still some increase. However for the largest subsets of Market Cap the main gain is that the lowest percentiles improve strongly. Really poor quality large caps are rare.
Momentum versus Mkt Cap
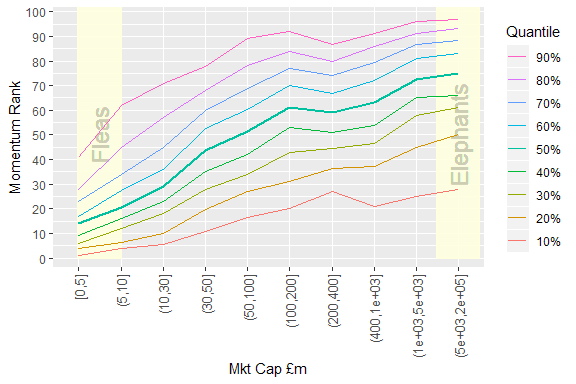
When we look at the Momentum Rank graph the overall shape is very similar to the Quality Rank case. The knee is present again at about £100m. High momentum fleas seem even rarer than high quality fleas.
Volatility versus Mkt Cap
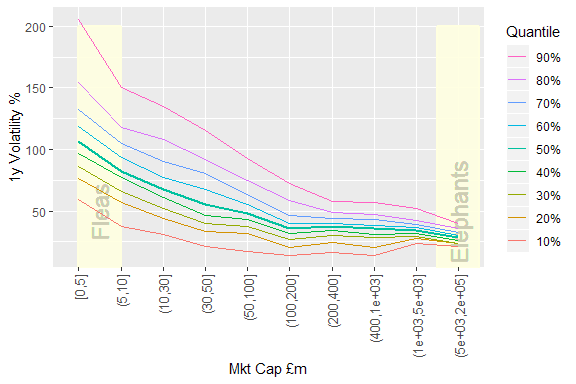
So why do the fleas and small caps in general seem to offer the possibility of very high returns? The answer is supplied by the Volatility plot.
"Volatility" is not a ranked metric. The values on the y-axis are the uninterpreted volatility values. What we see is that beyond £100m the median volatility and other percentiles are broadly flat although it does tighten up again beyond about £1000m. However below £100m things rapidly become "interesting".
I find a volatility above 50% to be difficult to cope with. This corresponds roughly with daily swings of 5% or more and yearly swings of -30%/+50% randomly superimposed on whatever underlying trend there might be.
When volatility exceeds 100% things get really wild. (In fact when volatility exceeds roughly 80% the mathematics of stochastic processes starts to suggest that you should be trading the volatility rather than the underlying trend to maximise returns - but that is a topic for another day!)
So fleas don't just jump; they also bite. Below £30m, it is a "foreign country where they do things differently" (to paraphrase a famous quote.) High volatility needs different trading styles and strong mental fortitude.
To be honest I was a bit shocked when I saw this plot. I expected an increase in median volatility as Mkt Cap reduces, but not to this extent.
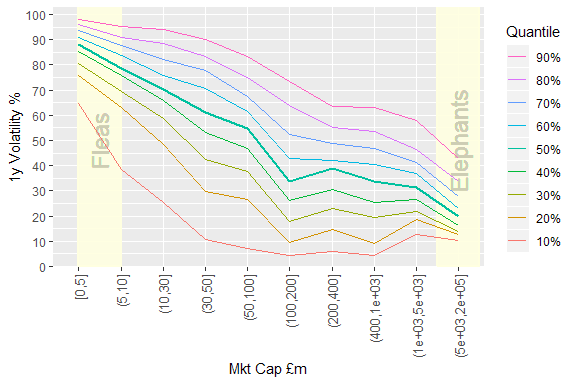
Just for completeness, here is a "ranked" version of the Volatility plot. The volatility values have been converted into a percentile value between 0 and 100 (although I have not reversed the numbers as Stocko would. So 100 is worst and 0 is best in this plot.)
I have mainly included this to make a point about ranked metrics. The same conclusions can be drawn but the plot maybe gives a different impression about how close or far away various values are. The lines are much less bunched up.
Using ranks provides a different perspective but it can be tricky to interpret correctly. This is something worth remembering when looking at Stockopedia's ranked metrics and wondering whether to use Q>75 or Q>90. A non-linear transformation has been performed on the data which might help you or mislead you!
Closing Thoughts
Most of the apparent advantages of fleas and small caps in general are due to the higher annual volatility.
- Factor investors will build in a useful edge by staying above £100m and maybe even above £200m. Bigger caps on average have higher momentum and lower volatility - what's not to like? There is no reason to apply an upper limit either. I used to avoid stocks over about £1bn but I no longer have an upper limit in my screens. If it is a good stock and passes the rules I keep it.
- Stock pickers (alpha seekers) on the other hand might prefer to look at small caps because there is a much wider range of performance on offer to be exploited. However a solid understanding of how volatility can mislead your impression of your abilities is very important in this domain. Stop losses also cease to be of much use when volatility goes over 50%.
Disclaimer
This is not financial advice. Our content is intended to be used and must be used for information and education purposes only. Please read our disclaimer and terms and conditions to understand our obligations.
10 comments
A really great, well structured article Nick (as ever). Thanks.
Your results kind of mirror my overall investing methods. Quality large caps for buy and hold. Smaller caps/younger companies to trade.
My 3 best stocks by far this year have been Beyond Meat, Games Workshop and Future. Beyond Meat especially has been been very volatile since its IPO and i've ridden it bearback (no stop in place), but with heart in mouth at times. Risk management has been via position size.
Best large Cap has been McCormick $MKC.
As always @Nick Ray your articles are amazeballs! And much appreciated
Many thanks Nick. Another very interesting post.
I’m wondering how this actually translates into the increase in share price. In other words, for equal QVM ranks is there a difference in share price performance versus market capitalisation? I think (don’t have any good data) that over the longer term (several years) when it comes to funds the average increase in small cap funds is higher than the average increase in whole of market funds.
Perhaps the performance ‘history of profitability’ data on the ranks menu gives us that at least in part.
Great article thanks.
I use a medium term NATR to filter out volatile stock, this generally presents large cap, but very often a small cap with good fundamentals pass the filter and have proven to be great selections.
Nick thanks for this - very interesting
As you say your analysis concludes that as a general rule as a buy and hold income investor you are best placed at the large cap space whilst those looking to make money trading stocks can gain most in the small cap space. . This further affirms the view that no one investing style is best it just depends what suits your personality and risk appetite.
Excellent article Nick. This echoes the feeling that I've had around small cpas for a while, your quantitative analysis has helped confirm my unstructured feeling.
I've used volatility as one of my 'litmus' tests when checking shares before buying. But I'd not noted the strong correlation with very small stocks. My threshold has always been around £50m, but your analysis suggests better returns could be seen by increasing that threshold. I'll take a look through the last 2 years worth of trading records and see how this looks.
Thanks for the insightful thoughts.
Hi Nick
Very informative posting, thank you.
I have been pondering volatility for a while now.
Your posting has prompted me to create a screener using BETA and Volatility % tests to incorporate into my screening procedures.
I will be intrigued to re-test my current holdings against these. I think I might be surprised to see where my current screening regime has led me with regard to the distribution of volatility across my holdings.
Many thanks for the inspiration.
Regards
Howard
Thanks Nick, I found this very interesting.
Taking your final point about stop-losses, I'm not sure I follow why this is the case. If one were trading the volatility (either instead of, or while investing in the underlying trend), then wouldn't a reasonable stop-loss make sense to reduce the risk that the volatility swings are against your last trade?
I don't try to trade volatility of any of my holdings, so this is an entirely academic question.
The problem with stop-losses on very high volatility stocks is that swings of +/- 20% or more are "normal". You just have to live with them.
Trading volatility actually works in the opposite way. You buy more when the price falls and top-slice when the price rises. It will fail very badly if the price keeps falling and never rises (enough).
But for certain kinds of microcaps (especially ones sitting on large cash piles and no debt which periodically ramp themselves shamelessly) it can work. However it is very risky.
Thanks Nick