Gearing up to fail - how debt impacts struggling companies

In my last article, I looked at companies that were recent poor performers in order to identify the characteristics that investors should avoid in the current markets. I concluded that investors would be best served by avoiding highly-priced companies with declining prospects or significant debt, companies not fully funded to cash flow break even, or those involved in the latest market fad. One contributor commented that they expected debt to feature more highly. While this was a factor in the large fall in the share price of XP Power (LON:XPP) , it wasn’t a prominent feature of the other large monthly fallers. This is likely to be due to the small sample size, and I would expect debt to feature in many future fallers. Therefore, I thought it would be worth looking into the topic in more detail.
Gearing
There is a reason that debt in the capital structure of a company is known as leverage or gearing. In the same way that a lever or gear provides mechanical advantage and can multiply the force applied, debt means that the returns to equity are exaggerated. Debt itself is not bad. Indeed, corporate theory suggests that having an amount of debt on the balance sheet is ideal for most companies. The reason is that debt interest is a tax-deductible cost, so companies that hold debt will pay lower taxes.
The problem with debt comes if it is excessive or if future corporate trading is highly uncertain. If a company has not yet reached a sustainably positive operating cash flow position, then having debt on the balance sheet is almost always unsuitable. The reason is that it puts an external time limit on when cash flow profitability needs to be reached. Therefore, new or blue-sky companies should always be fully financed through equity, not debt. As investors know, things rarely go smoothly and within the timeframe an enthusiastic management expects.
Gearing has a specific meaning in finance: a company’s debt-to-equity ratio. Stockopedia actually provides six ratios:
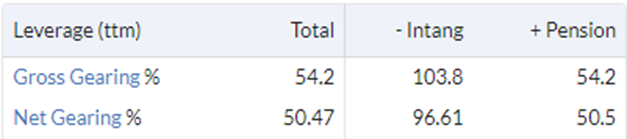
Gross gearing takes the total debt levels, whereas net gearing takes the net debt. Then there are two versions, including and excluding intangible assets. Finally, the third version treats the accounting version of any pension deficit as debt and includes this in the calculation. I wrote more about adjusting for pension deficits here. Which metric investors use perhaps isn’t as important as the story they tell. If there is a big difference between gross and net gearing, investors will want to understand why. If there is a pension deficit, investors may want to make their own adjustments to financial figures. A large difference when intangibles are excluded may lead an investor to consider how realistic that intangible valuation is. When screening for companies, I tend to use net gearing including intangibles and pension deficit. What an acceptable level is also depends on the type of company. For example, a quick screen of highly geared companies includes some utilities whose stability means they can bear significant debt:
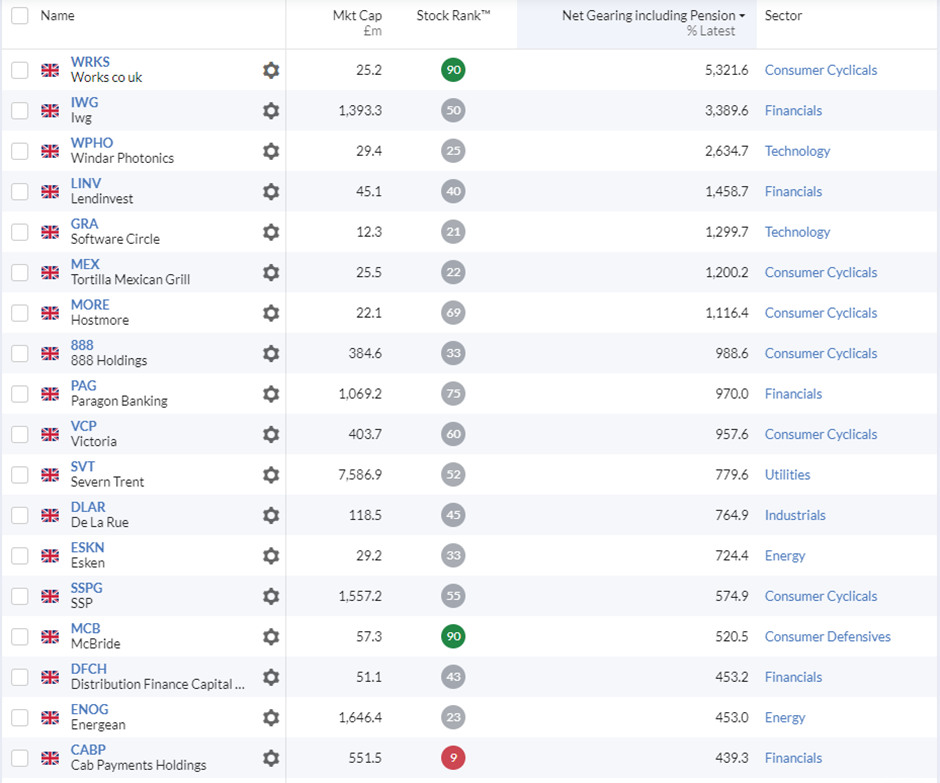
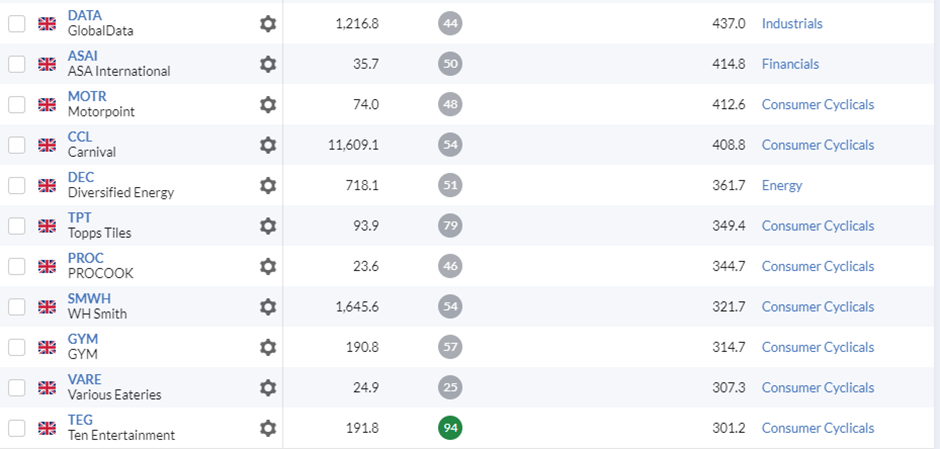
Stockopedia also uses gross lease liabilities, which is why a number of retailers appear on this list. This may not necessarily mean these companies are at risk of insolvency, but as I explain below, it highlights the double risk that retailers face if they see significant declines in sales.
The screen does find a number of companies where the size of the debt means that the equity is likely to have negligible (or at best option) value, such as Hostmore (LON:MORE), De La Rue (LON:DLAR) or Carclo (LON:CAR) . Here are the leverage ratios for Carclo (LON:CAR) :
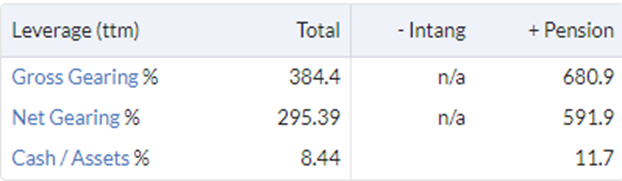
This company continues very much at the behest of its bankers and pension trustees. Gearing is a blunt tool, but one investors may want to keep in their toolbox.
Average Debt and Window Dressing
A look at just bank debt may not give the whole picture. The published balance sheet is just a snapshot at a point in time. Companies know this, and they can engage in what is colloquially known as “Window Dressing”. Companies may choose to pay suppliers a little later or chase customers for faster payment around this time since this will flatter their cash balance and, hence, net debt. Even if they don’t intentionally window dress, many companies choose their balance sheet date at a high point in the cash cycle. It is no coincidence that many retailers have a 31st January Year-End, not 31 December. The best companies provide average net debt/cash figures for their accounting period as well as at their balance sheet date. Even If a company doesn’t provide this figure, investors may be able to spot higher average net debt levels by looking at the interest paid during the period. If the interest rate paid on debt is higher than expected, this is likely to mean the average debt level was much higher during the period than at the balance sheet date.
The other way to assess a company’s financial health is through an analysis of its current assets and liabilities. To do this, Stockopedia also provides a popular financial ratio called the Current Ratio.
The Current Ratio
The Current Ratio is the ratio of current assets (cash, inventories, receivables, etc.) to current liabilities (short-term debt, payables, etc.). Stockopedia codes this ratio green, amber or red depending on how it compares to similar companies in the market:
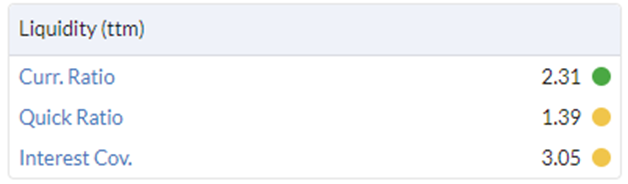
The idea is that a company needs a buffer so that if a customer delays payment or inventory movement is slower than expected, the company will not run out of cash. Generally, the higher the Current Ratio, the more able a company is to keep creating its products and paying its suppliers without overly relying on their banking facilities or supplier terms.
One of the challenges for an investor is that what represents a secure Current Ratio can vary from industry to industry. Retailers, for example, can trade successfully for years with negative working capital (and therefore a Current Ratio of less than 1) because they get paid by customers immediately and pay their suppliers on 90-day terms. Here are the ratios for Tesco (LON:TSCO) , for example:
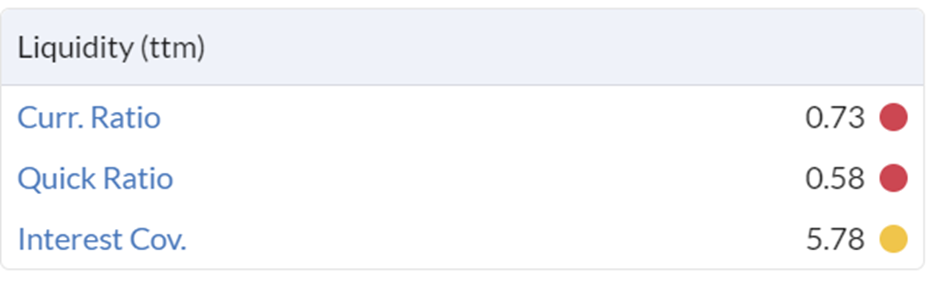
In normal trading, this low Current Ratio doesn’t mean the Tesco (LON:TSCO) is a distressed business. While a retailer is growing, this situation can be maintained indefinitely. However, investors need to be wary of retailers with falling sales. The unwinding of the negative working capital will cause negative cash flow at just the time the business is struggling. A sales decline for retailers with low Current Ratios, high debt, and/or lease liabilities is particularly ominous.
Software companies are another type of business where a Current Ratio of less than one doesn’t necessarily indicate distress. This is because customers pay upfront for software licenses. Here is Instem (LON:INS) , for example:
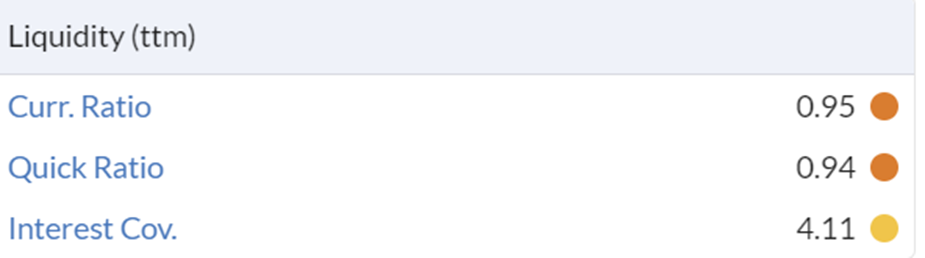
The low Current Ratio has not prevented them from receiving a takeover offer recently. Again, software companies that receive upfront licence fees can continue to generate cash from working capital as long as they grow. It is the ones where sales are falling that should be of concern.
The Quick Ratio is a similar calculation but only includes assets that can be quickly converted to cash. Prepaid expenses and inventory are excluded as those may not be as easily convertible to cash or may require substantial discounts to liquidate. This means a Quick ratio will always be lower than the Current Ratio. Again, what constitutes a safe value may vary, but it is worth doing more in-depth research if the Quick Ratio appears unusually low.
For trading companies, a Current Ratio of below one almost always indicates something to be wary of. For example, on 31 December 2021, Beeks Financial Cloud (LON:BKS) current balance sheet looked like this:
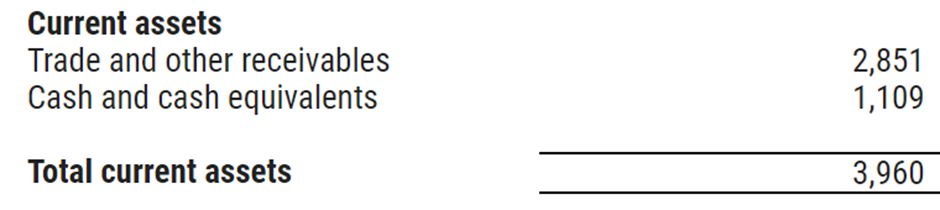
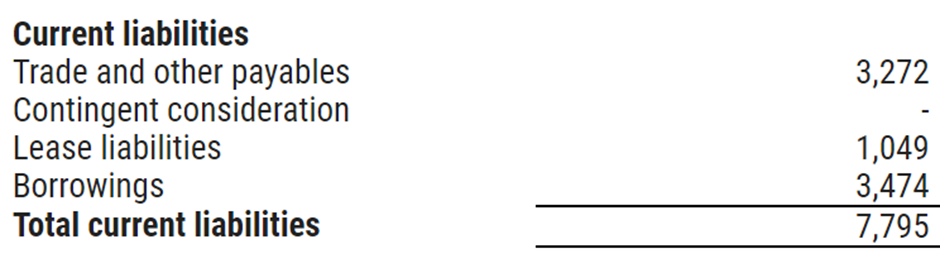
It is unsurprising that the company needed a placing in April 2022. Of course, in this case, Beeks Financial Cloud (LON:BKS) had no problem raising equity capital and did so at a minimal discount. However, not every company with this sort of balance sheet will be so lucky.
By using these ratios, investors can better understand the risks that debt poses to a company and hopefully avoid companies where the share price will react precipitously to any short-term setbacks a company faces. In next week’s article, I will look at some further topics around debt and financial risk.
Disclaimer
This is not financial advice. Our content is intended to be used and must be used for information and education purposes only. Please read our disclaimer and terms and conditions to understand our obligations.

5 comments
You have an excellent straightforward writing style. Thank you for the article.
A very timely and excellent article ,thanks Mark, great to have a refresher.
My general approach is to be wary of debt in companies as I would be in managing my own affairs, a certain amount may be useful and even necessary but not so that one can't sleep at night! However I'm particularly interested in, for example, bricks and mortar retail and hospitality stocks, where trading is often dependent on lease of premises. Accepting that as given, I rather wish Stockopedia were able to show debt both gross and net of lease liabilities, there's no harm working it out for oneself but something I'd like readily available especially for screening purposes.
Very clear and interesting article Mark, thank you.
I also think that this is an important topic for small cap investors. A share which I sold earlier this year was SDI (LON:SDI) , whose net debt progressed from £-0.587m to £20m between 2018 and 2023. The share price reacted accordingly.
It should have been obvious to the board that interest rates could not stay ultra low for ever, and that a sustainable level of debt would rapidly become unsustainable.
I think this is a salient topic in current markets - thanks Mark. After a period of largely uninterrupted falling rates where having debt on the balance sheet was an advantage, a period of rising and/or more volatile interest rates makes this sort of balance sheet analysis more important. My view is it might not help to pick shares that go on to appreciate significantly but it will help one to avoid (as far as possible) the zeros and huge losers. It is even more important for smaller companies because banks are much less concerned about putting a smaller company under than a larger one.