Guru Strategy Review Q2 2016: Defensives win as turmoil strikes

Stockopedia’s 60 Guru Strategies inspired by legends of finance endured a rollercoaster end to the second quarter of 2016. There have been reasonable results from some of the methodologies, but on average it has been a disappointing quarter for them. And things got a whole lot worse in the final week of the first-half as the EU referendum result threw equities into chaos.
The UK’s decision to leave the EU caused instant volatility in parts of the market. It cast a particularly dark shadow over cyclical stocks with any hint of reliance on European trade or domestic consumer confidence. Some of the biggest losers were banks, builders, retailers, recruiters and airlines. On the flip-side, defensive stocks (especially those blue-chips that earn a good chunk of profits from foreign markets) fared a lot better.
London’s main indices all fell sharply straight after the referendum. But as investors absorbed the news, there were areas of improvement. How the UK economy will be affected by the decision over the longer term is uncertain, but that hasn’t stopped the FTSE 100 recovering lost ground and reaching new highs for 2016. That was driven by a number of global corporations which effectively benefit from a lower valuation of sterling and are less reliant on the domestic economy.
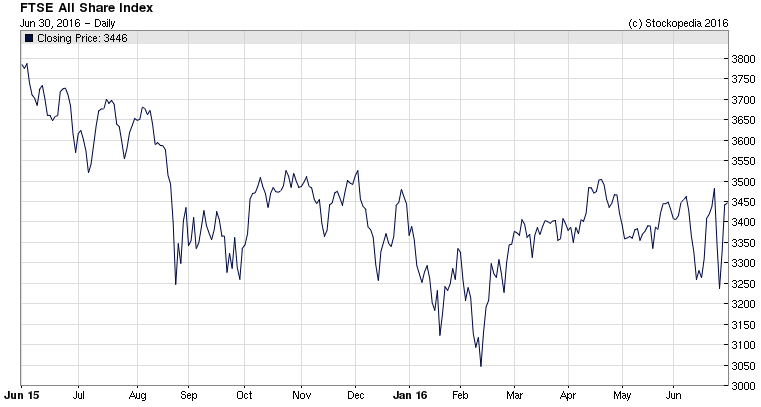
By association, the FTSE All Share (above), which is a cap weighted index representing the FTSE 100, 250 and SmallCap, shows very little amiss bar some recent sharp price swings. This is partly down to heavy weighting of large cap stocks in the index. Out of 636 constituents in the index, the top 10 on a market-cap basis represent nearly 31.8% of it. A better guide to the impact on domestic stocks is the FTSE 250 mid-cap index. But even here, some of the sharp immediate losses have been clawed back, albeit at a slower pace.
How the guru strategies performed
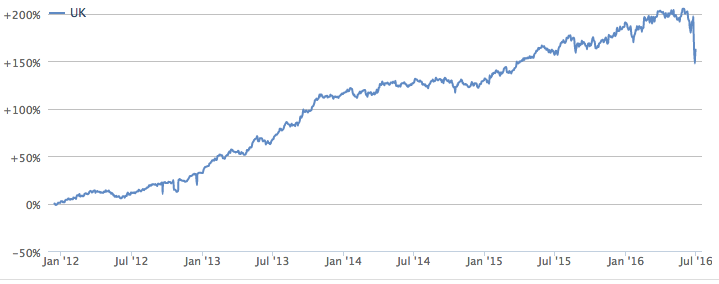
Before taking a look at how the guru strategies got on in Q2, it’s worth having a quick recap on how they work and what the performance stats tell us. Since late 2011, we’ve been tracking the returns from a range of approaches used by some of the world’s best known investors. Each one is categorised as either Quality, Growth, Value, Bargain, Income or Momentum. They’re rebalanced quarterly to ensure that the the shares in each portfolio match the rules of each strategy as closely as possible. We don’t account for the drag of trading costs or the bonus of dividend payments.
These models aren’t always realistically investable. At times, there may be very few companies that meet the rules of some of them. And because there are no restrictions on company size, sector or index, there’s no simple way of benchmarking them. So we show the FTSE 100 for the sake of comparison rather than as a meaningful benchmark.
| Index / Strategy Composite | Performance Q2 2016 |
| FTSE 100 | + 5.3% |
| FTSE All Share | + 3.6% |
| FTSE 250 | - 4.5% |
| FTSE SmallCap XIT | - 5.6% |
| AIM 100 | + 1.5% |
| Guru Strategy Composite | - 6.9% |
| Bargain Composite | + 1.5% |
| Momentum Composite | - 4.8% |
| Quality Composite | - 7.0% |
| Value Composite | - 7.0% |
| Income Composite | - 7.5% |
| Growth Composite | - 11.9% |
Key observations
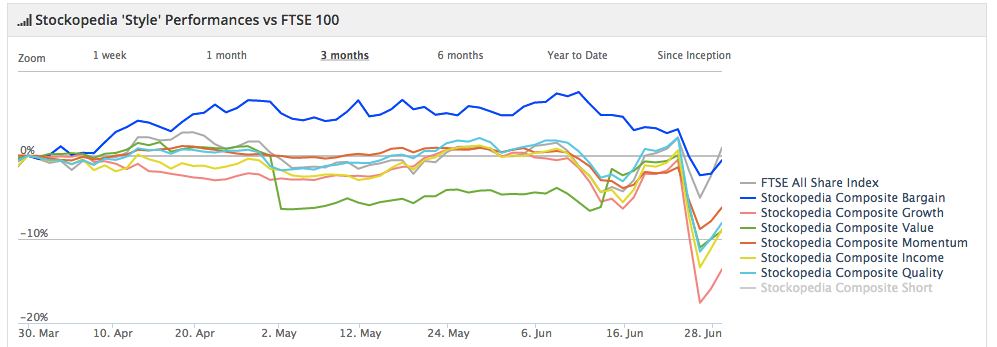
From a style perspective, it was the deep value Bargain strategies that just edged a positive performance through the first half of the year. During the quarter, the Free Cash Flow Cows screen managed a 12.8% return, followed by the Charles Kirkpatrick Bargain, up 10.5%. The Kirkpatrick strategy looks for price momentum and uses price-to-sales as its core valuation measure. There were big winners and losers in the portfolio but positions in mining companies Hochschild Mining, Anglo American and Highland Gold drove the outperformance.
On that subject, we mentioned in the Q1 Strategy Review that a resurgence in the natural resources sectors, particularly mining, was proving to be a real boost to Bargain and Value strategies. That continued in the second quarter, with some oil companies and gold miners seeing their prices rise strongly on the Brexit vote. They may well continue to be attractive to investors seeking some respite from cyclicals that are more sensitive to the UK economy.
Another interesting point in the aftermath of the referendum is that we’re now seeing some big names falling into some Bargain and Value screens - especially housebuilders and construction related firms. For instance, builders like Persimmon and Bellway and materials suppliers like James Latham and Abbey all find themselves in the deep value Ben Graham Defensive strategy. In fact, most of the big builders have been liberally sprinkled around the Value strategies as a result of their sharp price falls. We haven’t seen anything quite like that since late 2011 - and it goes to show just how sensitive housebuilders can be when the economic outlook takes a turn for the worse.
Among the Value strategies, the Piotroski F-Score Price to Book Value screen finished the quarter with the highest return, at 19.1%, although the portfolio was fairly thin and dominated by micro-caps. By contrast, the James O’Shaughnessy Cornerstone Value strategy offered a much more diversified portfolio and managed a reasonable gain of 7.2%.
Growth strategies stall
Unsurprisingly, it was Growth and Quality strategies that took the biggest hit after the referendum. You now need to take a one year view to find any growth strategy with a positive return - and that’s the Jim Slater Zulu Principle strategy (up 5.2%). Broadly speaking, most growth-oriented screens target smaller, more exciting businesses. But where there are high growth expectations, any dent in the outlook is likely to see the shares marked down heavily. Again, this is exactly what has happened.
The Slater portfolio came under severe pressure during the quarter, with a couple of exceptional gains at Paypoint and British Polythene Industries, which was acquired in June by RPC in a deal worth £261 million. Slater would no doubt have taken some consolation in the fortuitous timing of that move.
Elsewhere, the only clear achiever among the Momentum strategies this year has been the Earnings Upgrade Momentum screen, which saw a 7.3% return in Q2. One of the worst has been the Richard Driehaus screen, which is down 17.7% year to date and struggling to find stocks that meet its criteria.
There are some interesting patterns emerging in the Momentum strategies, which tend to point to current trends in investor sentiment. For instance, the 52 Week High Momentum screen is now dominated by blue chip FTSE defensives, many of which have soared as investors look for safer havens. The Earnings Upgrades screen will also be one to watch as analysts spend the coming weeks figuring out how the EU vote will impact on earnings outlooks. At the moment, mining features heavily in that screen, but other sectors may emerge.
Mixed results from dividend strategies
Income strategies produced some mixed results during the quarter, which reflected what went on in the rest of the market. The Winning Growth & Income strategy, which has been a strong long-term performer took a serious tumble in Q2 (down 13.0%). As the name suggests, this strategy looks for above-average dividends in growing companies - and that’s where the problems started. The portfolio took severe hits on positions in housebuilders like Berkeley and Galliford Try and the recruitment firm, Interquest among others.
By contrast, there was a much more robust performance by the popular Dividend Dogs of the FTSE strategy. After a terrible 2015, this year has seen the strategy return 24.0% before dividends, with a 12.9% gain in Q2. We’ve questioned the strategy rules in the past for leaving it prone to being overweight certain industries like mining, oil and supermarkets. But it proved to be an advantage in the second quarter, with holdings in BHP Billiton, Rio Tinto and BP saving it from the type of sharp reversal we saw elsewhere. Currently, the 10 companies qualifying for the strategy have a median yield of 7.2%.
Outlook for 2016?
To an extent, the subdued performance of the guru strategies in 2016 has matched nervousness in the market about how the EU referendum would turn out. That uncertainty has now been superseded by total confusion about what will happen next and when. Popular fund manager Neil Woodford has said that the vote to Brexit shouldn’t deter investors from looking to long term opportunities. In the short term, however, the guru strategies are in a state of flux. Big, defensive, high yielding shares with broad international exposure have been the immediate beneficiaries. As such, it’s possible that Momentum and Income strategies could do well in Q3. But those strategies that target domestic, growth oriented businesses have been beaten back, and the third quarter will be a lot harder for them.
Disclaimer
This is not financial advice. Our content is intended to be used and must be used for information and education purposes only. Please read our disclaimer and terms and conditions to understand our obligations.

6 comments
Ben, very interesting update. I think the Stockopedia system is very good. However, the filters or high stock rank stocks also appear to be companies that are riding a current cyclical boom. So for example Persimmon has done very well on the filters up until now. I think Ed covered this in a separate article on sectors but the cross-sector comparison of filters will always be a weakness. Shell is very different to Unilever so it is hard to use quant analysis on quality, momentum and value to draw up a comparison. One business sells soap and the other drills for oil. Unilever may appear much more expensive than Shell but it is not dependent on the oil price and is defensive.
It doesn't surprise me that the high rank/filter stocks have underperformed in the downturn. The Brexit vote is generating a sector rotation away from the high rank stocks. Lots of the high rank stocks often seemed to have a reason that they were high rank. I.e. Persimmon looked great but the housing boom in the UK is getting long in the tooth.
The problem I have with the http://www.stockopedia.com/screens/winning-growth-income-105/
is the number of foreign companies that are included in there, I'm interested in UK based companies not ones in Egypt, Kazakhstan and Oman. I know this has been mentioned before.
Perhaps what this tells us (although we should already know) is that no one strategy works the whole time: it cyclical, like the market or perhaps more correctly, because of the market. If one approach worked, everyone would be doing it, right? This leads in my mind to what is probably an obvious question and that is, whether the data underlying Stockopedia can tell us where we are in the cycle and hence which screen is the most appropriate? Has anyone ever plotted say the stock ranks for different sectors over time to try achieve this? Apologies in advance is this has been considered before - I am a relatively new user.
Hi Whitbyview,
I posted this link last month in the NAPS 2016 thread, which tries to answer your question;
"Following on from being in a particular environment, Jim O'Shaughnessy linked to this blog post yesterday;
http://www.factorinvestor.com/blog/2016/6/1/a-factor-investors-perspective-of-the-economic-cycle
The post analyses factor investing over the last five decades, and appears to demonstrate that different combinations of the QVM factors have varying effectiveness at different stages of the economic cycle.
As the author notes, it is sometimes easier to determine exactly where in the cycle we are after the event.."
Thank you - that was interesting. Hindsight is a wonderful thing or as Niels Bohr I think said, prediction is difficult, especially when it is about the future. I liked the visual representation and the break down of the cycle. Do you know of any similar analysis that considers the most common sectors (e.g. House builders, banks, miners etc) versus a similar cycle? I think most people would agree we are late in the cycle and approaching recession but for some reason central bankers are fighting this. Clearly it is not popular with voters and these is always an election somewhere but I can't help but feel trying to hold back the sea will result in a harder landing when it arrives. Thanks again.
Interesting report.
You did not mention the performance of the Stockranks post the referendum. The highest ranked shares were hit hardest by the knee jerk selloff and the recovery over the last week has been fairly muted. Looking at the performance charts though it seems that all deciles of stockrank are down from their pre-referendum level
Perhaps all we can conclude is that the major indexes are giving an inaccurate representation of the maket as a whole.