How the StockRanks give investors an edge

Last week, I wrote about how I use the StockReport to quickly assess a possible investment opportunity. Being able to filter out stocks that don't look interesting or don't match my investing style means that I can focus my time and energy on investigating the ones that do. The StockRanks can be an important part of this initial look, even if they simply point me to where I should be looking. However, I don't think the StockRanks are perfect. No investing tool allows invetsors to beat the market all the time. If it did, everyone would use it, and it would stop working. There are a few fallacies that those unfamiliar with how the StockRanks work tend to fall for. This week, my aim is to dispel these myths and, in doing so, enable investors to use the StockRanks to give them a behavioural edge and overcome the biases that typically plague investment decisions.
Fallacy #1 – Every SuperStock will be a winner
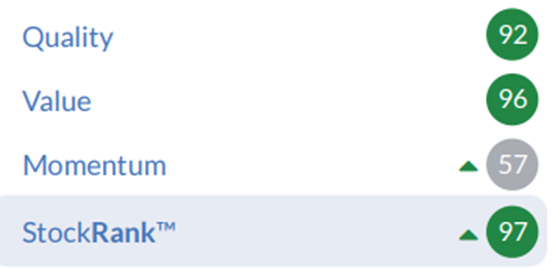
The most common criticism levelled at the StockRank methodology occurs when a highly ranked stock takes a bath. Investors wonder how could something that the algorithms love perform so poorly. For example, prior to the recent warning, this was the StockRanks for IG Design (LON:IGR) :
Here are the StockRanks when the shares were over £2 in mid-2024:
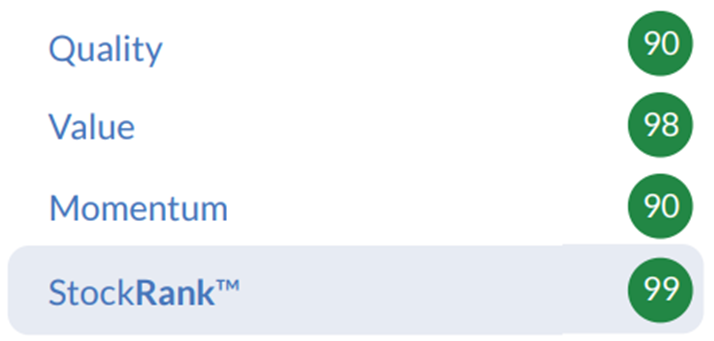
The reality is that highly ranked stocks are often preferred by the algorithms because of the strength of their broker forecasts. If these prove to be incorrect, as they have done for IG Design (LON:IGR) , then this throws off the numbers. However, so much of investing is forward-looking, so it is better that the algorithms use these forecasts, on average, even though they are sometimes led astray.
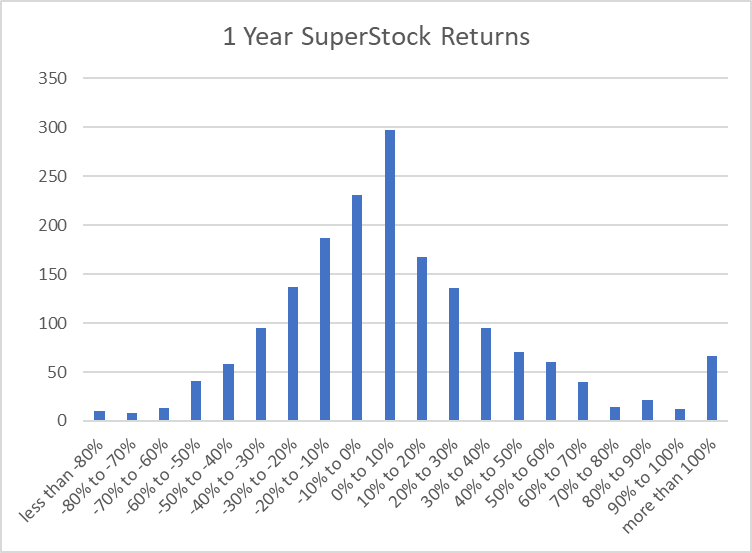
Even where profit warnings are not affecting the forecasts, the key phrase to remember is "on average". While the average performance of SuperStocks is very good, the range of outcomes is still wide. Indeed, here is the distribution of 1-year returns for 10 years worth of UK SuperStocks at the end of March:
From the same data, the chance of a UK SuperStock generating a positive return over the next year is 56%:
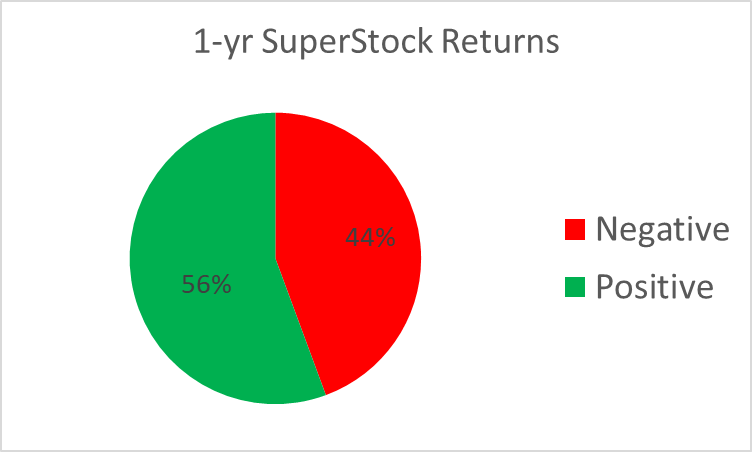
This is still a significant edge, and combined with the tendency for fewer SuperStocks to be really big losers compared to the market, it explains much of the SuperStock outperformance. It is relatively rare for a SuperStock to be a big loser. Based on the data above, there is roughly a 4% chance overall of investing in a SuperStock and losing 50% or more in a year. However, it is often easy to recall the ones that do, especially for holders. This leads investors to suffer from what is known as the availability bias. Wikipedia describes this as:
The availability heuristic (also known as the availability bias) is the tendency to overestimate the likelihood of events with greater "availability" in memory, which can be influenced by how recent the memories are or how unusual or emotionally charged they may be.
Investors that ignore a company's StockRank due to a few examples, such as IG Design (LON:IGR) , where a SuperStock ends up being a big loser, do so at their peril.
Fallacy #2 - A 99 StockRank is better than a 95 StockRank
With the Stockopedia algorithms giving a precise rank to each stock in the investing universe and the StockRank decile performance lining up in order over the very long term…
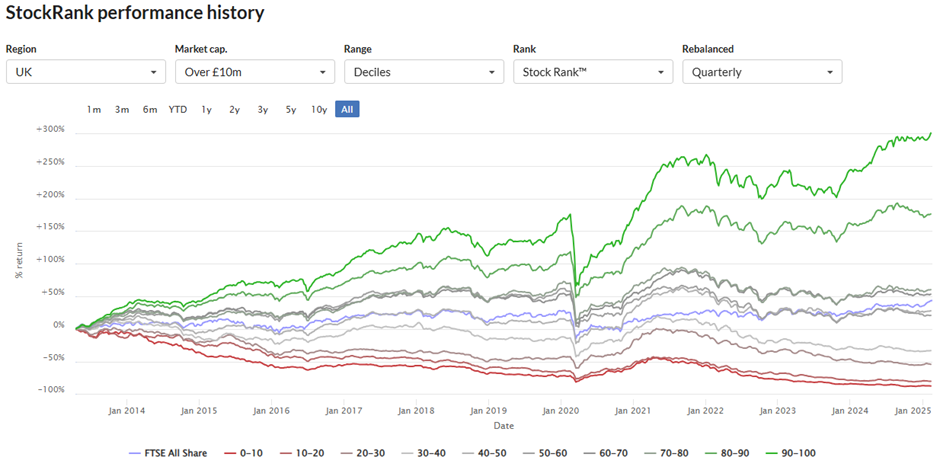
…it is tempting to think that this is a linear scale, and applies within the deciles as well. However, my own analysis shows that this effect within SuperStocks is slight at best:
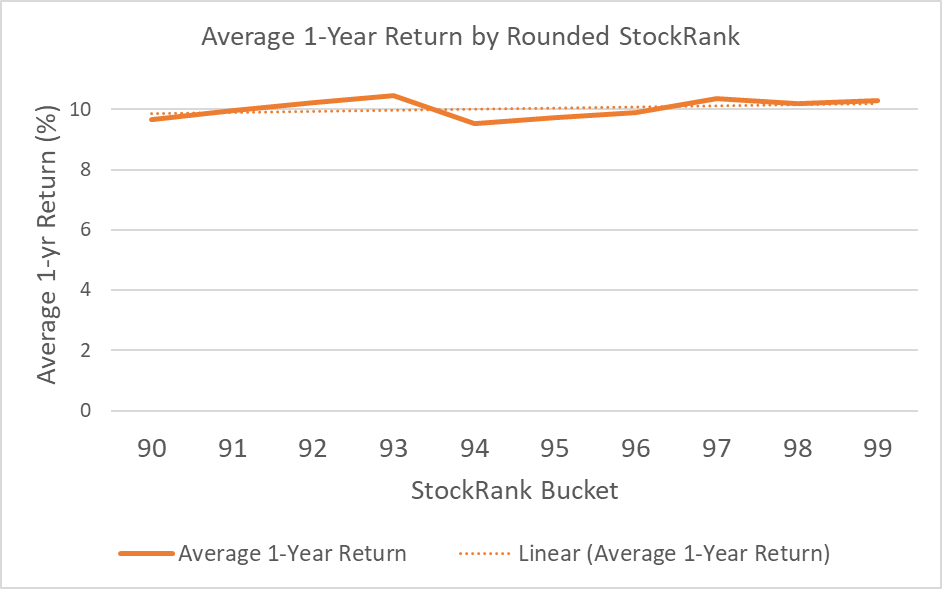
This is unlikely to be statistically significant. For example, the 99 ranked stocks were only the best-performing SuperStock bucket in two out of the ten years. There is simply too much noise to conclude that a particular rank of SuperStock is any better than any others.
The way the StockRank algorithms work is that they give one stock at any time a rank of 100. It is tempting to think that this must be a brilliant investment. I have seen invetsors refer to this as the "perfect stock". The reality is that is is unlikely to be any different to any other SuperStock. Indeed, in my data taking the Superstocks at the end of March each year, twice the 100-rated stock had lost more than 40% of its value over the subsequent twelve months. Investors should treat this like any other SuperStock.
Fallacy #3 - The data is infallible
The Stockopedia algorithms rely on data from a third-party source. This means that, on a rare occasion, the data is wrong. Sometimes, it is something like a decimal point being in the wrong place. For example, on the Kooth (LON:KOO) StockReport these figures are almost certainly out by a factor of 100:
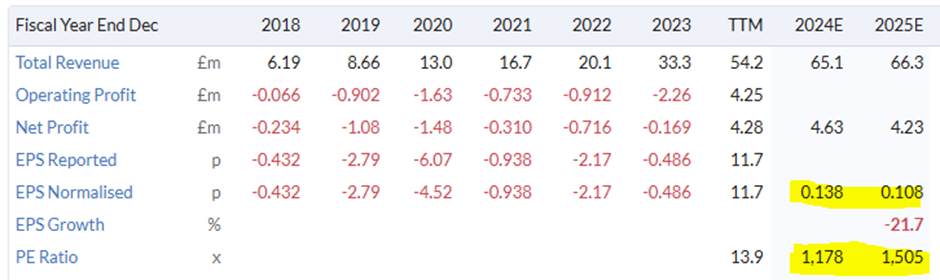
This may affect the StockRank a stock is given. If users spot errors, they can report these via the green button:

Given that this needs reporting to the data supplier, this can take a little while to be corrected but is still worth doing.
One of my bugbears is that brokers tend to suspend their forecasts when there is extreme uncertainty. However, there is no easy way to see that this is the case, and the Stockopedia data provider doesn't always remove the old forecasts from their database.
What this means for investors:
SuperStock investors should hold many stocks
There is nothing wrong with investors using the StockRanks as one of their primary investing tools. However, in order to capture any potential outperformance that holding SuperStocks may give, investors need to hold enough stocks. With only around 56% of SuperStocks delivering positive returns over the following year, it may be unlikely that an investor who holds only 10 or so stocks has all losers, but it is still possible.
Holding the hundreds of stocks that global quant funds have is impractical for the individual investor. However, the simple truth is that the more investors trust in simple (but well-evidenced) metrics, such as the StockRank, the more diversified they need to be to make it likely that they capture the evidenced outperformance.
StockRanks can help avoid the big losers
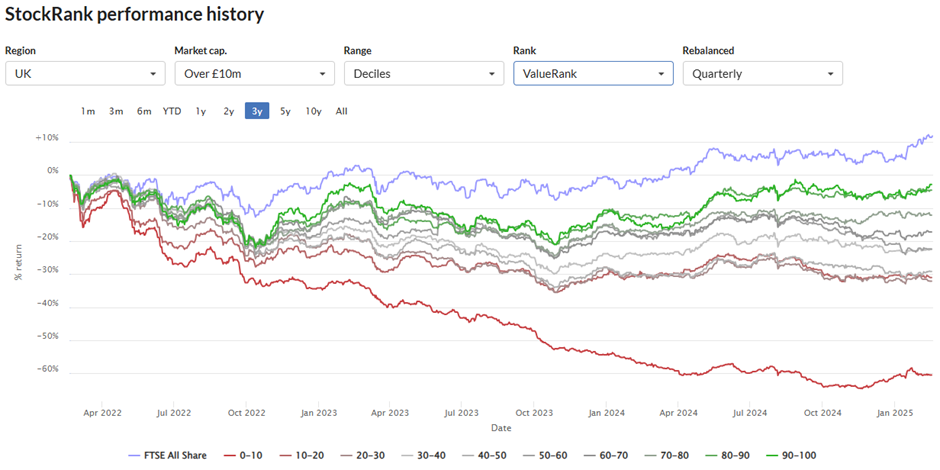
When I reviewed the performance of Value strategies in 2024, it wasn't clear that the cheapest UK stocks had really performed over the last few years. However, what stood out was that the most expensive decile had performed abysmally:
As did the lowest two deciles for the Quality Rank:
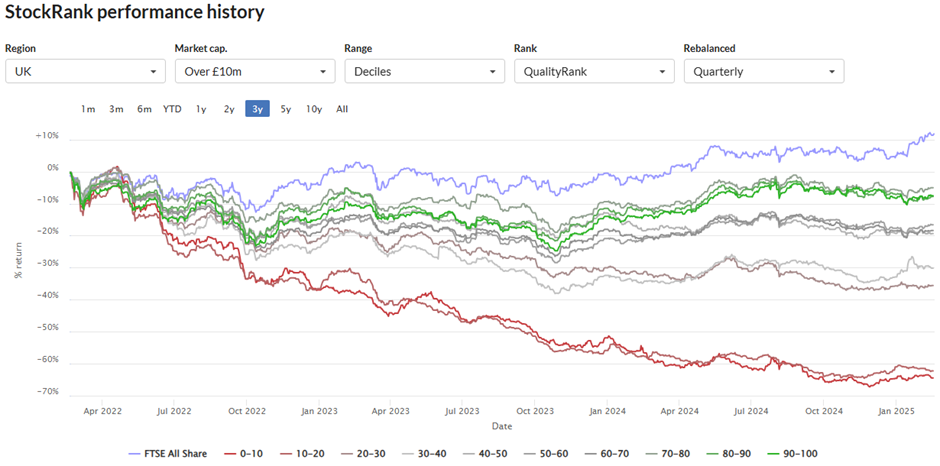
While some investors may validly question the idea of only investing in the highest-ranked stocks, the evidence for avoiding the lowest-ranked stocks seems compelling.
Investors should check the data before investing
The impact of data errors on the StockRanks seems minimal. For example, it doesn't change the outperformance of the average SuperStock. However, when investing in any individual stock, the reality is that investors need to double-check the numbers before they invest. This should be using a primary source such as an RNS or broker's note where possible. Since most data providers use the same raw data supplier, it doesn't work to check somewhere that doesn't link to the official announcement.
New SuperStocks may outperform "stale" ones
When I looked at the impact the change in StockRank had on SuperStock performance, I found that new SuperStocks over the last year beat existing SuperStocks by approximately 5%. This finding seemed fairly robust, given the almost 450 individual stock data points in the study for this category. Investors may do better looking for companies where the StockRanks has been on the rise rather than the highest overall rank.
Paying attention to Momentum drops may help avoid big losers
I don't think any strategy is foolproof for avoiding profit warnings or severe share price falls, even amongst SuperStocks. However, previous research at Stockopedia has suggested that investors may want to pay attention to the Momentum Rank. When a stock has a strong Momentum Rank, but this starts falling, this may be a warning sign, even if the overall StockRank remains high. If investors had sold IG Design (LON:IGR) when the Momentum Rank fell to 80 in September, they would have avoided two profit warnings and a share price that has lost two-thirds of its value:
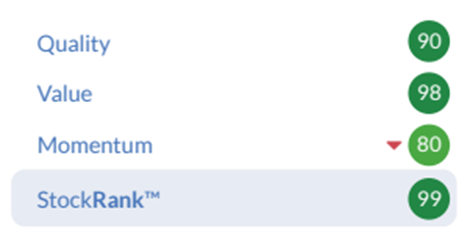
I think we need to do more research into this effect, and of course, there will be some counter-examples, but for the moment, it remains something to keep in mind.
Overall, StockRanks are an incredibly useful tool for investors as long as they understand the limitations and put strategies in place to mitigate these.
[Disclosure: Mark owns shares in IG Design (LON:IGR) ]
Disclaimer
This is not financial advice. Our content is intended to be used and must be used for information and education purposes only. Please read our disclaimer and terms and conditions to understand our obligations.
16 comments
Very interesting. I find it very strange that a 99 stock rank is no better than a 90 stock rank, given that there will be perhaps 110 stocks in the 90+ bucket.
Do any readers have suggestions on why that may be?
For me it is a puzzle because the 90+ decile clearly outperforms to 80+ decile.
Seems strange as the top 25 outperform the 90+ decile. The top QVM are up about 380% since inception, the top Momentum stocks are up over 475%.
I think there are lots of potential reasons for this. The first is that I have data for a specific date (the end of March), it may be something special about that date - for example COVID market crash was the end of March 2020. Then, when considering a compound return, then how often you rebalance makes a difference. For annual rebalancing, almost all the outperformance of 90+ vs 80-90 comes during the recovery from COVID in 2020.
In terms of Momentum Rank beating QVM, this may actually be the premier "anomaly" but it is also the one that may suffer from the highest costs as regular rebalancing is required. I am always chastened by the reality that quant momentum funds fail to generate the returns of the academic studies.
So I am not sure if a 99 StockRank is better than a 90, it may be. But I'm also not sure the evidence is there to say that it is. And I'd be pretty sure that in a pure quant strategy the difference between a 97 and a 98 StockRank, say, is not statistically significant.
If you are a quant, by all means buy the top 100 ranked stocks and you are likely to do well, but don't buy the 14 or so 99-ranked and think you'll be guaranteed to beat the market without taking a huge amount of idiosyncratic risk. For stock pickers, use the StockRanks, but other factors will be more important than the rank when it comes to the details or small changes between ranks, nor will buying 95+ ranked stocks mean you won't have an occasional big loss.
Thanks Mark again great read. Regarding your point about taking the top 14 stocks being a significant risk, I think that once you have a 20 stock portfolio the chances of a major derailment is actually pretty small. DD
I think it depends on what you define as a major derailment! With a 20-stock SuperStock portfolio, picked at random, or say the top 20 highest-ranked stocks, then the chances of say a 20%+ short-term loss is probably quite small. However, the chance of underperforming the market for a few years (or at least the portfolio of all SuperStocks) is probably quite high - randomness will just be too high a factor with such a small portfolio. There is a reason quant funds hold hundreds of stocks and its not to keep their computers busy!
20 stocks are probably fine, though, if you are doing other work on top of just using the StockRank and are willing to live with the bigger drawdowns it will create.
Superb, thank you Mark.
Thanks Mark - a useful reminder and loads of videos under the Learn section offer similarly good advice. It would be amazing to be able to see things like Momentum rank over time graphically in order to easily be able to spot things like momentum rolling over.
Thanks, Mark! Great piece.
It would be great to be able to put the rise/fall arrows for the ranks as a column in folio table views as well as on the pop-up when you hover over the individual stock name.
New SuperStocks may outperform "stale" ones - remind me where you can see this as a screen, over user defined periods.
Hi Mark,
Not currently a screening option I'm afraid, but I believe it is being looked at as an additional feature. You can see the StockRank history at the bottom of the price chart on the StockRepor, though:
HTH,
Mark
Mark, thanks for an interesting article. I wonder if you have any stats for stocks that reach Stockrank of 100, how they perform afterwards, some seem to have peaked before then. Possibly related to stale Superstocks?
Nothing to hand I'm afraid. I had a quick look at the 1 year performance of the highest rank stock at the end of March for each year 2014-2023, which is where I got my 2 companies fell 40% from. It would require a completely different data set to track how each 100-rank stock did after they reached that ranking. I can ask the data heads if it is possible to get that, as it is an interesting topic.
Really good article - punchy and concise. It’s too easy to get complacent about the stock ranks.
Great article, Mark - it's really helpful to have guidance like this - and good to point out the pitfalls as well as the positives.
thanks very much Mark - I find these articles really valuable!
Minor typo here: "From the dame data ..."
Thanks, now corrected :-)