How to avoid High Flyers about to hit turbulence

We all know the feeling. An otherwise smooth flight is interrupted by a couple of bumps. We hear a bing-bong, and the seat belt sign comes on. The cabin crew ask us to return to our seats. We are in for a rough ride.
It is the same for our high-flying investments. High-quality companies with strong momentum can be one of the fastest ways to reach our investing destinations. However, they also come with a significant risk of turbulence. Companies that are flying high have much further to fall when atmospheric conditions change. With turbulence on a plane, we are along for the ride, whatever comes our way. Not so with our investments, where we are mainly free to sell whenever we choose. Is it possible to get out at the right time?
Is there a bing-bong moment for high-flying investments?
There is a market saying that “nobody rings a bell at the top or the bottom of a market”. This is true. No investor consistently gets in at the bottom and out at the top. However, investors who get out when the seatbelt sign comes on following those first few bumps will do much better than those who need to reach for the sick bags.
Given the value of this potential insight, the team at Stockopedia have spent a significant amount of time trying to answer this question. A few weeks ago, I looked at the effect of investors avoiding the lowest-ranked stocks on their least preferred measure. The answer was pretty clear for Contrarian investors who like cheap, high-quality stocks. They should fight their urge to go completely against the crowd and would do better (at least in our simulations) by avoiding stocks with terrible momentum characteristics.
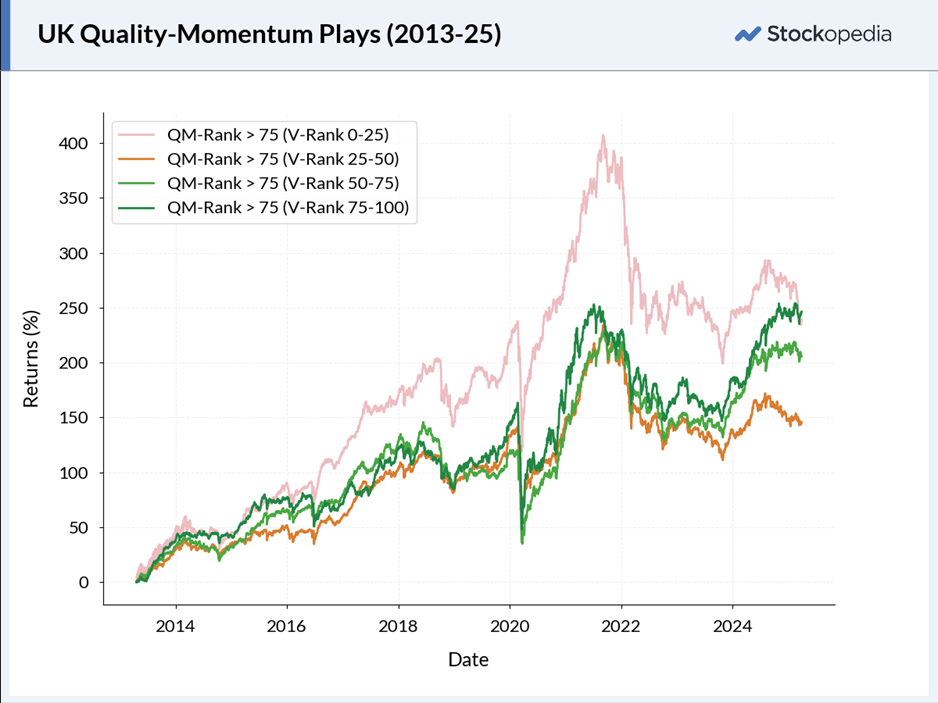
However, the case for investors in High Flyers avoiding the lowest Value-ranked stocks is not as clear-cut. There are times when this would have worked (most notably during the recent weak UK markets). However, overall, there was no clear advantage to this, as the following chart, which splits high QM stocks into V-quartiles, shows:
Last week, Roland asked if falling Momentum could be a warning sign of trouble ahead. He gave interesting examples of Bunzl (LON:BNZL) and Celebrus Technologies (LON:CLBS) , where the drop in Momentum Rank signalled concern before some big falls in the share prices. However, when he simulated the effect of falling or rising Momentum Rank on long-term theoretical returns, there was no clear pattern:
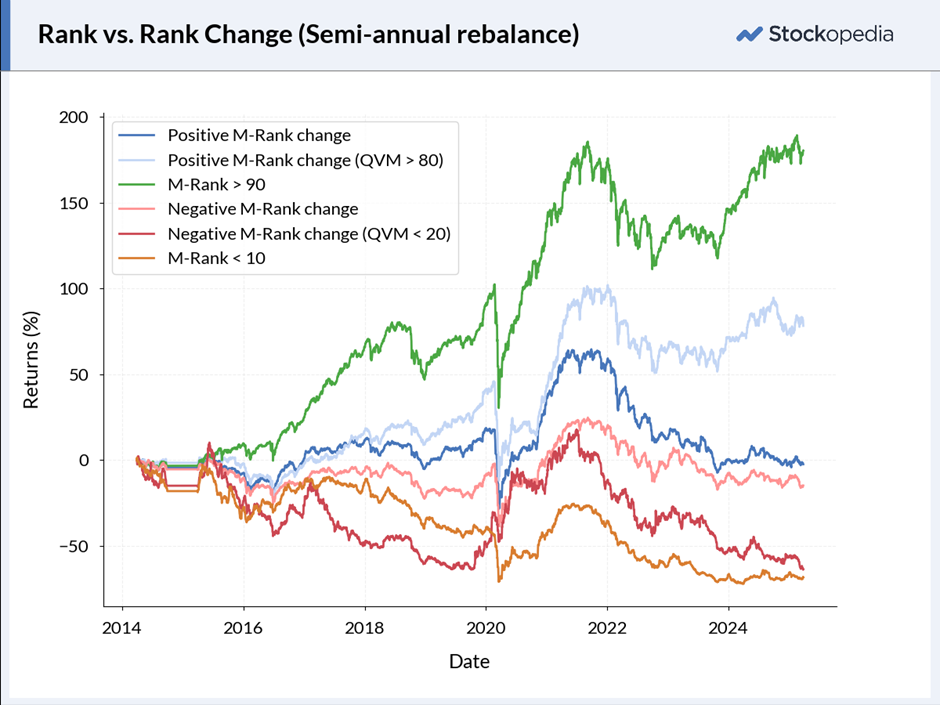
In this case, the absolute Momentum Rank seems far more predictive than changes in Momentum Rank. However, I think there are some limitations to these results. They are based on the semi-annual rebalancing of portfolios across the whole universe of stocks (in this case, all UK stocks since 2014). To answer this question for individual stock picks, I think we need more granularity. Let me demonstrate with a popular example:
A case study: Warpaint London (LON:W7L)
I have already written about how it appears to me that selling a High Flyer when it becomes a “Falling Star” is too late. In this case, by the time the Stockopedia algorithms classified this as neutral, let alone applied the negative classification of “falling star”, the bulk of the recent losses would have been suffered:
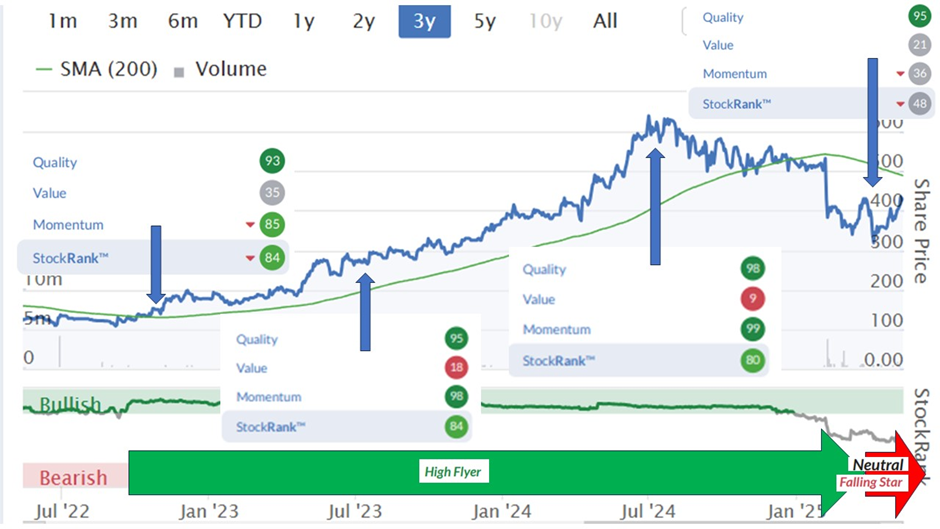
This medium-term chart also demonstrates the folly of some other strategies that may seem intuitively correct. Firstly, Warpaint London (LON:W7L) was rarely a Super Stock. By the end of 2022, the company had high returns on capital and good fundamental Momentum. However, the low Value Rank meant this was firmly a High Flyer for most of its upward journey. Investors who were put off by the low Value Rank (including me!) missed out on a 6-bagger in two years. This is an example where a strategy of avoiding stocks with very weak “least preferred” ranks would be a losing one.
Secondly, the peak of the share price was pretty much the peak QM Rank. Relying on this as a sign to exit at the high point looks nigh on impossible. When the Stock Ranks are relative measures against other stocks in the universe, how high is too high? is a question the ranks simply can’t answer.
A closer look
To try to get a better insight, I asked Alex for the price and Stock Rank data for the year before and after the share price peak (or as up-to-date as possible). The ranks don’t tend to move that quickly, so here I have graphed the data weekly:
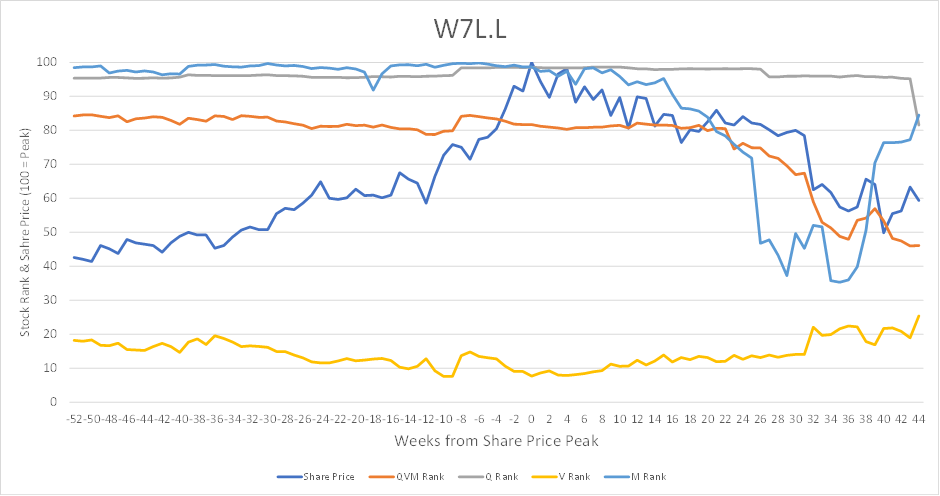
I have set the share price peak to be at Week Zero and scaled to be 100, so all share price movements are relative to this value. This is so that comparisons can be made to other stocks, which will have different share price peaks in terms of value and time. This also gives a reasonable scale to compare the Stock Ranks, which obviously range from 0 to 100.
From this more granular approach, it is clear that the Quality and Value Ranks are not particularly useful for decision-making here. The Quality Rank has remained high throughout. While the Value Rank was close to its low at the peak share price, it was at a similar level 10 weeks before that. Investors who used this as a signal to sell would have sold below the level of the recent share price collapse.
Two things stand out as useful signals. The first is that the share price increase accelerated shortly before its peak. From research into financial asset bubbles, for example, in research papers by Professor Didier Sornette, we see that very rapid price growth, so-called super-exponential growth, is a warning sign for unsustainability. While it is hard to say if that acceleration was super-exponential here, short-term acceleration was perhaps a warning sign. However, the major portent of poor future returns is the divergence between the Momentum Rank and share price. The Momentum Rank fell precipitously seven weeks before the share price mirrored this behaviour.
Could fundamental analysis have helped?
As a largely bottom-up fundamental analyst, I’d like to think that my analysis would add value to this sort of situation. However, in reality, this appears not to have been the case. I have reviewed this company a couple of times on the DSMR. Initially, I thought the management looked too keen to issue equity for a relatively minor acquisition when the shares were above £5, but the market didn’t share my concerns.
Then, when the trading update that started the share price fall was released, I commented that:
This is a mixed update. While the growth rates and operational gearing continue to be impressive, the numbers themselves appear to be slightly behind the consensus. Could this be the start of a trend for the company missing forecasts rather than exceeding them? Still, the 2025 EPS looks like it may be conservative, even if the revenue consensus isn’t.
I certainly didn’t foresee the concerns about a15% revenue growth rate causing such a sell-off. Most recently, when the results were announced at the end of April, the company said:
Excluding the contribution from Brand Architekts (from 12 February 2025), Group sales up 7% in Q1 2025 compared to Q1 2024
On the DSMR, Graham felt this may be a precursor to a profits warning. Given that the fall a couple of months ago was because the sales growth rate was 15%, which wasn’t enough to meet market expectations, I thought 7% sales growth would cause investors to run for the hills. Yet, the shares have rallied around 15% since. The uncomfortable truth is that the short-term share price direction in this type of stock is largely determined by investor sentiment rather than fundamental analysis, and the Momentum Ranks are much better at gauging this.
The more general case
An example, such as Warpaint London (LON:W7L) , can be highly educational, yet it remains a single data point. To see if we are on to something, we need many more examples. So what I have done is identify most of the companies that have been high flyers over the last year or so and found the point of their share price peak. Alex then provided the Stock Rank data for these for the year preceding their peak and up to a year after (the latest date I can get data for is now.) By identifying the peak share price and normalising the price data to that peak value, I have been able to gain further insight into the behaviour of High flyers around their share price peak. This is the graph of the average share price and stock Ranks in the run-up to the share price peaks:
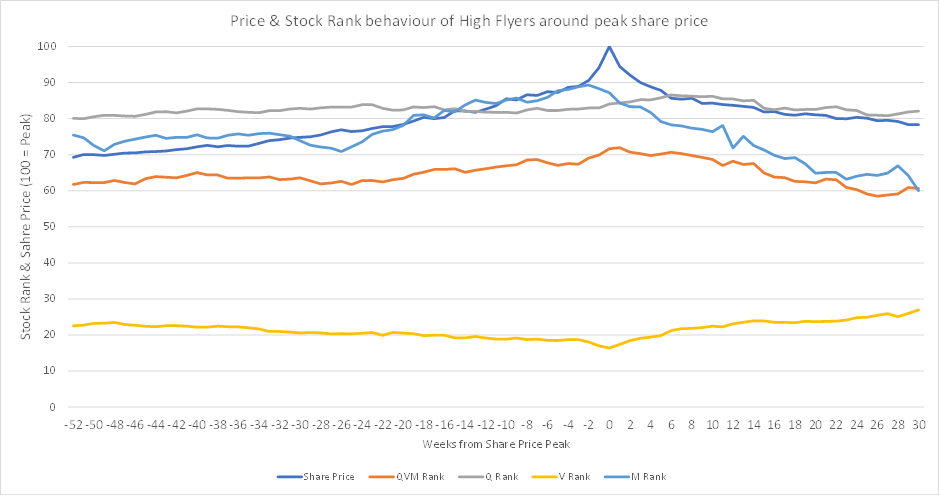
As expected, the aggregation of over 40 share price and Stock Rank moves smooths out a lot of volatility. However, the story is pretty similar. The Quality and Value Ranks reflect the changes in fundamentals, but the changes are too small or gradual to give much signal. The Momentum Rank moves more rapidly. Most interestingly, despite over 40 stocks being aggregated here, there is a pronounced spike up in average share prices over a period of just a couple of weeks into the peak, which is quickly given back. Again, the divergence between the share price and Momentum Rank is the key indicator. However, on average, it is the share price spiking, but the Momentum Rank starting to fall gradually that is the point were investors may need to consider selling.
Weirdly, there is also a dip in Momentum Rank around 6 months prior to the ultimate share price peak. This may be just noise but I think it may alos be becasue share price spikes can often be casued by results and most companies report every six months. This reflects the impact of this reporting schedule on share prices. We have to be careful of false signals. Modest declines in the Momentum Rank shouldn’t cause investors to sell. However, a significant divergence between stock price and Momentum Rank over a period of a couple of weeks is likely a big warning sign.
Conclusion
Far from no one ringing a bell at the top of the market, the bing-bong indicating turbulence ahead for a High Flyer may be clearly heard. Roland was right when he surmised that investors need to pay attention to the changes in the Momentum Rank. It was just that his data wasn’t granular enough to pick this up. The key to using this knowledge is to spot when the Stock Price and Momentum Rank diverge significantly over a period of a couple of weeks. Sometimes, this will be the Momentum rank dropping precipitously, as it did with £W7L. However, it will usually take the form of a spike up in share price while the Momentum Rank drops modestly. Indeed, the latter case may be more useful, as it would mean investors are able to sell very close to the peak share price. Of course, with all Stock Rank strategies there will be counter-examples, where the share price and Momentum Rank diverged significantly but the shares went on to make new highs. However, on average, shareholders ignore the bing-bong at their peril.
Disclaimer
This is not financial advice. Our content is intended to be used and must be used for information and education purposes only. Please read our disclaimer and terms and conditions to understand our obligations.
29 comments
I held Warpaint London (LON:W7L) on and off from June ‘ 23 until January ‘25. Whilst I do look at rankings, IMHO the main point of interest here, before my holding period and about six months into it, was that it was EXTREMELY OBVIOUS that the broker estimates were massively understated. For a while, this led to significant share price appreciation on all TSs and results RNSes, until, for no apparent reason the outperformance completely disappeared.
My main issue through this period was trying to judge from RNSes
whether expectations beats were ongoing or had stopped.
Apologies for the dumb question - is it possible to chart momentum rank for a stock? I couldn't see it in the charting options.
No , sorry. It's not currently an available charting option. I had to ask the dataheads for the data and than analyse in excel to do my analysis.
I will have to watch my HighnFliers more closely, l do hold a few, deciding when to sell is tricky, a spike up often is a time l take some profits, unless there is a good reason for it. Alumasc (LON:ALU) looks expensive now, +95% in 10 months but growth forecast is not that special.
Interesting analysis, I think in these febrile times, investors are more reactive and are less likely to sit out market turbulence. My reactions can be are more emotional than following the rationality of stock ranks. In spite of still believing in the business model, over the last 6 months I had more sells than ever before.
Sorting through my portfolios Mark (sigh, so many Sucker Stocks) I see Plus500 (LON:PLUS) is a High Flyer. I regret top-slicing it last month, wondering now if it will move up a Style to Super Stock and will choose to top-slice some more it it moves down a peg to Neutral. What say you?
Most high flyers won't become Super Stocks as it would require a big one-off jump in earnings etc. that isn't reflected in the price, or at least only partially. No one knows when PLUS will top, but the research here suggests that you should be wary if there is a big spike up in share price that isn't due to changes in fundamentals, so the momentum rankstarts to drift and the value rank goes down.
I see little sign of this in the short term, despite a bit of exhuberence int he share price in the last month or so:
Thank you Mark for your insight.
Mark, it would be interesting to know why Stockopedia calculate momentum using several earnings growth figures, which maybe more suitable to a growth indicator. It may be more useful if we had a separate price momentum indicator, which would probably be more useful as a stop loss indicator for people who use technical analysis. Moreover people who want to combine price and earnings momentum could still do this by using a combined growth momentum indicator. Maybe the growth indicator needs to be modified as Stockopedia hardly talk about it, yet surely growth is an extremely important reason a share may increase in price over time. Furthermore I cant see any research into the growth momentum indicator which you currently have. We can see how quality/value, value/momentum and quality momentum do over time, we can also see how growth does on its own, but how about combining growth and momentum. Maybe Roland, yourself or one of the other Stockopedia staff members who has access to past data could look into growth momentum and inform us whether it works or not.
Realistically, I don't think anyone is going to change the Momentum Rank as it is working. In my personal opinion, each of the ranks has an implementation that I wouldn't have done personally. But given the benefit of a long history of consistent ranks, and that they do a good job in most ciircumstances I doubt they will change. I beleieve the original implementation Ed went for was QVGM but the growth part detracted from the performance, as most quant growth measures do!
I accept the consistency argument with the Momentum Rank. The issue is the Growth Rank doesnt work, and it seems Stockopedia has abandoned it to a hidden corner of the platform. Also would the Growth Rank work better if you incorporated the earnings ranks you use to calculate the momentum rank, as from looking at the Stockopedia Academy the growth rank doesnt seem to use this at all. Even without changing the growth rank I just thought it might be a good idea to see whether growth momentum combined is a feasable strategy as its certainly worked for someone like Mark Minervini.
Isn't Growth the one and the same thing as Momentum?
I used to use Vector Vest before they left the UK market. They had a price momentum indicator called Relative Timing which purely reflected price. They also had a Growth indicator which reflected EPS growth and a Sales Growth indicator for revenue growth. I think other software like IBD in US have price strength indicators as well. Stockopedia is the only software I know which tries to merge the two in one indicator. I like both price and earnings momentum so maybe this is fine. I was just asking whether someone in Stockopedia who has all the data could test to see whether combining growth and momentum ranks is a viable option, as there is no way I can do this as Stockopedia doesnt even publish the growth figure in their past data (under the print column). Finally with Vector Vest you were able to backtest any idea. When I backtested stocks with high eps growth prospects I got great results. Thats why I expect growth can deliver good results. However Stockopedia calculate growth differently to Vector Vest and it doesnt seem to work as its very difficult to find the growth rank ie its not in the stock report.
In general growth in sales is negatively correlated with share prices.
Earnings growth has a slightly better connection with share price rises, but again it can generate a bandwagon which pushes share prices up beyond fair value.
Earnings growth surprises are very strongly connected to share price rises. But by their nature are hard to predict ex ante.
The best two guru searches on Stockopedia by performance since inception are growth momentum searches- Jim Slater`s Zulu and William O`Neill`s CANSLIM. Both O`Neill and Minervini want sales growth in their shares- the only aspect I`d add is they ideally like accelerating growth figures. If you look at Stockopedia`s top 10 Growth stocks currently, half of them having analyst earnings (eps) graphs which are flat or falling, so I dont think they reflect future growth prospects. But the top 10 Growth Momentum shares mainly have better analyst earning graphs, so I would rather hold those 10 than the Growth stocks. I agree with you that if you look at headline growth figures like 1 year sales or earnings growth this may be purely high because the eps or sales figure were poor a year ago. But if you analyse growth a bit deeper, I believe you can find the next Games Workshop. Growth just need to be consistent and even better accelerating.
Sorry for not being clear about this, I'm not saying the divergence would have got investors out at £6, but at £5ish when the Momentum Rank started to fall precipitously before the share price fell down to £3ish. Not perfect but still much reduced losses. No need for the print function. The Ranks are in the graph in the article, if that is what you are after.
Hi Mark, l'm not seeing that in the prints out, is your chart correct? As l said in my earlier post. 7 weeks is about mid December? 19th Jan, M was 80.
Jan 19th it looks like the momentum rank started falling:
And we had up to 5th Feb to sell. So you are right, I think I am out on that 7 weeks, it was more like 3. Sorry.
Interestingly, Next (LON:NXT) seem to match the criteria at the moment - assuming I understand the article correctly.
Next (LON:NXT) could have sold yesterday as M score went down to 78 but today it is up to 81. If l held l would consider selling some, judging by the charts.
Thank you for a great article.
The momentum literature almost all agrees that price momentum only lasts on average for a year. Therefore any stock that has had a strong momentum score for a year should be reviewed.
This review should involve an assessment of the current direction. As Peter 171 says, looking for a divergence between a fast moving price moving average e.g. 10 days and a slower one e.g. 100 days would reveal a change in momentum / direction.
A fast and dirty way would be to use old fashioned moving stop loss.
Of course if you have the fortitude of Buffett then if you think the business case continues to be strong you simply ride out price falls. Personally i can't do that.
Mortgage Advice Bureau (Holdings) (LON:MAB1) could be a good study, over the last 10 months.
Looking Alpha International (LON:ALPH) early April share price 2300, M score 76, now share price over 3,000p, M score only 56. I know it is not a high flyer. Can see similar pattern in 2024 with this stock.
Good old fashioned DMAs very rarely let me down after a stock high dips below a higher DMA is a good time to sell. At least one is realising a profit!
Yes although quite a few will fly higher. Then you miss out on the big multi baggers.
Mark, Thank you for this very interesting piece of work. You conclude that it might be a good sell signal for a High Flyer when the share price is going up, but the Momentum rank starts to drop. When we examine how the the Momentum rank is arrived at, we can split the data into two groups, ie share price data, and fundamental data such as earnings. So we could say that when the share price is rising and the Momentum rank is falling, then it must be the fundamental (earnings) data which is falling. Therefore one could postulate that the High Flyer sell signal that we should look for should be the fall of the fundamental earnings data?
Mark
I think that this is a fascinating topic and I was intrigued by the Warpaint London (LON:W7L) e.g.
“However, the major portent of poor future returns is the divergence between the Momentum Rank and share price. The Momentum Rank fell precipitously seven weeks before the share price mirrored this behaviour.”
So using the Print function I went back to July-Sept 24 for SP MR and Earnings forecasts nos and worked out the average M Rank/ month, which are:
July 99M - peak price
Aug 97.5M
Sept 96.4M
So not a large M Rank difference, unless my maths are wrong, or is there a blue line interpretation issue?
Yes the M score was still over 80 in January 25, the big share price fall happened early February. The share price had been over 500 for a while with the M scores still quite high, in November and December 24, l'm not seeing a precipitous M fall until after the share price fell. There was a drift down. Many M scores follow the share price. M was 86 on 15/12/24. M was still 83 on 29/12/24, share price 528p.
Yes you find examples like this but l bet there ones with the opposite behaviour. Some investors buy the dip and share price does recover often after some consolidation, of course the Momentum scores will fall, during that period. Some shares will fall further.
Alumasc (LON:ALU) could have sold at 320p, share had fallen, M score falling but now back up to 375p, M score up again. OK probably much better examples can be found.
I think that is one of the factors at play here, the clue is that the Value Rank also drops on average, suggesting that this is part of the story. Although the number of things that go into the momentum rank means it may not be the only part.
In general, I think the story is that a sharp rise in price in a High flyer that is not met by earnings upgrades is bad news.