How to use factor investing to chase better returns

Below is an adaptation of the most recent article I wrote for the Australian Financial Review which was published today (08/02) on page 24 and appears online here . I have made some extra additions to provide Stockopedia members with further context and education.
How to use factor investing to chase the better returns
Blending the styles is a way to help smooth out factor-driven cycles.
A key question for investors over time is, “What drives investment returns?”
A seminal work by Eugene Fama and Kenneth French in 1992 – The Cross-Section of Expected Stock Returns – offered a solution. Without going into too much detail, the net outcome of their findings was that stocks exhibiting particular traits could have different average returns, and thus different drivers and expectations of performance.
This contrasted with the previous thinking that all stocks should have the same expected returns. Referred to as the Capital Asset Pricing Model (CAPM) as it came to be known, it was believed that it was not possible to outperform the market. Rather it was a stock’s beta (its tendency to vary from the market) which caused the variation of returns.
Through their research Fama and French created a three factor model that expanded this previously restrictive model by proving that adding the factors of size and value into what became known as their “Three-Factor model” could explain differences in a diversified portfolio’s returns.
The net outcome of Fama and French’s findings was to turn the previous thinking surrounding expected returns on its head, and the concept of “style investing” was born. Today it is more commonly known as “factor investing”, a strategy to identify and exploit systematic patterns in the returns of different securities.
However, it would be wrong to assume investors weren’t using factors to help identify stocks in the past. Throughout the 20th century, famous investors such as Benjamin Graham, often referred to as the “father of value investing”, used value measures to identify cheap stocks believing that investing in stocks that exhibited that style would generate consistent above average returns..
Then there were others such as his most famous student Warren Buffett, who added quality traits to his screens in order to find quality at reasonable prices. On the other end of the spectrum, there was Richard Driehaus, who came to be known as the Father of Momentum as he identified the relationship between past price moves and their impact on the direction of future moves.
So what are these factors, and how are they measured?
Fortunately at Stockopedia, we make this our life mission so there is no need for you to develop complex spreadsheets to monitor these. We simply do the calcs and display them on every StockReport, within the Browse section, the Screener and the Folios. I will cover this more in depth later in this article.

And it is very important to remember that identifying the strengths and weaknesses of certain factors is beneficial to us as investors as understanding the driving forces behind your stocks allows you to make more confident buy and sell decisions.
It is also important to note that while various factors will outperform and underperform at various moments in the cycle, the idea here is not to chop and change investing styles to suit what is running now. Rather it is to pick a style you are comfortable with and then let the numbers dictate your decision. So if you are a Quality stock investor, and a company doesn’t exhibit that factor, then one simply doesn’t invest.
The common factors are:
Quality: This factor aims to identify companies that are profitable and generating sustainable cash flows at high rates of return. It uses measures such as average return on capital employed, assessing both gross profits and cash flow to assets, as well as operating margin stability and sales growth consistency. These measures allow investors to assess the quality of earnings. Further, an assessment of the balance sheet, current leverage and cash conversion is also conducted to ensure the quality earnings are generated from a solid foundation.
Value: This is about identifying cheap stocks today with the idea that they will be worth more tomorrow. This factor aligns with most of our investing education and was popularised by Graham, the British-born American economist, professor and investor. To assess value, metrics such as price-to-earnings, price-to-sales, price-to-free cash flow, price-to-book and dividend yield are used. However, be warned – this factor can be littered with broken business models and “value traps”, so this factor is best used in combination with another.
Momentum: Many academic studies have confirmed that stocks that have outperformed their peers relative to price keep doing so, and vice versa, particularly in Australia. Studies have shown that one of the remarkable truths of investing is that trends tend to persist, so shares exhibiting trending prices and sentiment will often continue in the direction of the prevailing trend. The momentum factor not only encapsulates price, but measures such as recommendation and earnings upgrades, and surprise factors.
Growth: This factor aims to measure sales and earnings growth within a business, both historical and forecast. Of all the metrics discussed, this is the hardest to apply a quantitative model to as often the best “growth” comes off a very low base (ie, prior poor numbers). Another related problem is that they tend to carry both high investor expectations and high valuations, which make growth stocks sensitive to disappointments. Like value, it’s best to use growth in combination with other factors.
With the start of the reporting season, the accompanying table shows a list of the top companies within the All Ordinaries index that rank highest for each individual factor. These lists will change after the release of new financials, which provides investors an optimum time to revisit the stocks within their portfolio and check their alignment to their preferred blended strategy.
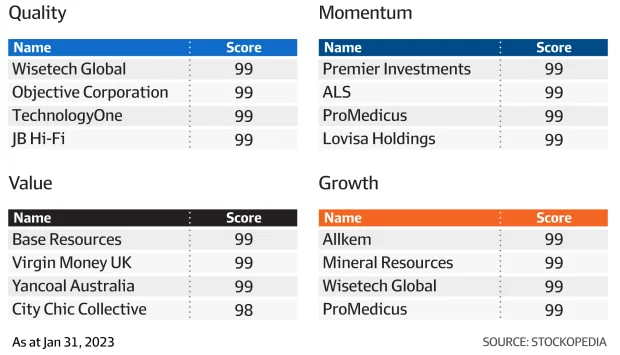
Blending factors is a recipe for success
On their own each factor provides a powerful insight into the drivers of an individual stock’s returns. However on their own, they too can be quite volatile as there will often be time in the market where the cycle is moving against a specific factor.
Blending the styles is a way to help smooth out factor-driven cycles. This creates a “multi-factor” model that adds a robust nature to stock selection. Buffett, for example, combines value and quality. As he once famously said: “When it comes to socks or stocks, I like buying high-quality merchandise when it is marked down (value).”
At Stockopedia the manifestation of this idea of “blending” is captured in our QVM Rank, or as you will know it the StockRank™ score which you see at the top of every StockReport and Scan. Historically stocks with a high Stock Rank display consistent outperformance of the market #

I will discuss in further details later where you can access our StockRank scores.
Not only do we blend all the three main factors of Quality, Value and Momentum together into the single StockRank score, but we also have different blends of two factors together such as the VM (Value/Momentum) score, the QM (Quality/Momentum) , the QV score (Quality/Value). And though we exclude growth from inclusion in the StockRank on account of its Growth has a high correlation with the Quality and Momentum Ranks and therefore does not add extra value so we exclude it from inclusion in the StockRank. However, Members are still able to access the 'G' rating within the program.
Ed Croft, founder of Stockopedia is on the record saying he wants to identify good, cheap, strong stocks, however he wants to avoid the potential of finding a value trap by identifying stocks that don’t exhibit too much momentum weakness. Herein lies his profile, Ed is a Value/Momentum investor and therefore will look for stocks with a high VM ranking first before conducting his final research as to whether the stock should be included or not in his portfolio.
A stock that is only strong in one factor suffers the risk of larger price declines should the cycle move against it, so blending it with another is a way to help manage that risk.
Using the StockRank in Stockopedia
As a Stockopedia member you constantly have access to our Stock Rank system. This is an added bonus once reporting season kicks in and we start to receive a new set of financials to benchmark companies against. The reporting season is when Stockopedia’s value amplifies.
We make the StockRanks very visible in a number of different sections within the program. The most obvious place is on every company StockReport however there are more places.
Today
On the Today page (Home screen) the StockRank appears in a number of different places scattered around the page. From a column advancers/decliners section, through to the new 90+ StockRank additions and the charts of the Stock Ranks.
Browse

Not only are you able to bring up on screen all the highest ranking stocks relative to each criteria as I did for the AFR article, but you will also always have the Stock Rank presented to you.
Here you can also find Blended Factor scores to sort on under the “Top StockRanks” section, so if you wish to see the highest performing QV(Quality Value) stocks you can by going to this section.
Screens
The screens are also filled with Factor Ranking scores that you can apply in order to identify possible opportunities on the market.
Within the Screener there is a whole section dedicated to StockRank elements that members can select from and can apply to their scans.

FOLIOS
Not only is there the ability to change views that can include a wide selection of Rank data.
But there is also the bubble chart which can provide a visual representation of how your current holdings sit relative to your Factor preferences.

LEARN
Within the Learn section don't forget you can read a lot about Factors and the specific traits of each.

Knowledge is power, The StockRanks and the various Factor scoring is your edge. Use these insights effectively and you will be more informed and in control than the vast majority of your fellow share investors as you will understand the drivers of a stock's performance.
Important Information: Stockopedia Ltd ABN 39 757 874 670 UK business registration number 0637267 (“Stockopedia”) is an Authorised Representative of Daylight Financial Group Pty Ltd ABN 77 633 984 773 (“DFGPL”) which is the holder of an Australian Financial Services Licence (AFS Licence No. 521404).
Information in this commentary is current as at date prepared unless otherwise stated. However, please bear in mind that investments can go up or down in value, and that past performance is not a reliable indicator of future performance. For more Important Information please refer to the Disclaimer section of this website.
This communication may contain general financial product advice. It has been prepared without taking into account your personal circumstances, and you should therefore consider its appropriateness in light of your objectives, financial circumstances and needs before acting on it.
If our advice relates to the acquisition or possible acquisition of a particular financial product, you should obtain a copy of and consider the Product Disclosure Statement (PDS) before making any decision.
The author holds interests in the following stocks mentioned in this article: PME, LOV, WTC, TNE, MIN. This position can and will change at any time without notice.
# Rules and disclaimers of the StockRank performance graph
Disclaimer: Past performance is not indicative of future returns. Please do your own research & consult professional investment advice when using Stockopedia. Please refer to the Terms & Conditions when using the Stockopedia website.
The StockRank performance charts do not reflect actual investment performance. The StockRank performance chart represents an illustrative example of a hypothetical investment that is unlikely to be replicable. The rules to construct this performance chart have remained the same since its inception.
Data: To minimise common backtesting biases, we use the actual data that was published on the Stockopedia website at each rebalancing date. All stocks that have been delisted are also included in the results. We try to make our data archiving as accurate as possible, but data errors can and do occur - please contact us if you see anomalous results.
Dates: To build portfolios we use data batches as close to the end of each quarter as we have available. As we continue to bring more data batches into the backtester from our archives the performance charts may be liable to change.
Prices: All portfolios are rebalanced at the next available close price after each data batch publication date. Our studies currently show minor performance differences between the use of open or close prices - we may make the choice configurable in future.
Costs: We do not include any transaction costs or bid-ask slippage in the calculations - more frequent rebalancing periods may generate better theoretical performance results but could incur greater transaction costs in real-world trading.
Dividends: Dividend payments are not included in performance calculations - higher ranking quantiles in general have higher average dividend yields so we would expect higher total returns in higher quantiles than published.
Splits: We are vigilant about finding splits and consolidations - but occasionally they can be missed by our data provider and skew results. If you do see any anomalous charts please contact us using the positive button and we will fix them.
Micro-caps: Anomalous share price prints & errors in micro capitalisation stocks can at times skew the results of an entire quantile bucket. We present our tests at Market caps of > £10m to minimise these issues but please beware in your own tests and notify us of any issues.
Disclaimer
This is not financial advice. Our content is intended to be used and must be used for information and education purposes only. Please read our disclaimer and terms and conditions to understand our obligations.
No comments yet
No one has commented here yet! Why not be the first one?