How understanding correlations can improve StockRank investing

In my last article, I looked at a way of using momentum to overcome some of the biases that value investors face when considering when to sell a successful investment. The idea was to surf the StockRanks. Buying quality companies when they were at value multiples and holding until the value had outed and the momentum was fading.
Surfing Examples
One of the requests from subscribers was to see if the Stockopedia data team could find examples. Unfortunately, screening for these has stumped the data heads. However, they have been able to provide some historical data for some subscriber ideas. Here, for example, is Reach (LON:RCH) :

This isn’t the perfect example. This was never a particularly high-quality stock, and in this case, investors would simply be better off selling as soon as the Value Rank dropped below 50%.
However, I have been able to find a personal example, and sadly, one where I jumped off the wave too soon. To get an idea of how I could have done better, I used the StockReport “Print” function. This enables me to see a snapshot of what the Stockreport looked like week-by-week:

The company is Iqe (LON:IQE), and here is the chart for the period 2016-2019:

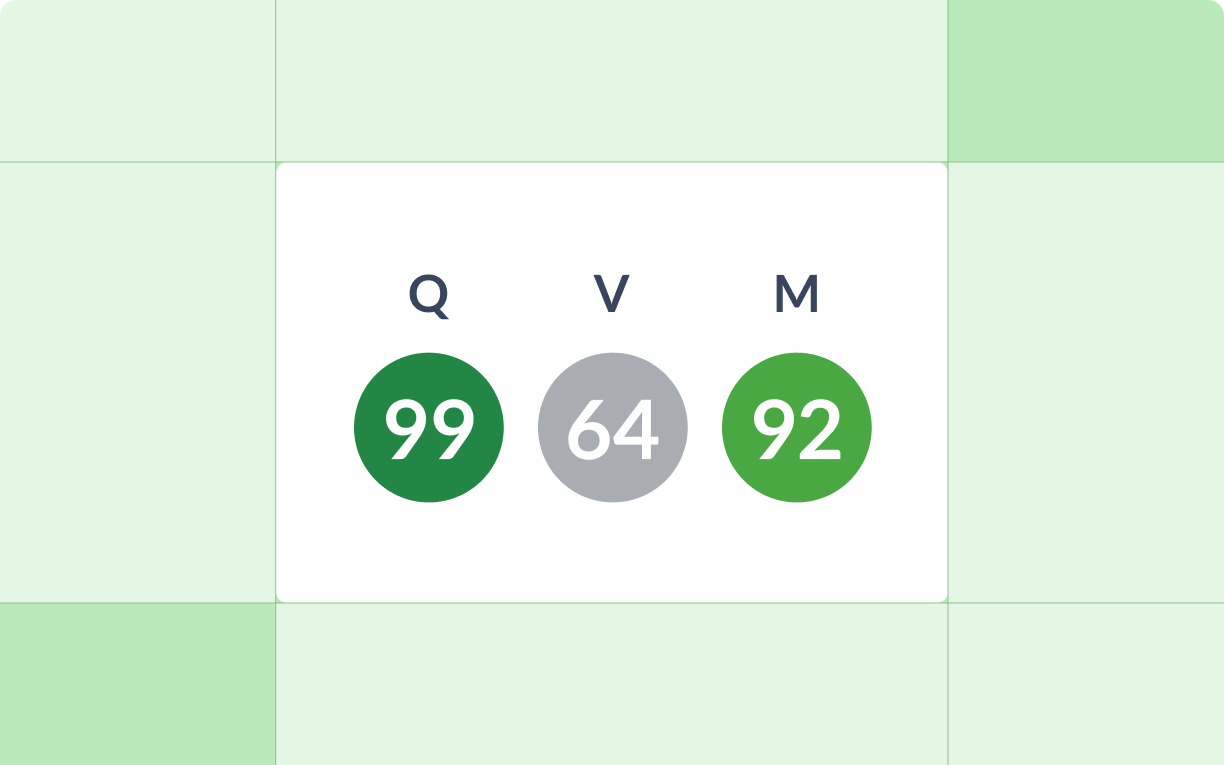
I bought the stock in 2016 at around 17p per share as a value share when the stock ranks looked like this:

So again, not a particularly high-quality stock. However, by the start of 2017 the share price had risen, leading to the Value Rank dropping and the Momentum Rank rising. The stock ranks now looked like this:

I thought I had done well to sell above 50p in mid-2017 when the value appeared to have outed and the stock ranks now looked like this:

However, selling the stock with such a strong momentum proved to be the wrong move, as the stock peaked at 180p in November of that year. At this point, the momentum was pretty strong, so it would have been pure luck if I sold at this point.

However, by mid-December, the Momentum Rank was dropping rapidly:

The investor who sold at this point, when the Value had fully outed and the Momentum Rank breached 90, could still have sold for around 150p, or three times the level I sold at.
In my surfing article, I suggested that value and momentum should be negatively correlated. This makes sense based on the results of the academic studies into the behaviour of stock prices. Over very short periods, up to a month, prices tend to mean-revert. Big jumps in share prices tend to attract sellers, and these fade quickly. However, over the medium term, from one month to about a year, stock prices are positively correlated. Winners tend to keep winning, and losers keep losing. This is what is typically called momentum. However, over the long term, over three years, mean reversion takes over again. The winners lose their shine, and the losers recover to become winners. This is the value effect, where the forces of capitalism force a poorly-performing business to turn itself around. So momentum and value work over different time periods pulling in opposite directions. Of course, not every company experiences these effects. However, they are consistent enough to allow investors who exploit them to beat the market.
Value Rank vs Momentum Rank
So it makes sense that value should be negatively correlated with momentum, and not just value as measured by three-year stock price mean reversion but by other measures such as Price-to-Book-Value or the Stockopedia Value Rank. This negative correlation between value and momentum is also visible to some extent in the specific stock examples of Reach (LON:RCH) and Iqe (LON:IQE) above. And indeed, that is what academic studies find, such as this one from Quant investors AQR. However, the Stockopedia Momentum Rank doesn't just use price momentum but includes measures of fundamental momentum, too, such as EPS estimate upgrades. So how does this affect the correlation? To test this, I downloaded the current StockRank data for the UK market. This is what I found:

So the reality is that there is little correlation between the Value Rank and the Momentum Rank amongst all UK companies at any point in time. On the surface, this appears to cause an issue with Surfing the StockRanks. However, the "surf" doesn't require the Value Rank to fall as the Momentum Rank rises. Instead, the fundamental momentum behind a stock turnaround may mean that the company remains cheap as the momentum builds, and as such, the investor can surf the wave for longer. The successful "surf" just requires the investor to hop off the wave when both the value has disappeared and the momentum is fading.
However, something interesting happens if we only include companies that are forecast to be profitable in this analysis:

Here we see the expected relationship, although again, a relatively weak one. Very few profitable companies are expensive and have poor momentum. This makes logical sense. Investors can use this second graph to estimate a good point to exit the wave of momentum and sell their stock. Since the number of stocks thin out when the Value Rank and Momentum Rank are below 50, investors should be long gone by the time the Momentum Rank drops below 50. However, the examples of Reach (LON:RCH) and Iqe (LON:IQE) show that an even more aggressive selling strategy is probably ideal. Once the momentum Rank for these stocks started falling below 90, it kept falling rapidly. Any investor who waited for the Momentum Rank to fall below 50 would have given up a significant amount of the peak gains.
So what else can be learnt from the correlation between the Stock Ranks?
Value Rank vs Quality Rank
Although the Value and Momentum ranks are uncorrelated, the Value Rank and Quality Rank are slightly positively correlated:

However, again this looks a little different when we only include companies forecasted to be profitable:

In this second graph, it seems we are removing many of the Sucker Stocks. There are reasons why the highest quality stocks may not always appear cheap. I touched on this when analysing £TUNE. The Value Rank includes Price-to-Book-Value and Price-to-Tangible-Book-Value, where smaller is better. Whereas the Quality Rank includes Return on Equity, where larger is better, and Equity is another name for Book Value. So these pull in opposite directions. The above graphs show that this does not have a material impact and the Value and Quality Ranks remain largely independent of each other.
Momentum Rank vs Quality Rank
This is the strongest of the correlations:

This is probably because the Quality Rank contains a measure of fundamental momentum called the Piotroski F-Score. Here is the description from the Quality Rank definition:
Is it an improving company? (Fundamental Momentum)
In which direction are the company's fundamentals headed?
Piotroski F-Score (discussed in depth here) - We heavily weight the F-Score given it's effectiveness, especially amongst small caps.
This may have an unintended consequence, which reveals itself when we look at the correlation between the individual Ranks and the overall StockRank.
Breaking Down the StockRank
Here are the values of a popular statistical measure of correlation called R-Squared for each of the constituent Ranks versus the overall StockRank:

One way of looking at this is that these numbers represent the proportion of the variability in the overall StockRank that can be explained by the constituent Rank. Here the Quality Rank stands out as explaining a significantly higher proportion of the StockRank than both the Momentum and Value Ranks.

This shouldn't be a problem over the long term since Quality is a factor that has been shown to outperform. However, the risk is that by choosing high StockRank investments alone, these may underperform during a period where Quality is out of favour and Value outperforms.
A higher weighting to the Quality Ranks may explain why the highest StockRank portfolio has struggled in the last year, despite excellent long-term results:

A slight adjustment
In generating his NAPs, Ed Croft has now shifted to a "half-and-half" approach. Half the NAPS portfolio is invested in "growth" stocks (top ranked by quality and momentum) and half in "value" (top ranked value and momentum). As can be seen from the following R-Squared values, this gives a more balanced approach:

Another simple way to ensure that a high StockRank portfolio doesn't miss out on the returns to Value is to demand it explicitly. For example, a screen with the StockRank above 90 has 138 results for UK stocks. Adding in the extra screening criteria of the Value Rank being above 70 still leaves over a hundred stocks to choose from. More than enough for the StockRank investor to build a diversified portfolio designed to outperform across a wide variety of market conditions.
Disclaimer
This is not financial advice. Our content is intended to be used and must be used for information and education purposes only. Please read our disclaimer and terms and conditions to understand our obligations.
12 comments
Excellent piece, thanks Mark.
Reschenhofer also did a recent piece on when to sell in light of changing characteristics: https://papers.ssrn.com/sol3/p...
Mark, I did go through the top Stockranks and then selected the ones over 70 Value. I then looked at the mini charts. From that I think SCS (LON:SCS, B.P. Marsh & Partners (LON:BPM), Rotala (LON:ROL) and DS Smith (LON:SMDS) are worth considering.
Some I feel I have missed the boat, such as Smiths News (LON:SNWS, and Card Factory (LON:CARD.
I hold SCS (LON:SCS) and am considering B.P. Marsh & Partners (LON:BPM). After this I will look into DS Smith (LON:SMDS).
Look where my stop-loss got activated! 0.2p before it turned ahhhhhhhhhhhhh hate it when that happens.
Yes annoying. I sold my SCS (LON:SCS) today, had a good run, nearly doubled in 3 months, looks like it may pull back, I will watch it. BP (LON:BP.) also had a good run, taken some profits. On Beach group (LON:OTB) I'm watching now. Many others also.
Would be interesting to see the average amount of time a stock's Momentum rank stays within the 90-100 zone? Could give a good window for selling.
Great piece Mark - really excellent insights !
Dear Mark,
Very interesting have you considered this in reverse for example when do you sell a bad investment that loses you money? I am thinking of Luceco which has disappointed since float being lower than when it floated back in 2015/16 it would be really helpful if you could educate readers on when and why one should cut one’s losses.
Luceco (LON:LUCE) went from 100p to 500p and then back down again, so I think disappointed since float is a bit unfair. Of course we should have all sold around 500p. It was never good value until more recently.
Some shares keep on going even when the value drops, Yu (LON:YU.) seems to defying gravity, one I sold far too early.
Having selected your folio, you can add a value column to it, so you can quickly see if a stock is getting poor value. I had a look at my Naps folio and half of the QM stocks are above 70.
In a bull market high fliers perform well, these are poor value stocks.
Wouldn't it be beneficial to have the Quality, Value and Momentum ranks displayed over time alongside the StockRank? This visual already exists and would allow users to see the movement of each metric rather than printing each StockReport and comparing manually.
I think that'd be a fantastic addition
Bravo Mark
These last two articles make fascinating reading and it is true, there are plenty of articles on what and when to buy, not enough on when to sell. These 2 articles are Solid Gold!