Is now the time to be a turnaround investor?

When I looked at improving the performance of the “crossover” Stock Styles, I asked why not just invest in Super Stocks? There were a few reasons, including the possibility of Super Stocks tending to cluster within specific sectors of the market at any given time. However, the most compelling reason for choosing a different winning style is that it is a better fit for our personalities. Those of us with a strong contrarian bent can struggle to buy stocks with strong enough recent gains to be Momentum winners. In contrast, investors who like to go with the flow often prefer the much higher Quality and Momentum Ranks that go with investing in High Flyers. Unsurprisingly, these styles are among the most popular with Stockopedia subscribers. However, there is a third, less-followed Stock Style, Turnaround Stocks. This is where companies score highly on the Value and Momentum Ranks but are low on the Quality Rank.
Why invest in Turnarounds?
On the surface, it seems a strange idea. Why would investors intentionally invest in companies that score highly on the Value and Momentum Ranks but poorly on the Quality Rank? After all, better quality companies are better, right? The answer has to do with how Quality is objectively measured. The academic literature tends to focus on three aspects: Profitability, Growth, and Safety. To avoid being influenced by short-term effects, practitioners tend to use longer-term measures, but how long-term is long-term? The tendency here is to use five years. This feels long enough to capture trends but short enough that the businesses are not so different as to be meaningless. The Stockopedia Quality Rank uses five-year measures of the following (together with a few other metrics):
- Average Return on Capital Employed
- Gross Profits to Assets
- Average Free Cashflow to Assets Ratio
- Operating Margin Stability
- Sales Growth Consistency
One of the challenges is that although it is well-known that corporate performance tends to mean-revert over periods of three years, some companies can take much longer to change direction. For those that do, the five-year measures may miss a business with positive attributes but going through an extended period of upheaval. This is why high-VM, low-Q stocks are classified as Turnarounds. This doesn’t mean every company with a low Quality score should be considered for investment. Looking through the list of low Quality Rank companies, they are typically the type of speculative dross that investors should give a wide berth. However, when other positive attributes are present, a low Quality Rank shouldn’t be a showstopper.
An Example: Aberdeen (LON:ABDN)
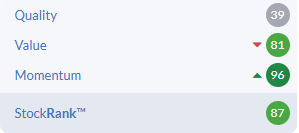
For example, asset management tends to be a pretty good business over the long term, as does being a sharebroker. AJ Bell has always been very highly rated by the market, and Hargreaves Lansdown was attractive enough to receive a cash takeover last year. The third biggest UK sharebroker is Interactive Investor, which is owned by the recently re-vowelled £ABDN. Logic says that this is a reasonable quality business. However, its quality rank is only 39:
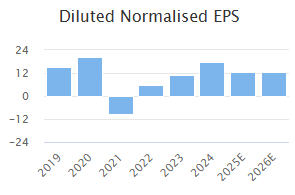
The company has struggled to grow in recent years, with rather mediocre earnings performance in difficult market conditions:
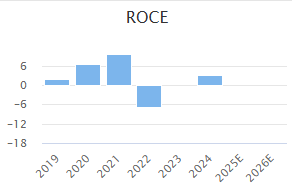
This means that its returns on capital have been single-digit, at best, reflecting these weak earnings:
However, the forward-looking market is starting to look to a potential recovery:
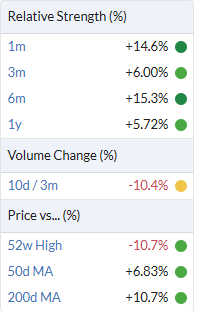
Yet, with a discount to Tangible Book Value and an almost 9% yield, the company is still modestly valued on a number of metrics. This is exactly the type of stock that could be a good turnaround investment going forward, despite a relatively low Quality Rank.
Why invest in turnarounds now?
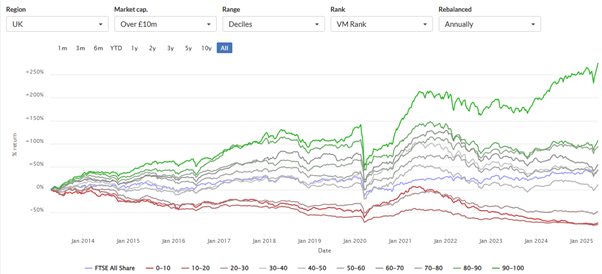
Investing in the top decile of VM-Ranked stocks has significantly outperformed the market over the last year or so:
Zooming in on 2025, the top decile of VM stocks has done especially well since the market wobbles in early April, beating even the market-cap weighted index, something many equal-weight portfolios will have struggled to do recently:
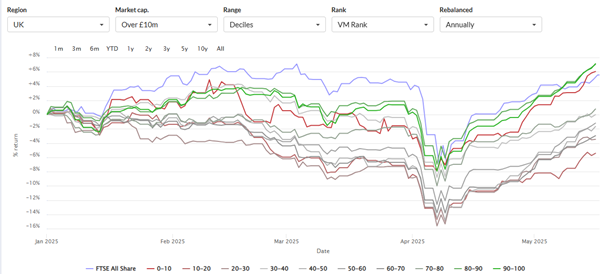
Current market conditions seem favourable to a high-VM investment strategy.
The Screen
I’ve previously written about a turnaround screen, and these were the criteria:
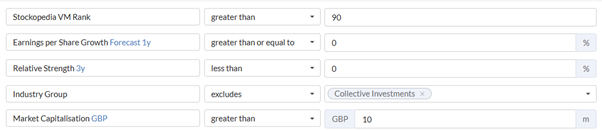
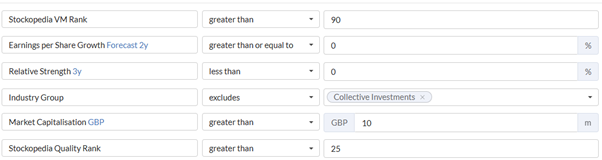
The last time I screened for turnarounds, the big revelation was that I should focus on a very high VM-Rank rather than the Turnaround classification, which may exclude some Super Stocks. In addition to the high VM Rank, I added some criteria that made sense. I wanted stocks whose share price has been underperforming over three years to avoid stocks with stale momentum and hopefully identify those with much further to recover. It makes sense to keep this.
I also added the requirement for forecast EPS to grow, ensuring that positive fundamental changes back the current momentum. However, given where we are in the reporting season and that the market tends to be forward-looking, I have decided to use the 2-year forecast this time instead of the 1-year forecast:

It seems that using the 1-year forecast excludes some stocks due for a strong recovery a bit further in the future.
The big learning point from my recent look at improving the performance of the “crossover” stock styles is that the performance of the high-VM strategy would be significantly improved in recent years by excluding the lowest quartile of the Quality Rank:
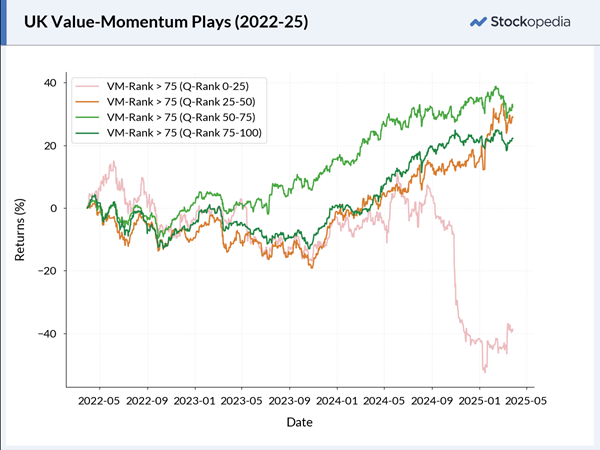
So, it is worth implementing this in the screen. Here’s the updated criteria:
The Results
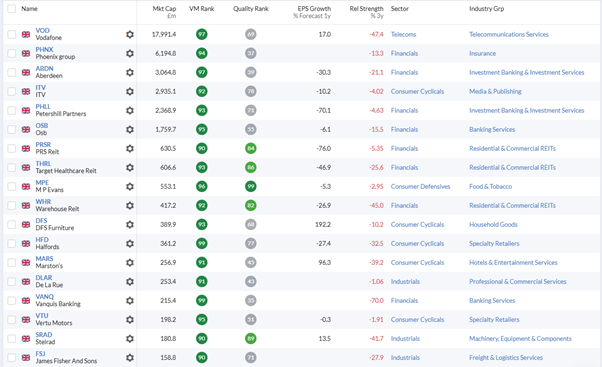
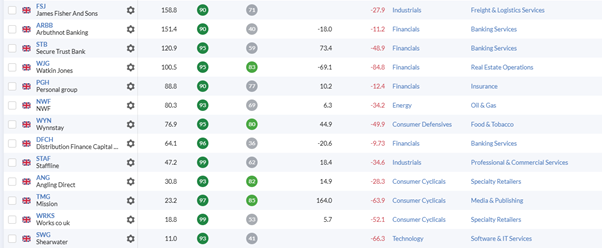
The updated screen currently generates 30 results:
Next week, I’ll take a look at some of the most promising turnarounds from this screen.
Disclaimer
This is not financial advice. Our content is intended to be used and must be used for information and education purposes only. Please read our disclaimer and terms and conditions to understand our obligations.

13 comments
I've asked about abrupt changes before but haven't had an explanation.
Here is the VM chart from last year showing >10% increase in value of the entire basket of shares in a single day - not possible.
It would be really great to have a comment on this from the team because it is of course what Stockopedia's edge is all about. So the data has to be correct.
Yes, this has been mentioned quite a few times in posts and has been completely ignored. Also has been reported by several members, again no response. Completely ignoring reports is not a good way to go on. Now everytime someone does an article based on these figures, it is based on incorrect data. I would have thought finding the error would have been quite easy.
Ed has corrected the error on the VM chart, which came from some changes of tickers and delays in making the changes, which were then allocated to a single day. Many thanks, really good.
Thanks Mark for another interesting article on alternative methods of using the Stocko ratings for recovery stocks.
I have looked at this from two different aspects; i visually sorted the FTSE350 + into those coming off their bottoms & rising, then refined the list to those best reflecting my 'Simple' approach to technical analysis. I used Sharescope Legacy for this and added list columns to show Q ,V,M ,SR, VM as well as Stocko values for EPS growth & Sharescope EPS Growth. Further columns reflect other metrics plus pundit interest as *
This produced a list of 22 Stocks which of course varied from your list but the stock with the lowest 'Q' was DFCH. & the highest MPE. Happily i do also own some of the stocks in your list.
Another great article, one of the screens I use is a VM screen, I've already adjusted my screens to add a rule of Quality >25%
The big learning point from my recent look at improving the performance of the “crossover” stock styles is that the performance of the high-VM strategy would be significantly improved in recent years by excluding the lowest quartile of the Quality Rank:
surely that graph looks suspect - i cant believe a sensible basket of stocks would lose that much value that quickly - is there one overwight stock in that sample here that is producing that nonsensical result?
The VM figures, l believe are incorrect, they went up 12% last July, in one day. Stockopedia have not investigated or corrected this.
I would not trust the figures, it is easy for them to go wrong, delistings, share splits etc.
How many stocks were in the sub Q 25? What were they?
At the moment there are only 7 below Q25, out of the top VM stocks, one is Lloyds Banking (LON:LLOY).
That seems strange, can you share a bit more about where you are seeing this. I can't see it in the graphs. e.g.
And in terms of numbers, there are currently 22 stocks with a VM rank above 75 and a Q rank below 25, which is what the data from the previous article is based on:
I'm not sure its perfect, but it wouln't be unduly influnced by a single stock error, for example.
Is that adjusted for share splits and delistings due to takeovers? Going by previous errors, that does not seem to be the case. One delisting out of 20 stocks can have a considerable impact, as l have found out when checking folios, one is often around 7%, as these are usually takeovers.
l have reported huge errors on Top Stockranks and guru screens, these have been adjusted after some time, one took around 6 months. The Zulu guru screen was on 0% at one time, it should have been over 800%, maybe a delisting? I don't bother reporting these anymore. If support can't even respond to reported errors, what is the point.
Thanks, its obviously not something I can look into directly, but I can flag it to one of the dataheads.
Thanks Mark that would be good. I've posted that chart several times now and it has been steadfastly ignored.
Thanks.
Would be great if you could look at James Fisher And Sons (LON:FSJ) and Distribution Finance Capital Holdings (LON:DFCH) next week. Cheers