Market Musings 130124: Follow the Leaders

Follow the Leaders
What now after an explosive end to 2023?
November and December were excellent months for several asset classes, including stocks, bonds, gold and even listed real estate.
The main motors of this ‘everything rally’ were a combination of lower long-term interest rates (bond yields) plus abundant macro liquidity provided by central banks such as the US Federal Reserve and the People's Bank of China.
In fact November and December represented the biggest 2-month improvement in US financial conditions ever seen! 10-year bond yields declined by around 1% in the US over this period from 5% to 4%.
So while this shift in financial conditions was a boon to investors worldwide, this scale of boost to stocks is unlikely to be repeated.
Over the course of 2024, central banks in the US, Euro area and the UK should begin to cut their benchmark interest rates, as inflation rates continue to return closer to the 2% long-term target. Indeed, in the Euro area inflation rates are likely to fall below 2% sooner rather than later, given the lack of growth and relatively weak household demand, plus lower energy costs.
However, this is already anticipated by financial markets. So this then begs the question: what will propel stock market higher or lower from here?
Many stock markets have returned close to multi-year highs
While UK stocks remain out of favour in relative terms, many other stock markets around the world have rebounded to or close to multi-year highs in the last couple of months: the US S&P 500 and Nasdaq 100, the Japanese Nikkei 225, the Brazilian Bovespa, the Mexican IPC, the Euro STOXX 50 and the Italian FTSE MIB.
Employing a simple Dual Momentum asset allocation strategy
One way to decide whether or not to continue to invest in stocks now is via a mechanical strategy such as the Dual Momentum Strategy.
In its simplest form, Dual Momenum considers two types of momentum to choose which asset class to invest in, between stocks, bonds and cash:
Absolute momentum: has the asset gone up over a specified time period (such as 12 months) or not? Then consider
Relative momentum: which of two assets (eg global stocks and global bonds) has performed best over this same time period (12 months again)?
Such a simple mechanical asset allocation choice can be repeated monthly.
You may not enter at the lows or exit at the highs, but this is not the purpose of the strategy. It is rather to allow investors to easily ride long-term uptrends in stocks or bonds, but then to protect investors from losing too much in a protracted bear market where stock markets can fall up to 50% from top to bottom.
I personally prefer a shorter ‘look back time period over which to measure this absolute and relative momentum of stocks and bonds, typically 6 months. A shorter time period may be more sensitive to identify potential uptrends earlier, but has a greater risk of being ‘whipsawed’ in and out of stocks with greater costs in a sideways market without a clear up or down trend.
As of 13 January, what does Dual Momentum favour?
The steps to take are as follows:
Look at the performance of global stocks (I use here an ETF of the MSCI World stock index to represent stocks) and of global bonds (I use here an ETF of the Barclays Bloomberg world government bond index) ove the ast 6 months, i.e comparing the index level in mid July to today’s level.
Are either or both of these stock and bond indices higher today than in July?
If YES, then proceed to the next step. If NO then you should then be in cash for the next month (selling any positions from the previous month).
Global stocks and global bonds have both gone up since July
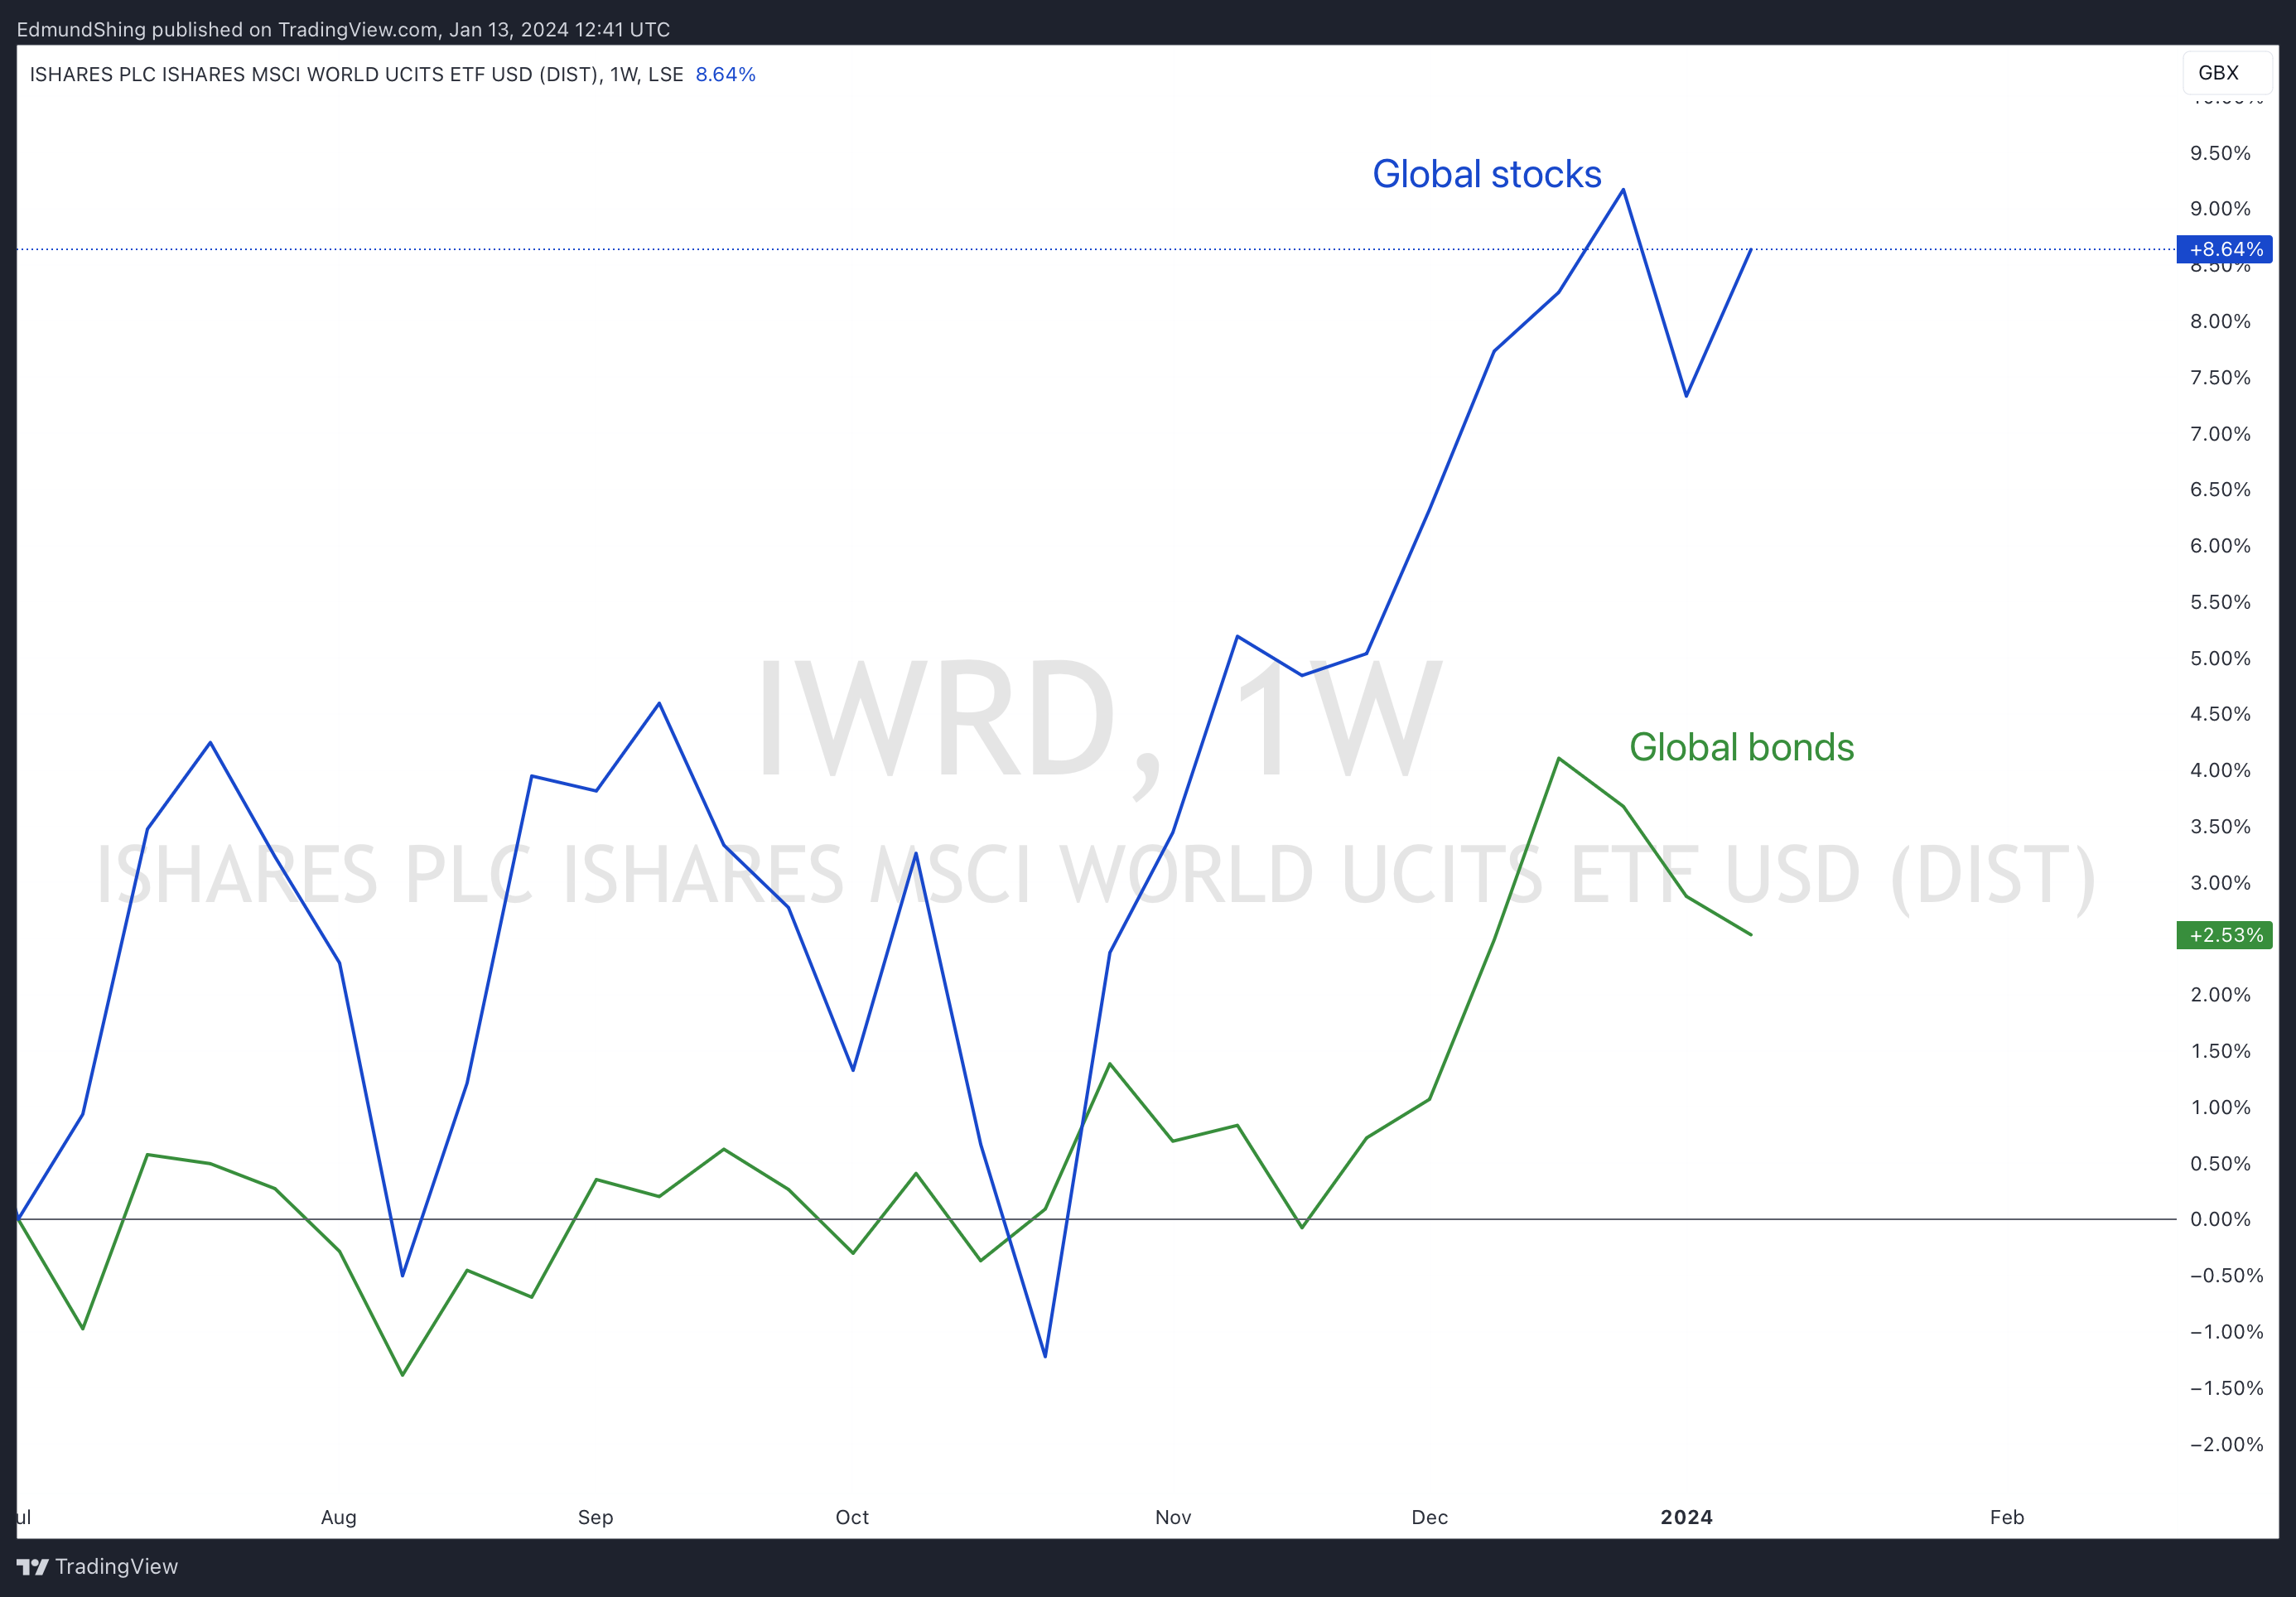
In this case, both stocks and bonds have gone u over the last 6 months.
Step 2: which of stocks and bonds have gone up the most over the last 6 months, i.e. which asset shows the best relative momentum?
The answer here is clear: stocks.
In the simplest form of the Dual Momentum strategy, you would then invest in global stocks (e.g. via buying an MSCI World index ETF) and hold it for 1 month, when you would then repeat this process.
Selecting a favoured stock market or sector
But we can go further with this trend-following approach. Rather than just buying the world stock market we can try to identify which area or sector has the strongest uptrend, again by comparing relative performance of regions over the last 6 months.
In order to be even more selective, we can add a further simple condition which is frequently used in simple trend-following systems.
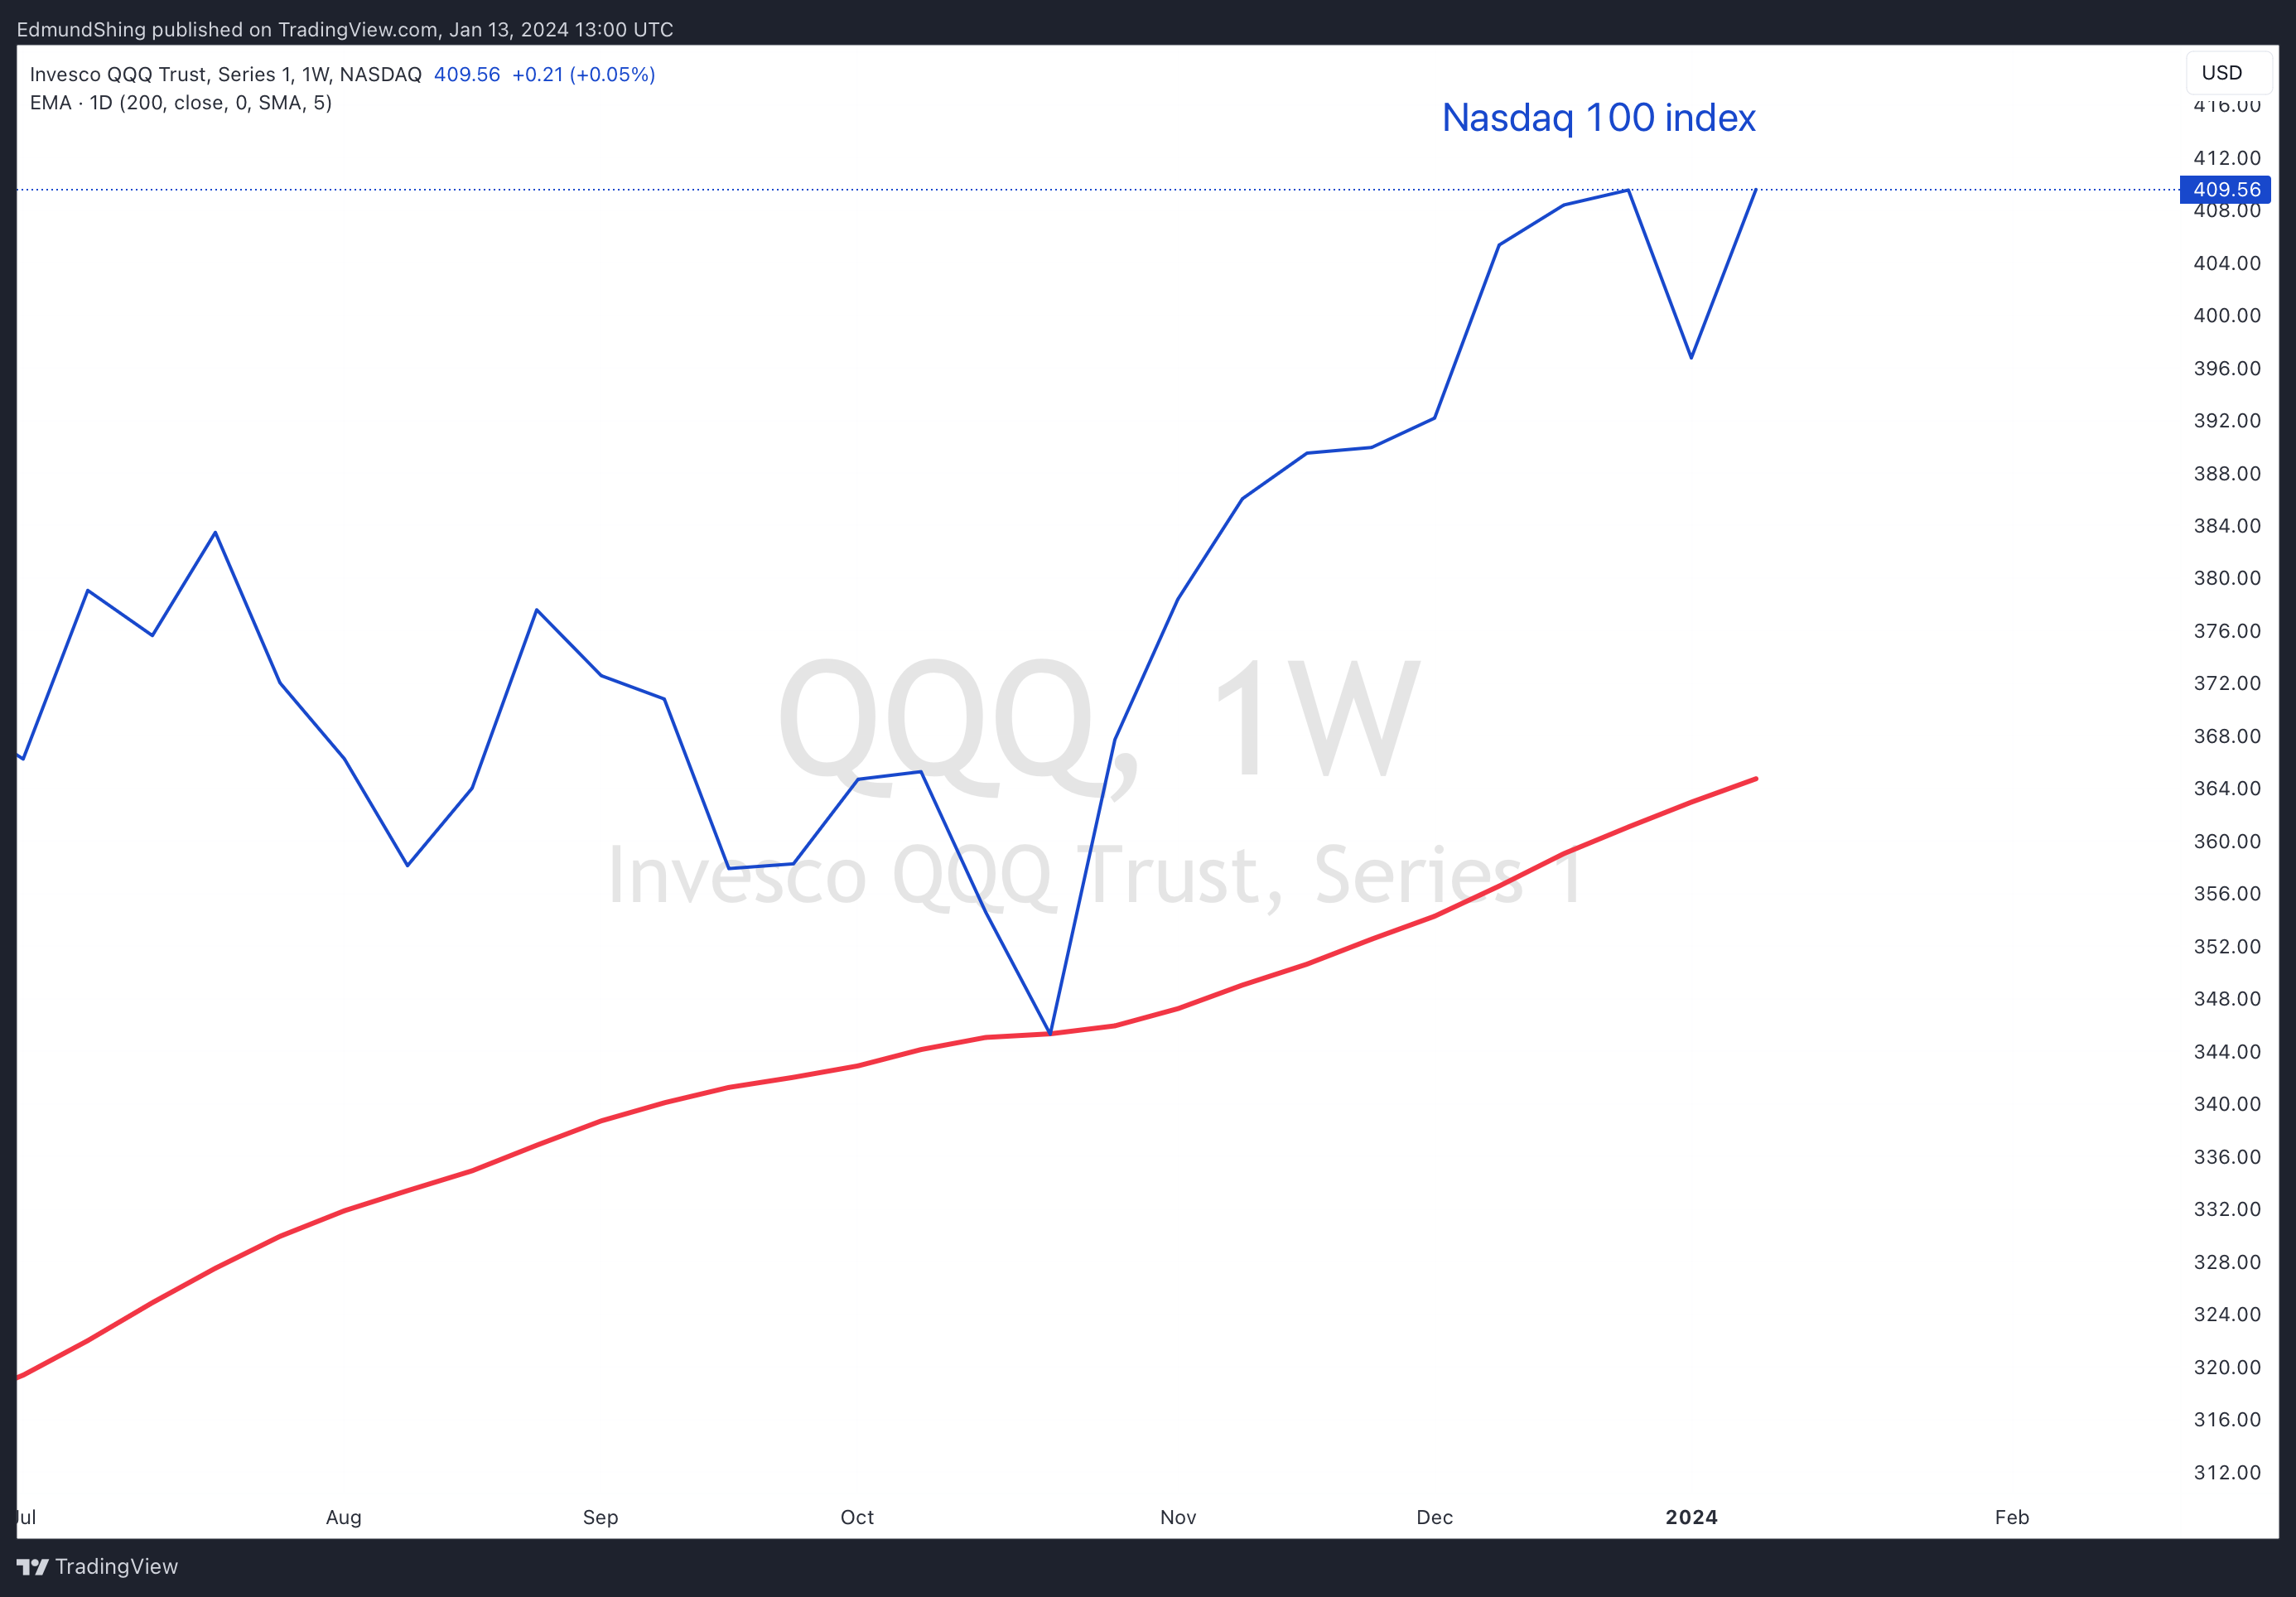
We can consider only stock markets or sectors that have not only gone up over the last 6 months but which are also above their own 200-day moving averages. The 200-day moving average is a way to identify the longer-term trend of a stock or index, so being above the 200-day moving average is another positive trend signal.
US Nasdaq 100 index: Rising, higher over the last 6 months, above its 200-day moving average (in red)
Indices and sectors to consider
Aside from the Nasdaq 100 index, other indices and sectors that look attractive on this rising trend basis include the:
Japanese Nikkei 225 index
MSCI Latin America index (largely Brazil and Mexico)
Italian FTSE MIB index
SOXX Semiconductor sector
IBB Biotech sector
URA Uranium miners
XLV US Heathcare
EXV4 Europe Healthcare
IYW US Technology
From this list, you can then perhaps select one or more to invest in for at least the next month, or for as long as the current uptrend holds in place.
My best for the week ahead,
Edmund
Disclaimer
This is not financial advice. Our content is intended to be used and must be used for information and education purposes only. Please read our disclaimer and terms and conditions to understand our obligations.
12 comments
I'm experimenting with Dual Momentum in part of my portfolio. To overcome the psychological difficulty mentioned by Ben Carlson's web page here:
https://awealthofcommonsense.c...
of going 'all in' at any one time, I am using a 'rotational' strategy in the Dual Momentum part of my portfolio. I own a few different ETFs that have performed well over the previous year, based on the 'total return' data that is available on the justETF website. If the performance of any of my ETFs declines relative to another in my pre-prepared list of candidate ETFs that is not currently in my portfolio, I will sell and replace that ETF with the better performing one (assuming the replacement ETF had a non-negative previous 1-year return). My hope is that this will lead to gradual changes in this part of my portfolio over a year, rather than the abrupt changes implied by Gary Antonacci's original Dual Momentum strategy.
That’s very interesting. I am keen to test this strategy with at least part of my portfolio. Of course, I immediately want to finesse the system as Edmund suggested by looking for sectors with the highest momentum rather than just sticking with MSCI/global bonds/ cash or money market fund.
Sorry for asking a basic question but can anyone recommend a website/resource which has charts covering various indices with moving averages etc? I am registered on Stocko but only for UK shares, and use Interactive Investor to trade.
Any suggestions welcome!
TradingView, free option should meet your needs. Stocko charts likely would too! (Search for the index ticker, ie NDX, UKX, SPX etc, select chart and add your indicators). If prefer external option see below for the one I use.
https://www.tradingview.com/
Hi Derek,
You wrote: "can anyone recommend a website/resource which has charts covering various indices with moving averages etc?"
I've created a fantasy Folio on Stockopedia containing ETFs that are available on the UK stock market that track the indices I'm interested in. Most ETFs have low tracking errors and low Total Expense Ratios, so they track their indices fairly closely.I can then view the past performances of the ETFs in the Folio graphically using the Chart View option. If I select a view range of 3 or 6 years, the 200 day Simple Moving Average curve is displayed on the chart of each ETF.
I also find the justETF website useful. Unfortunately, it doesn't provide information on moving averages, so I use the previous 1-year % total return as a proxy for the 200 day moving average.
For example, the ETF with ticker code SWDA tracks the total return of the MSCI World index (which tracks stocks from 23 developed countries), CSP1 tracks the S&P 500 index, CNX1 tracks the NASDAQ 100, CUKX tracks the FTSE 100, FTAL tracks the FTSE All Share, IGLT tracks UK Gilts, INXG tracks UK index-linked Gilts, AGBP tracks a global aggregate bond index hedged to GBP, and SGLN tracks the spot price of gold.
Hi Edmund,
Thanks for this very interesting post.
You wrote: "We can consider only stock markets or sectors that have not only gone up over the last 6 months but which are also above their own 200-day moving averages."
Perhaps a roughly equivalent approach to the one you suggested might be to use the justETF website to rank ETFs that are available on the UK stockmarket by their 6 month previous total returns, but to only consider those ETFs that have both positive 6 month and 1-year total returns. To minimise trading costs, it might be prudent to only consider ETFs that are larger than £500 million, because they are likely to have the lowest bid-offer spreads.
I watched the dual momentum presentation on Gary Antonacci’s website and the performance he claims is impressive. What's more, he seemed to have taken a scientific approach and effectively back tested his strategy. I came away feeling quite enthusiastic about dual momentum.
Then I decided to look at the Amazon book reviews for his book. Now, these are generally very positive, but what I found more interesting were the detailed criticisms of his methodology in the small number of well written 1 and 2* reviews, for instance here. These provide some useful balance.
I got the impression he is actively promoting dual momentum as part of his business (and selling his book) and is not inclined to talk any potential disadvantages. For instance, it may give better bear market performance but at a greater risk of rare but large whipsaw losses (buying high, selling low). Worse, there were some issues raised about selective use of data to bolster his arguments. It's hard to know how to weigh these criticisms without spending a lot of time on the subject, but it's good to know they exist.
I came away feeling that I should probably use momentum more in allocating between tracker funds, bonds and cash (as opposed to buy and hold in my case) but unconvinced I should go all in on his method. I'd be interested to hear others thoughts.
Hi Richard, I've read Gary Antonacci’s 'Dual Momentum Investing' book and looked at his website and and found them both readable and interesting. I've also read the critical Amazon book review you linked to by yogiyoda: https://www.amazon.com/review/...
Another web page commenting on Antonacci's strategy is this one by Ben Carlson: https://awealthofcommonsense.c...
It seems to me that both 'buy and hold' and 'Dual Momentum' have pros and cons as investment strategies, but when one strategy is performing well the other is likely to be performing less well. So a compromise approach would be to use 'buy and hold' for part of one's portfolio and 'Dual Momentum' for the remainder. The relative weightings of those two parts would be up to individual investors to decide what suits them best.Hi,
Ben Carlson's comments are an interesting read, thanks for that. He's not wrong about the psychological factors. I'd struggle pulling out of UK equities, I'm frightened I'll miss out on the mean reversion I've been waiting so long for!
Very interesting idea Edmund, but I'd forever be churning my portfolio surely - as a largely buy & hold investor for my core portfolio surely its time in the market that counts?
Kevin,S1 There are more ways of killing a cat than choking it with cream!
Interesting. I know dual momentum works for stocks, but any back tests for asset classes?
Hi there
yes check dualmomentum.net, Gary Antonacci’s website . He discusses his Global Equity Momentum strategy there.
best
edmund