Market Musings 140226: Continued Rotation to Cyclicals from Tech

Market Musings 140226: Continued Rotation to Cyclicals from Tech
Podcast this week:
Our Investment Strategy for February 2026 (click on link to listen)
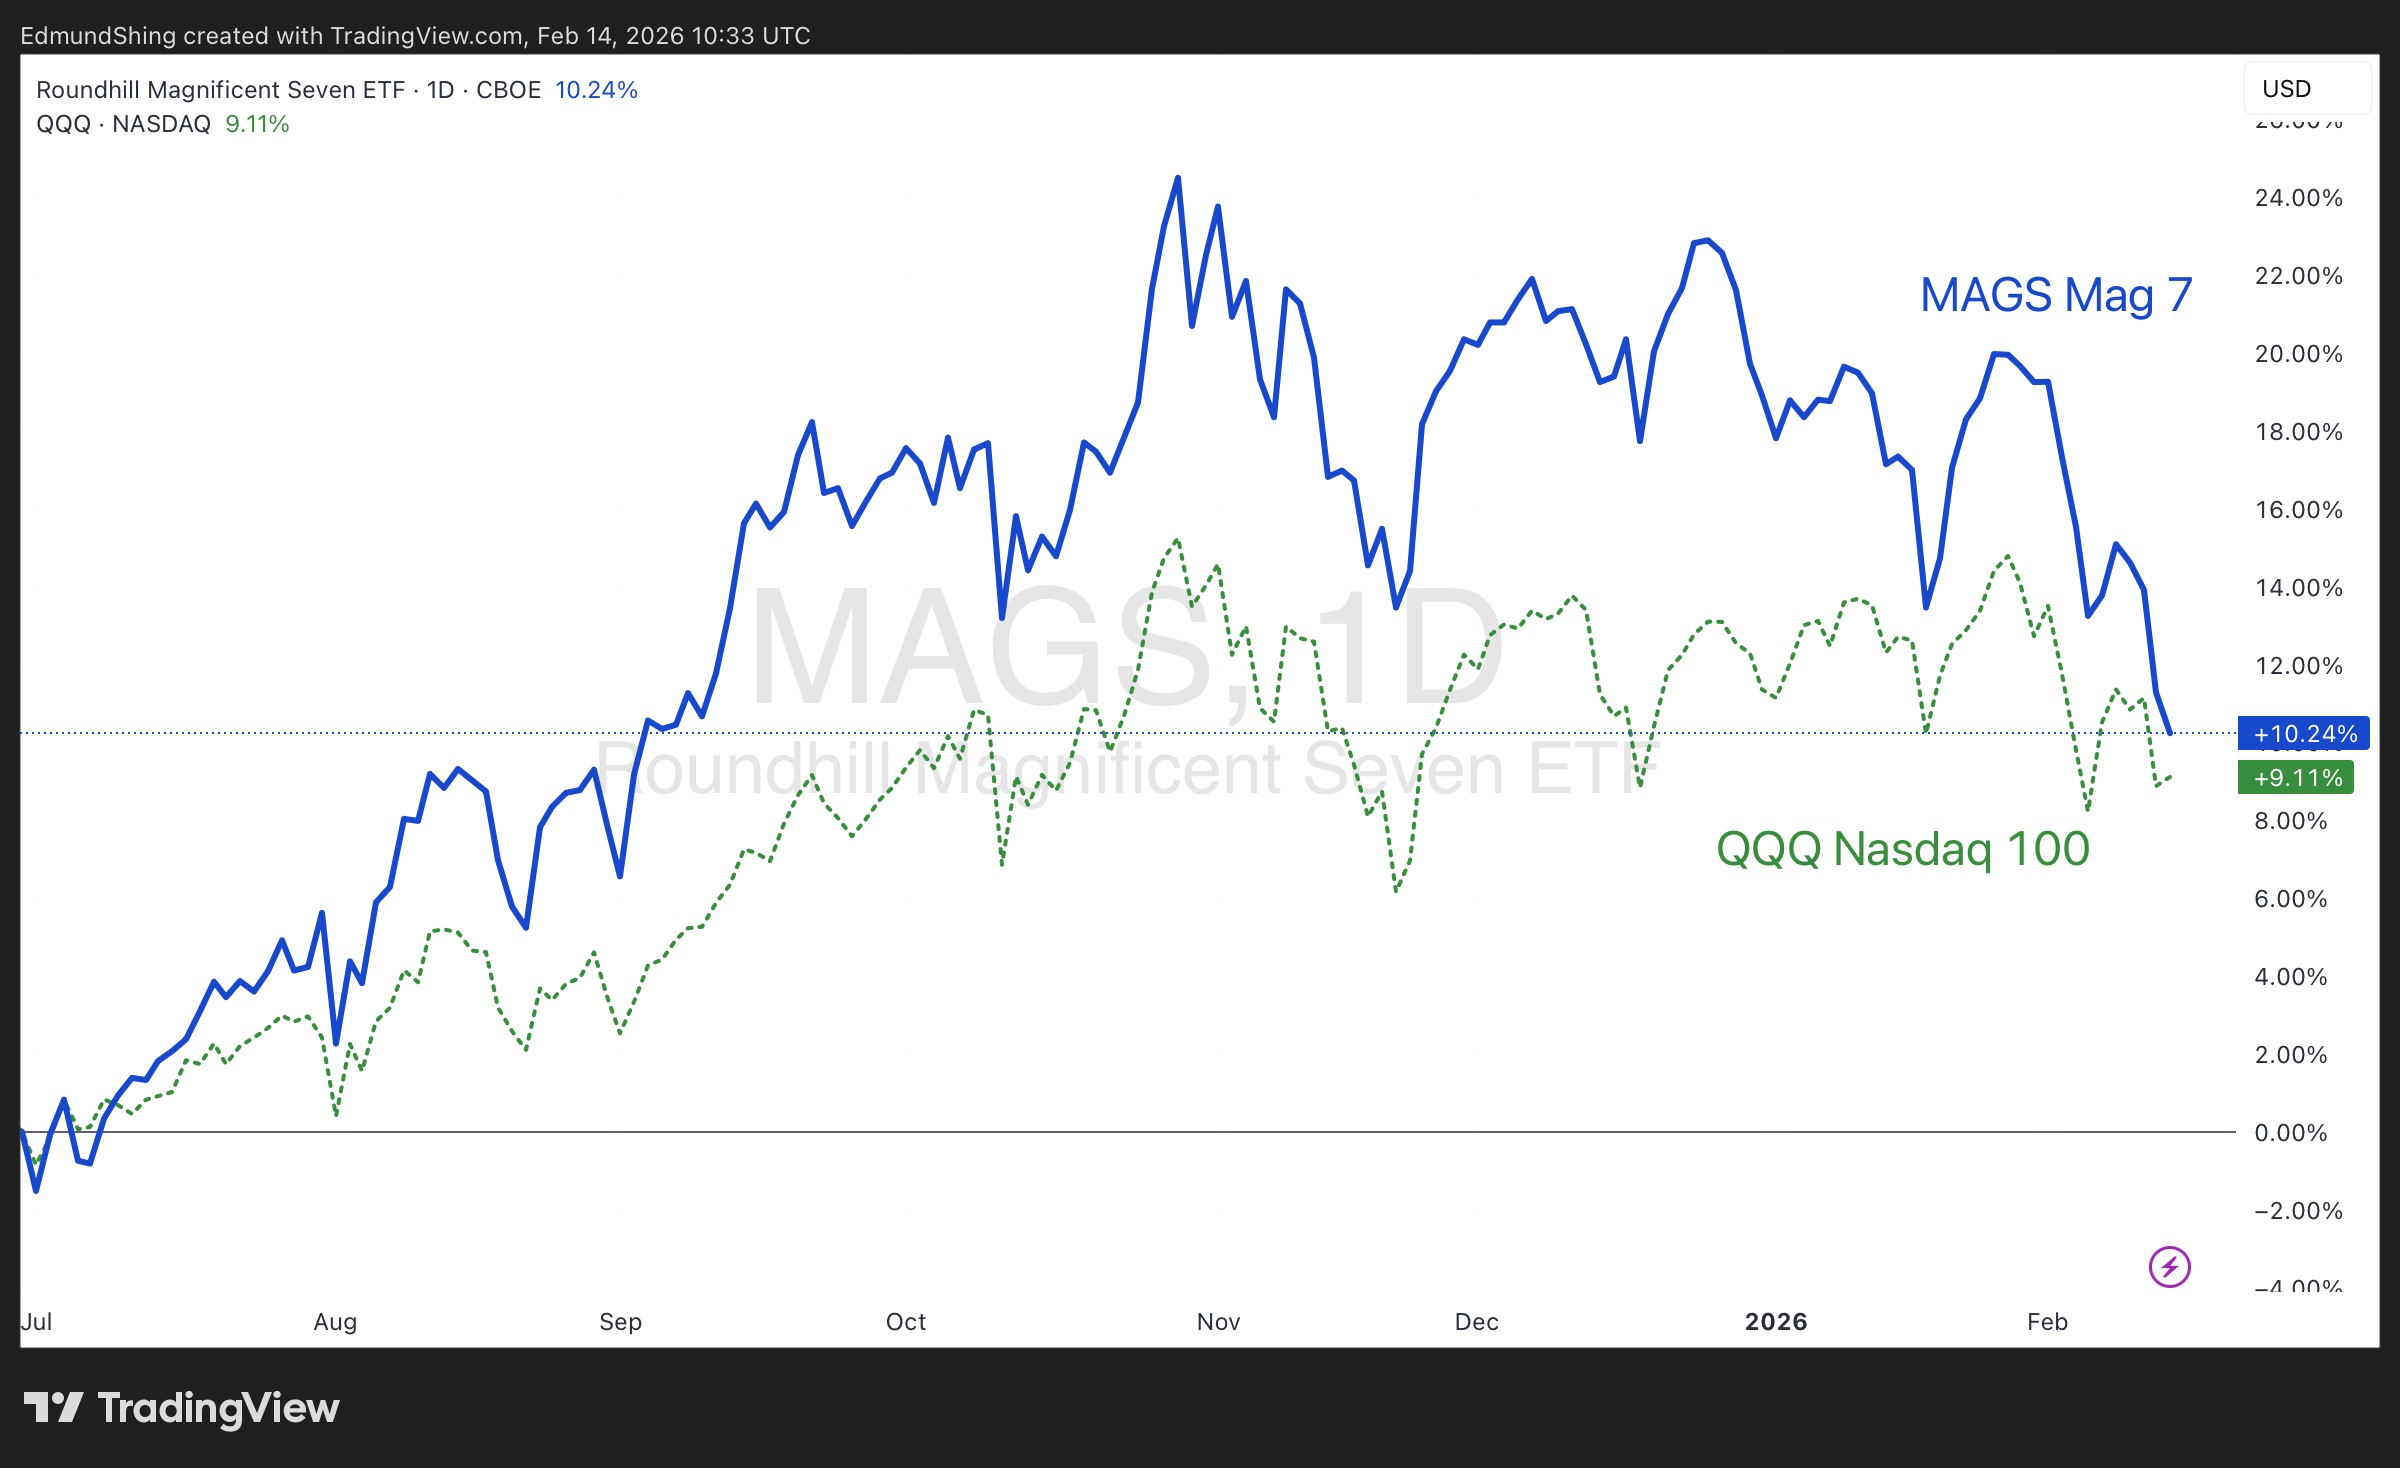
1 Continued breakdown in US mega-cap tech
As estimates rise for AI/data centre investment spending by US hyperscalers (including Oracle) to over $650bn for this year - far in excess of the huge amount already spent in 2025 - concerns rise over the rise in debt funding necessary and the long-term profitability to come from this massive wave of investment.
Breakdown in Mag 7 momentum
2 Rotation in US stocks to Equal-Weight S&P 500, Small-Caps
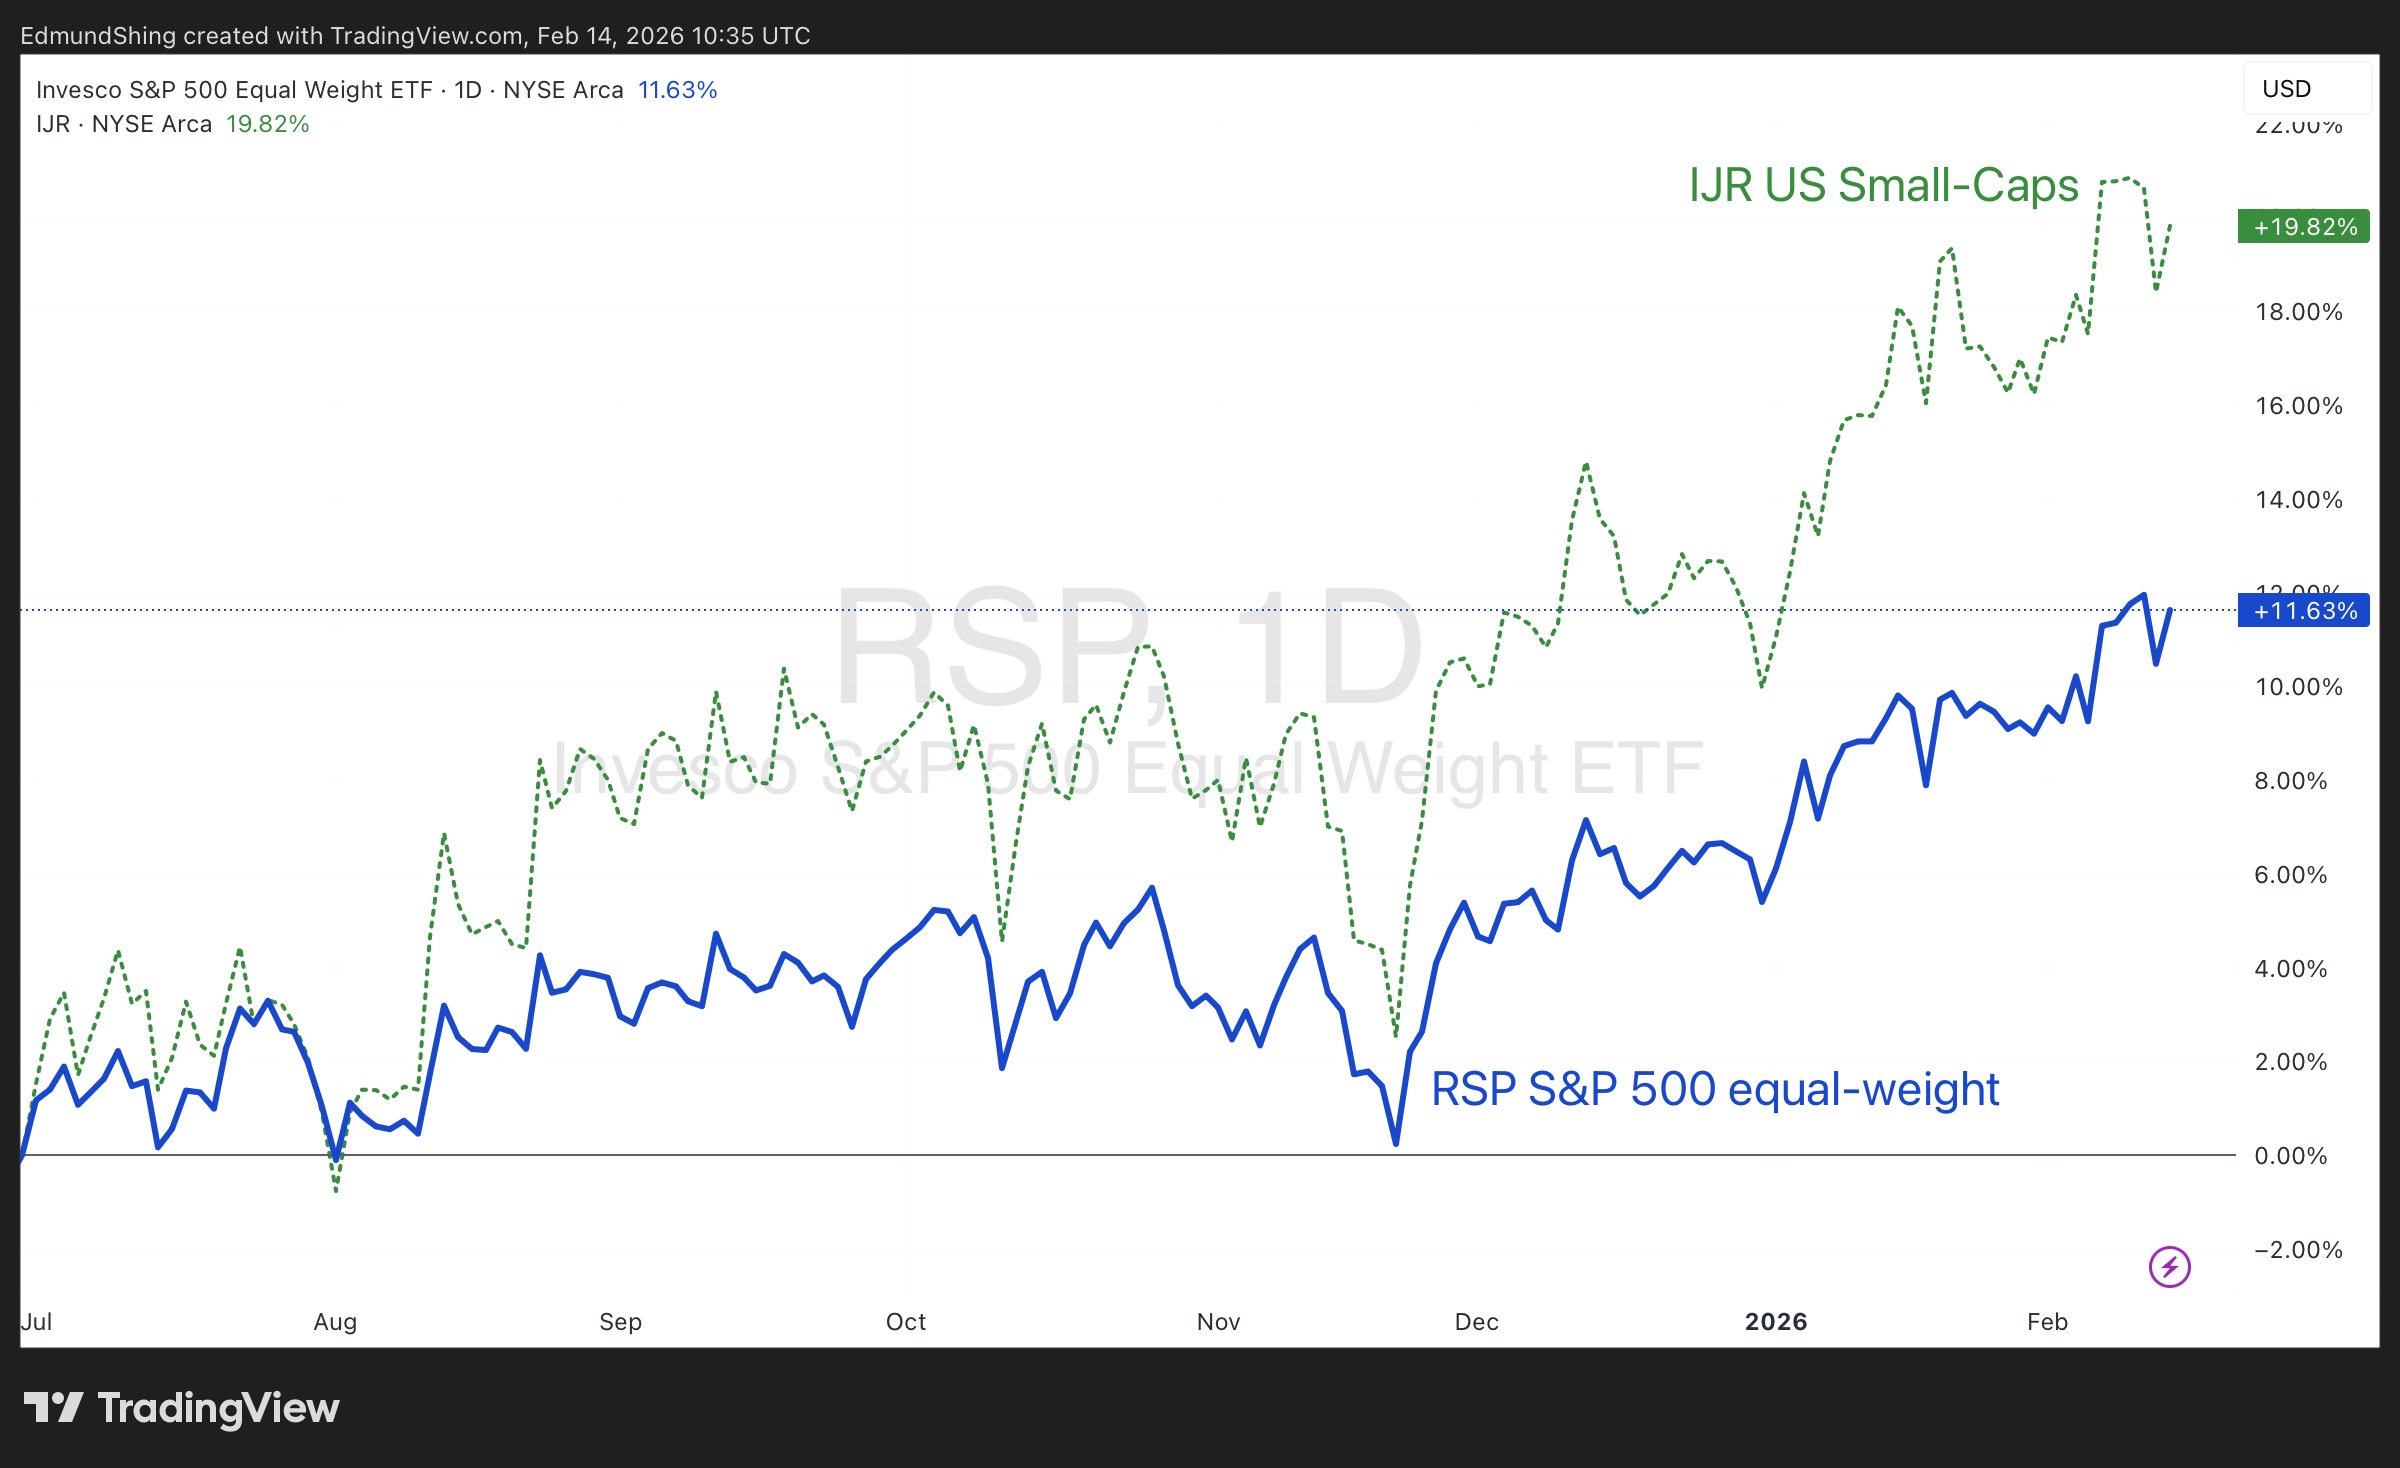
With under-performance of the US mega-cap tech and software stocks comes a rotation in performance towards other sectors and small-cap segments of the US stock market. The equal-weight version of the S&P 500 index is outperforming its classic market cap-weighted version given its broader diversification and lower weighting to Tech. Note that over time, equal-weight indices typically outperform their cap-weighted cousins by 0.5%-1%,but that this has not been true over the last few years in the case of the US.
US Leadership moves to rest of S&P 500, Small-Caps
3 Despite the recent correction , commodity-related themes still show strong momentum
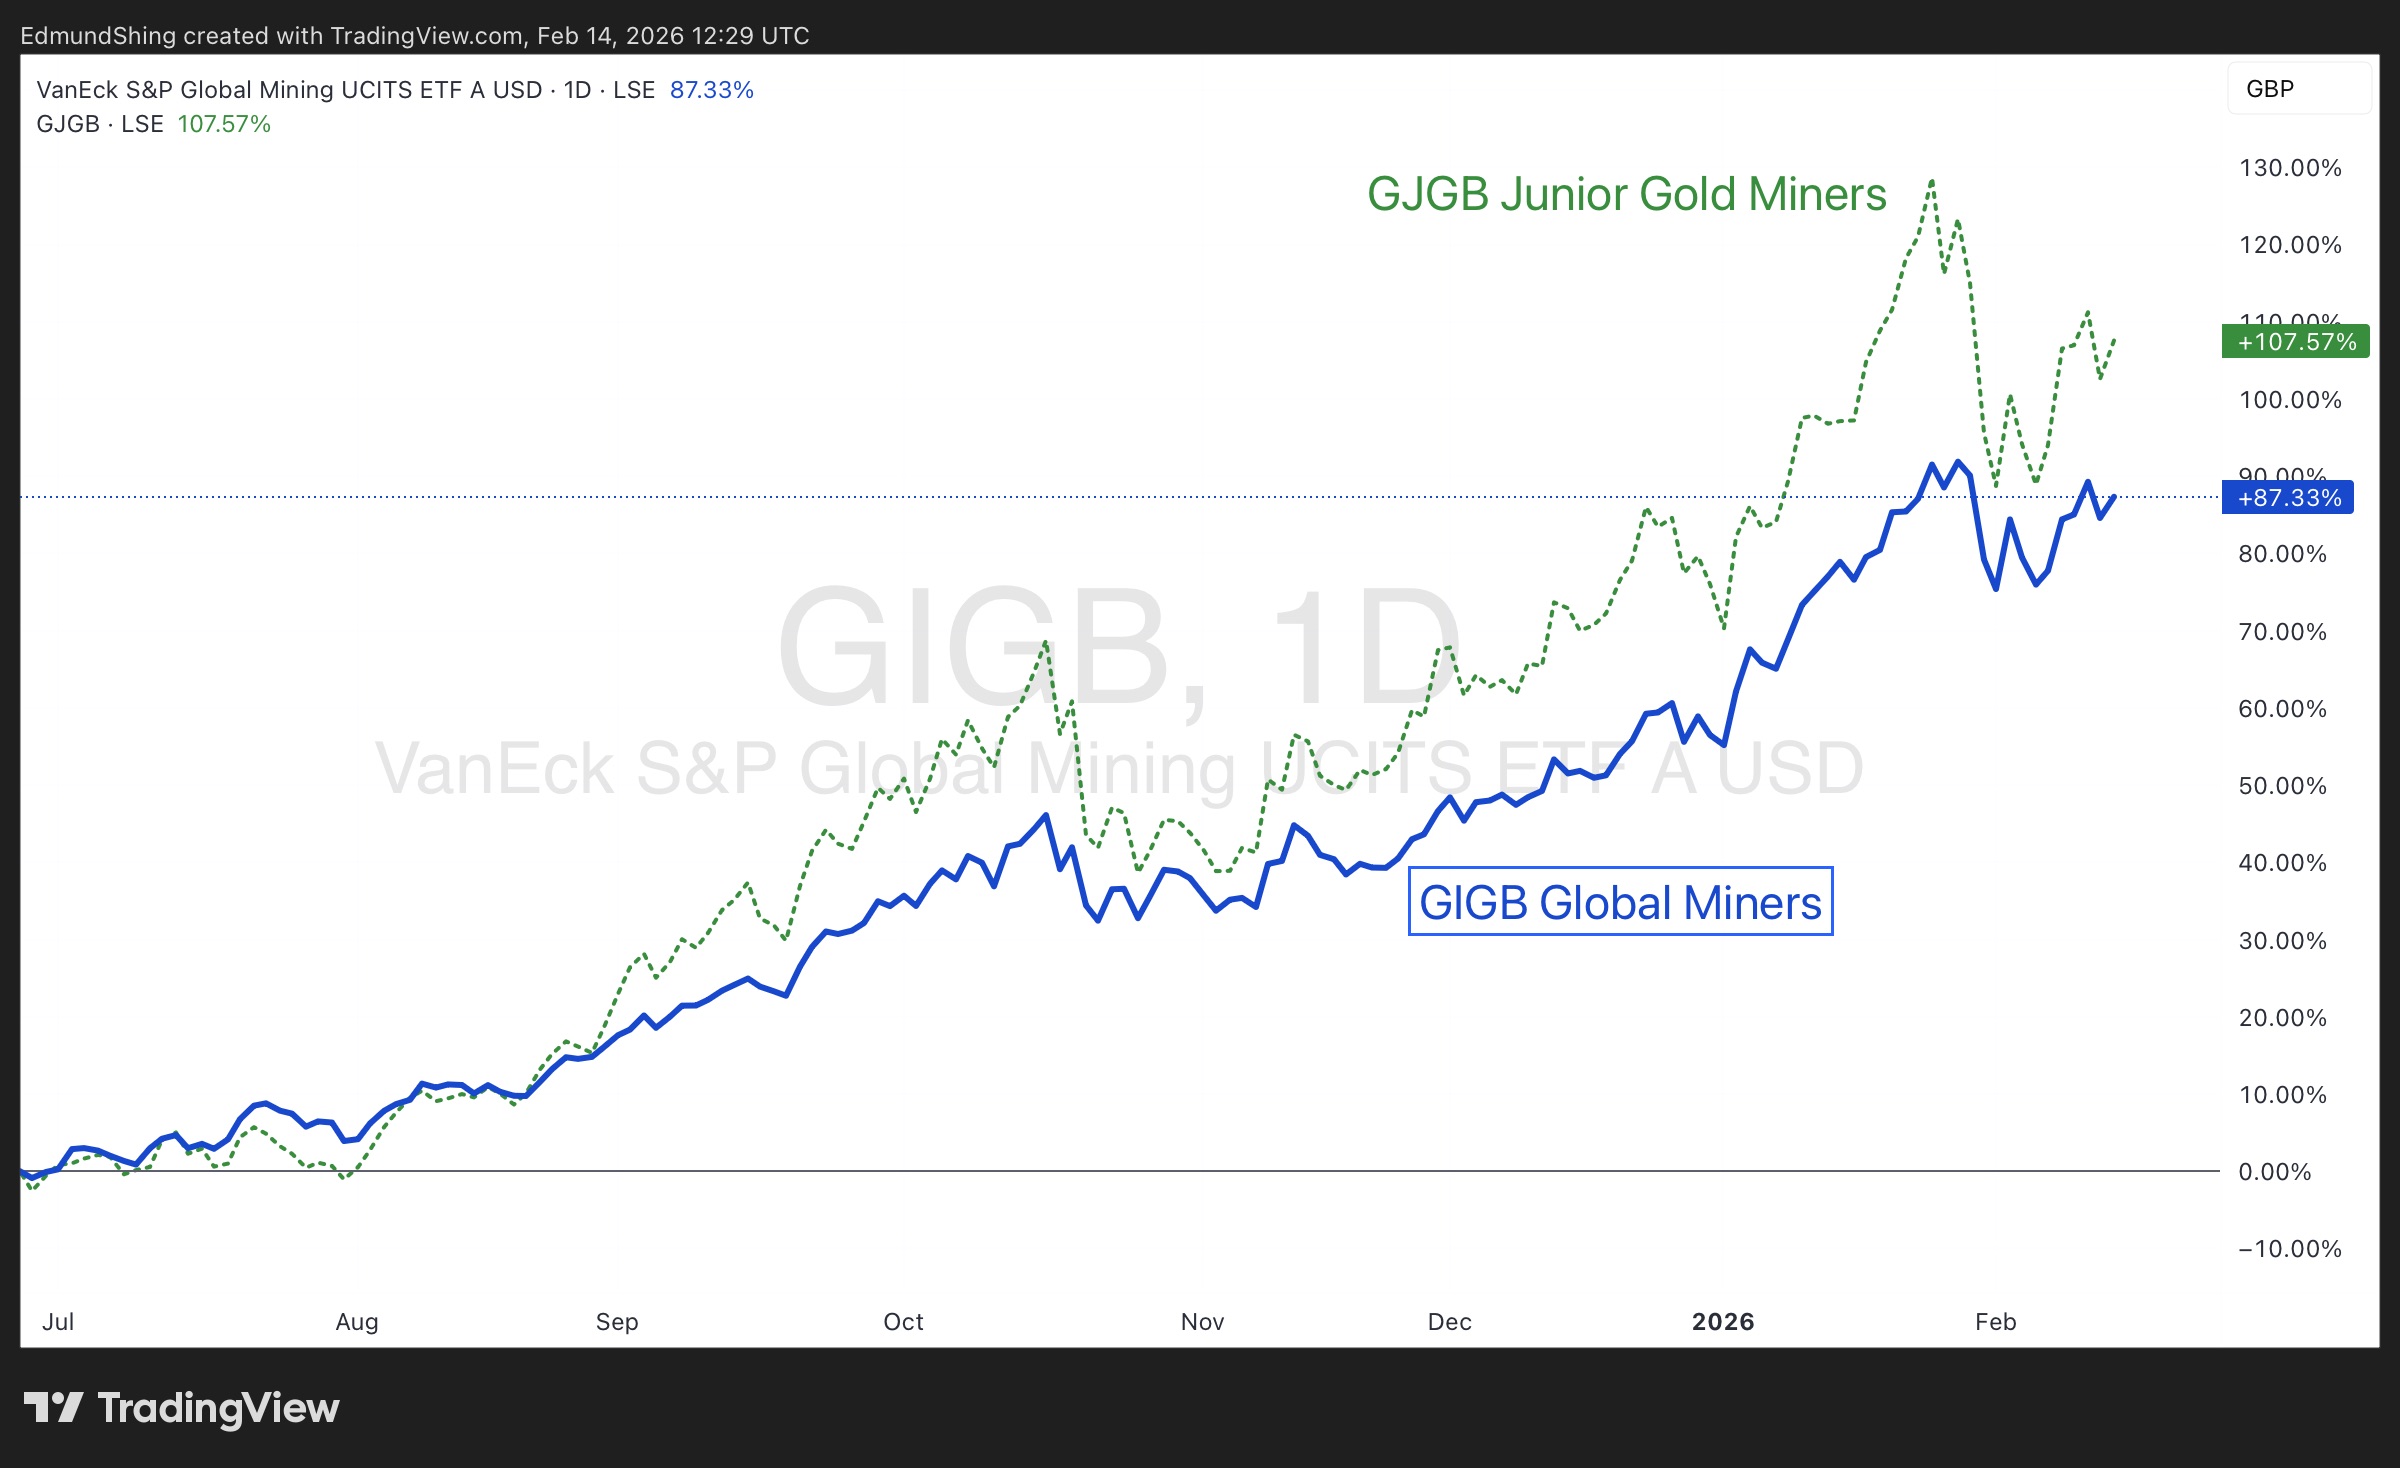
While gold, silver, copper and uranium have all suffered price corrections since January 28, they remain in solid long-term uptrends.
My favourite commodity-related themes remain the following:
Industrial metals such as copper,aluminium and tin and associated miners.
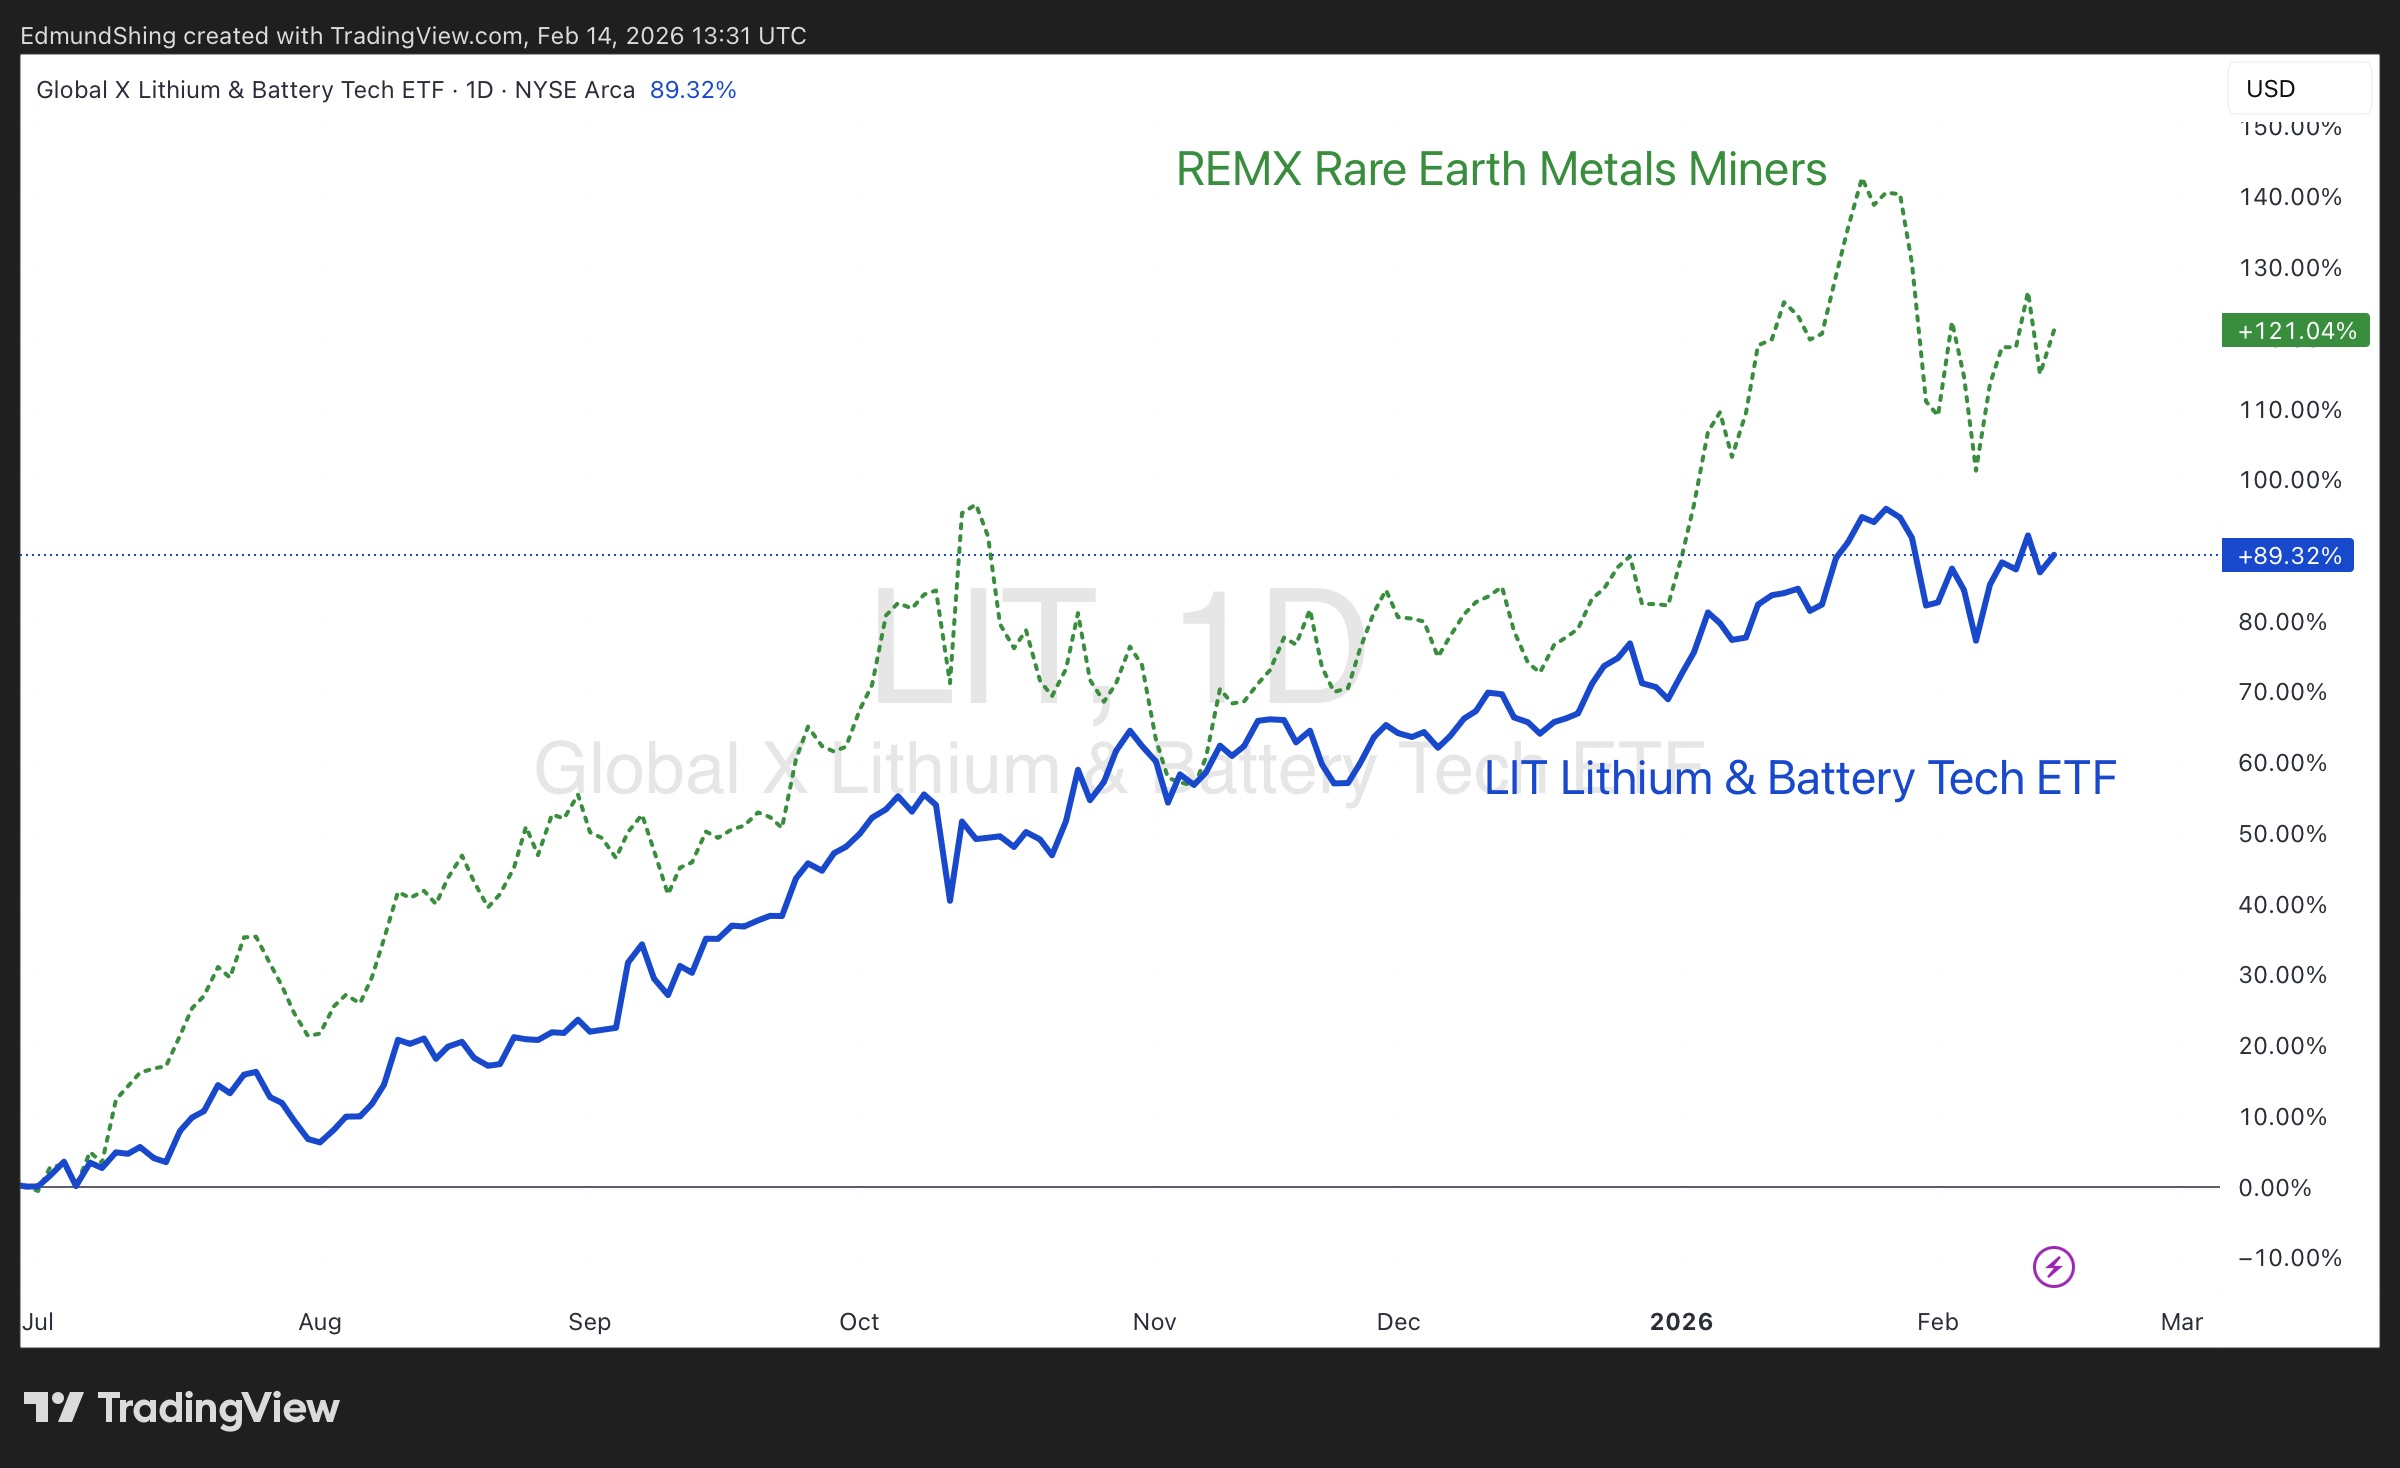
Lithium and rare earth metals
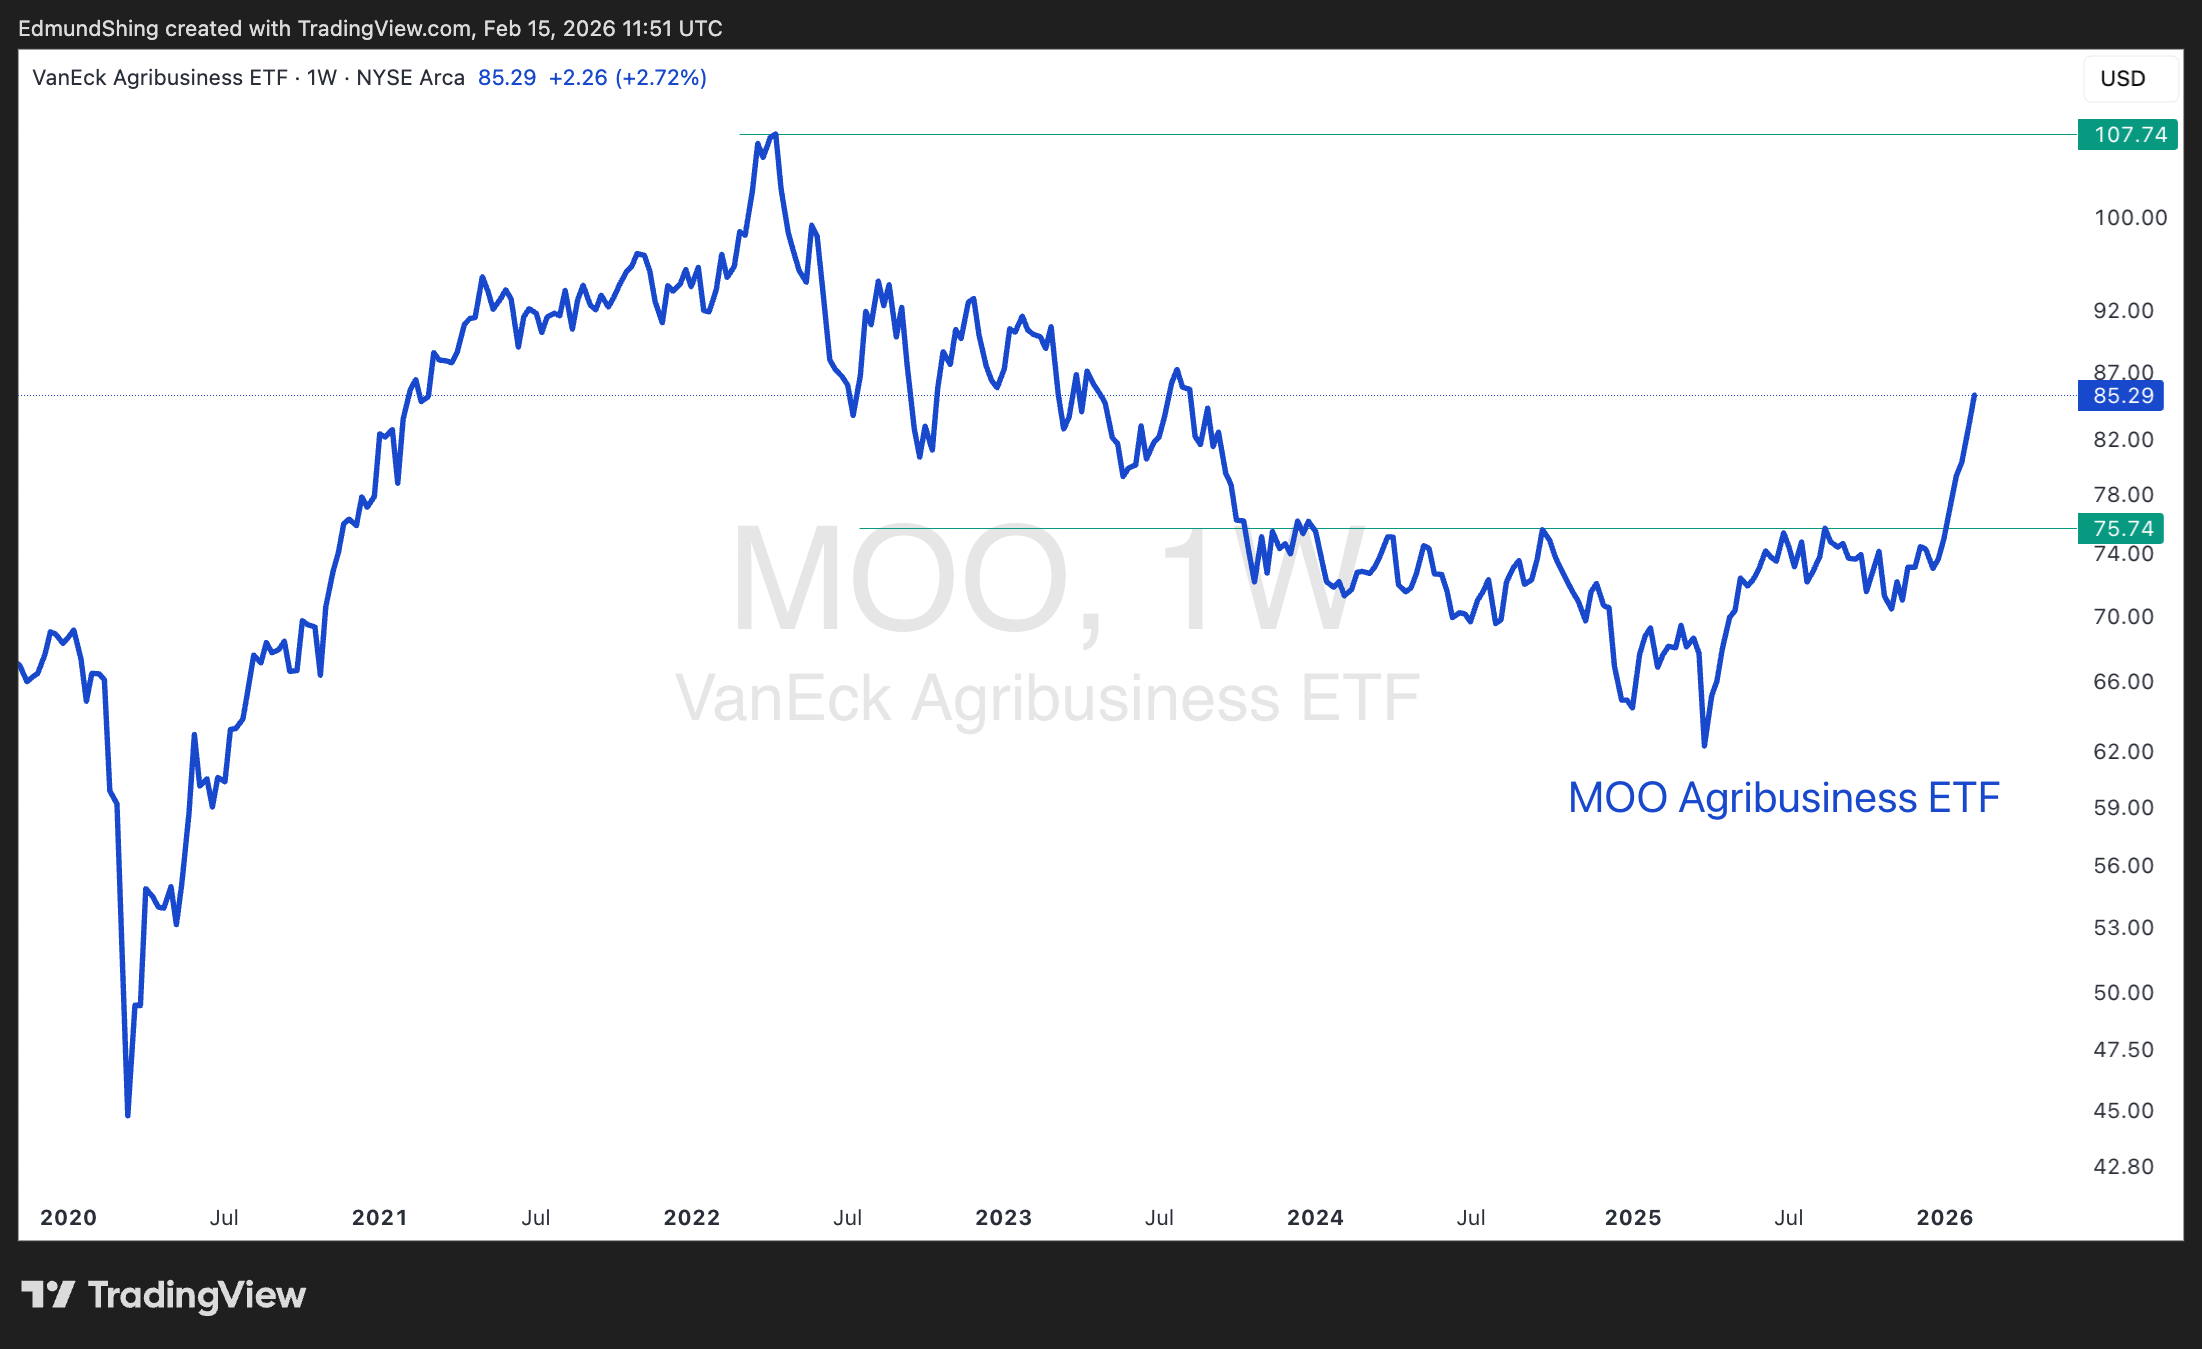
Agribusiness and fertiliser exposure
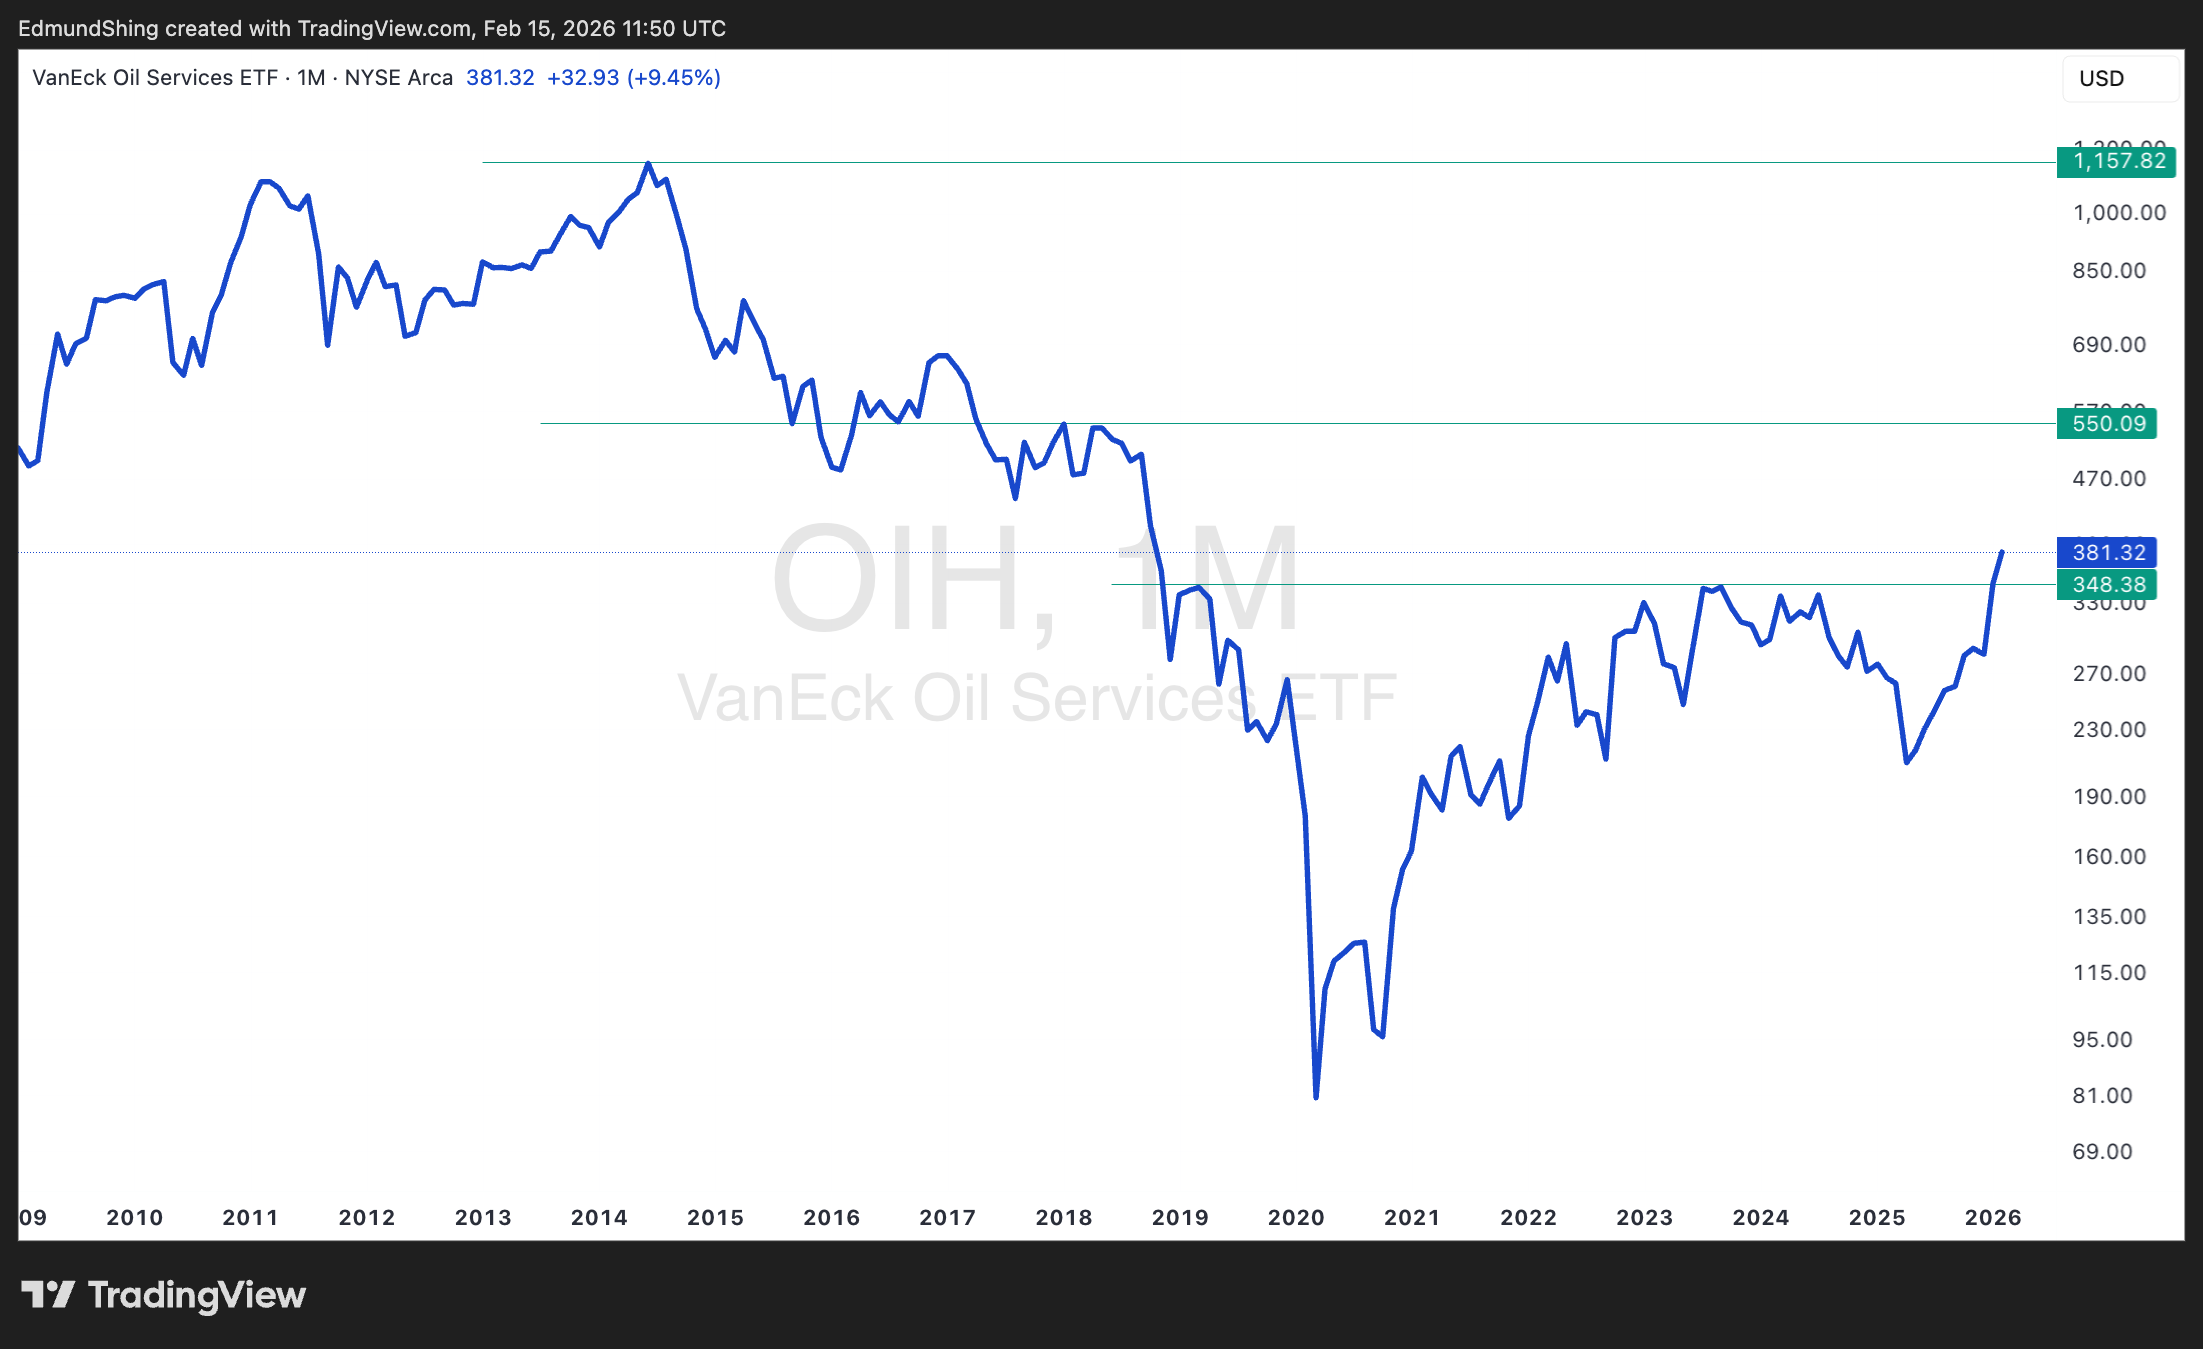
Oil & Gas, specifically Canadian and European oil majors and global oil services
Rare Earth, Lithium miners remain in uptrend despite correction
Oil Services Break out despite weak oil price
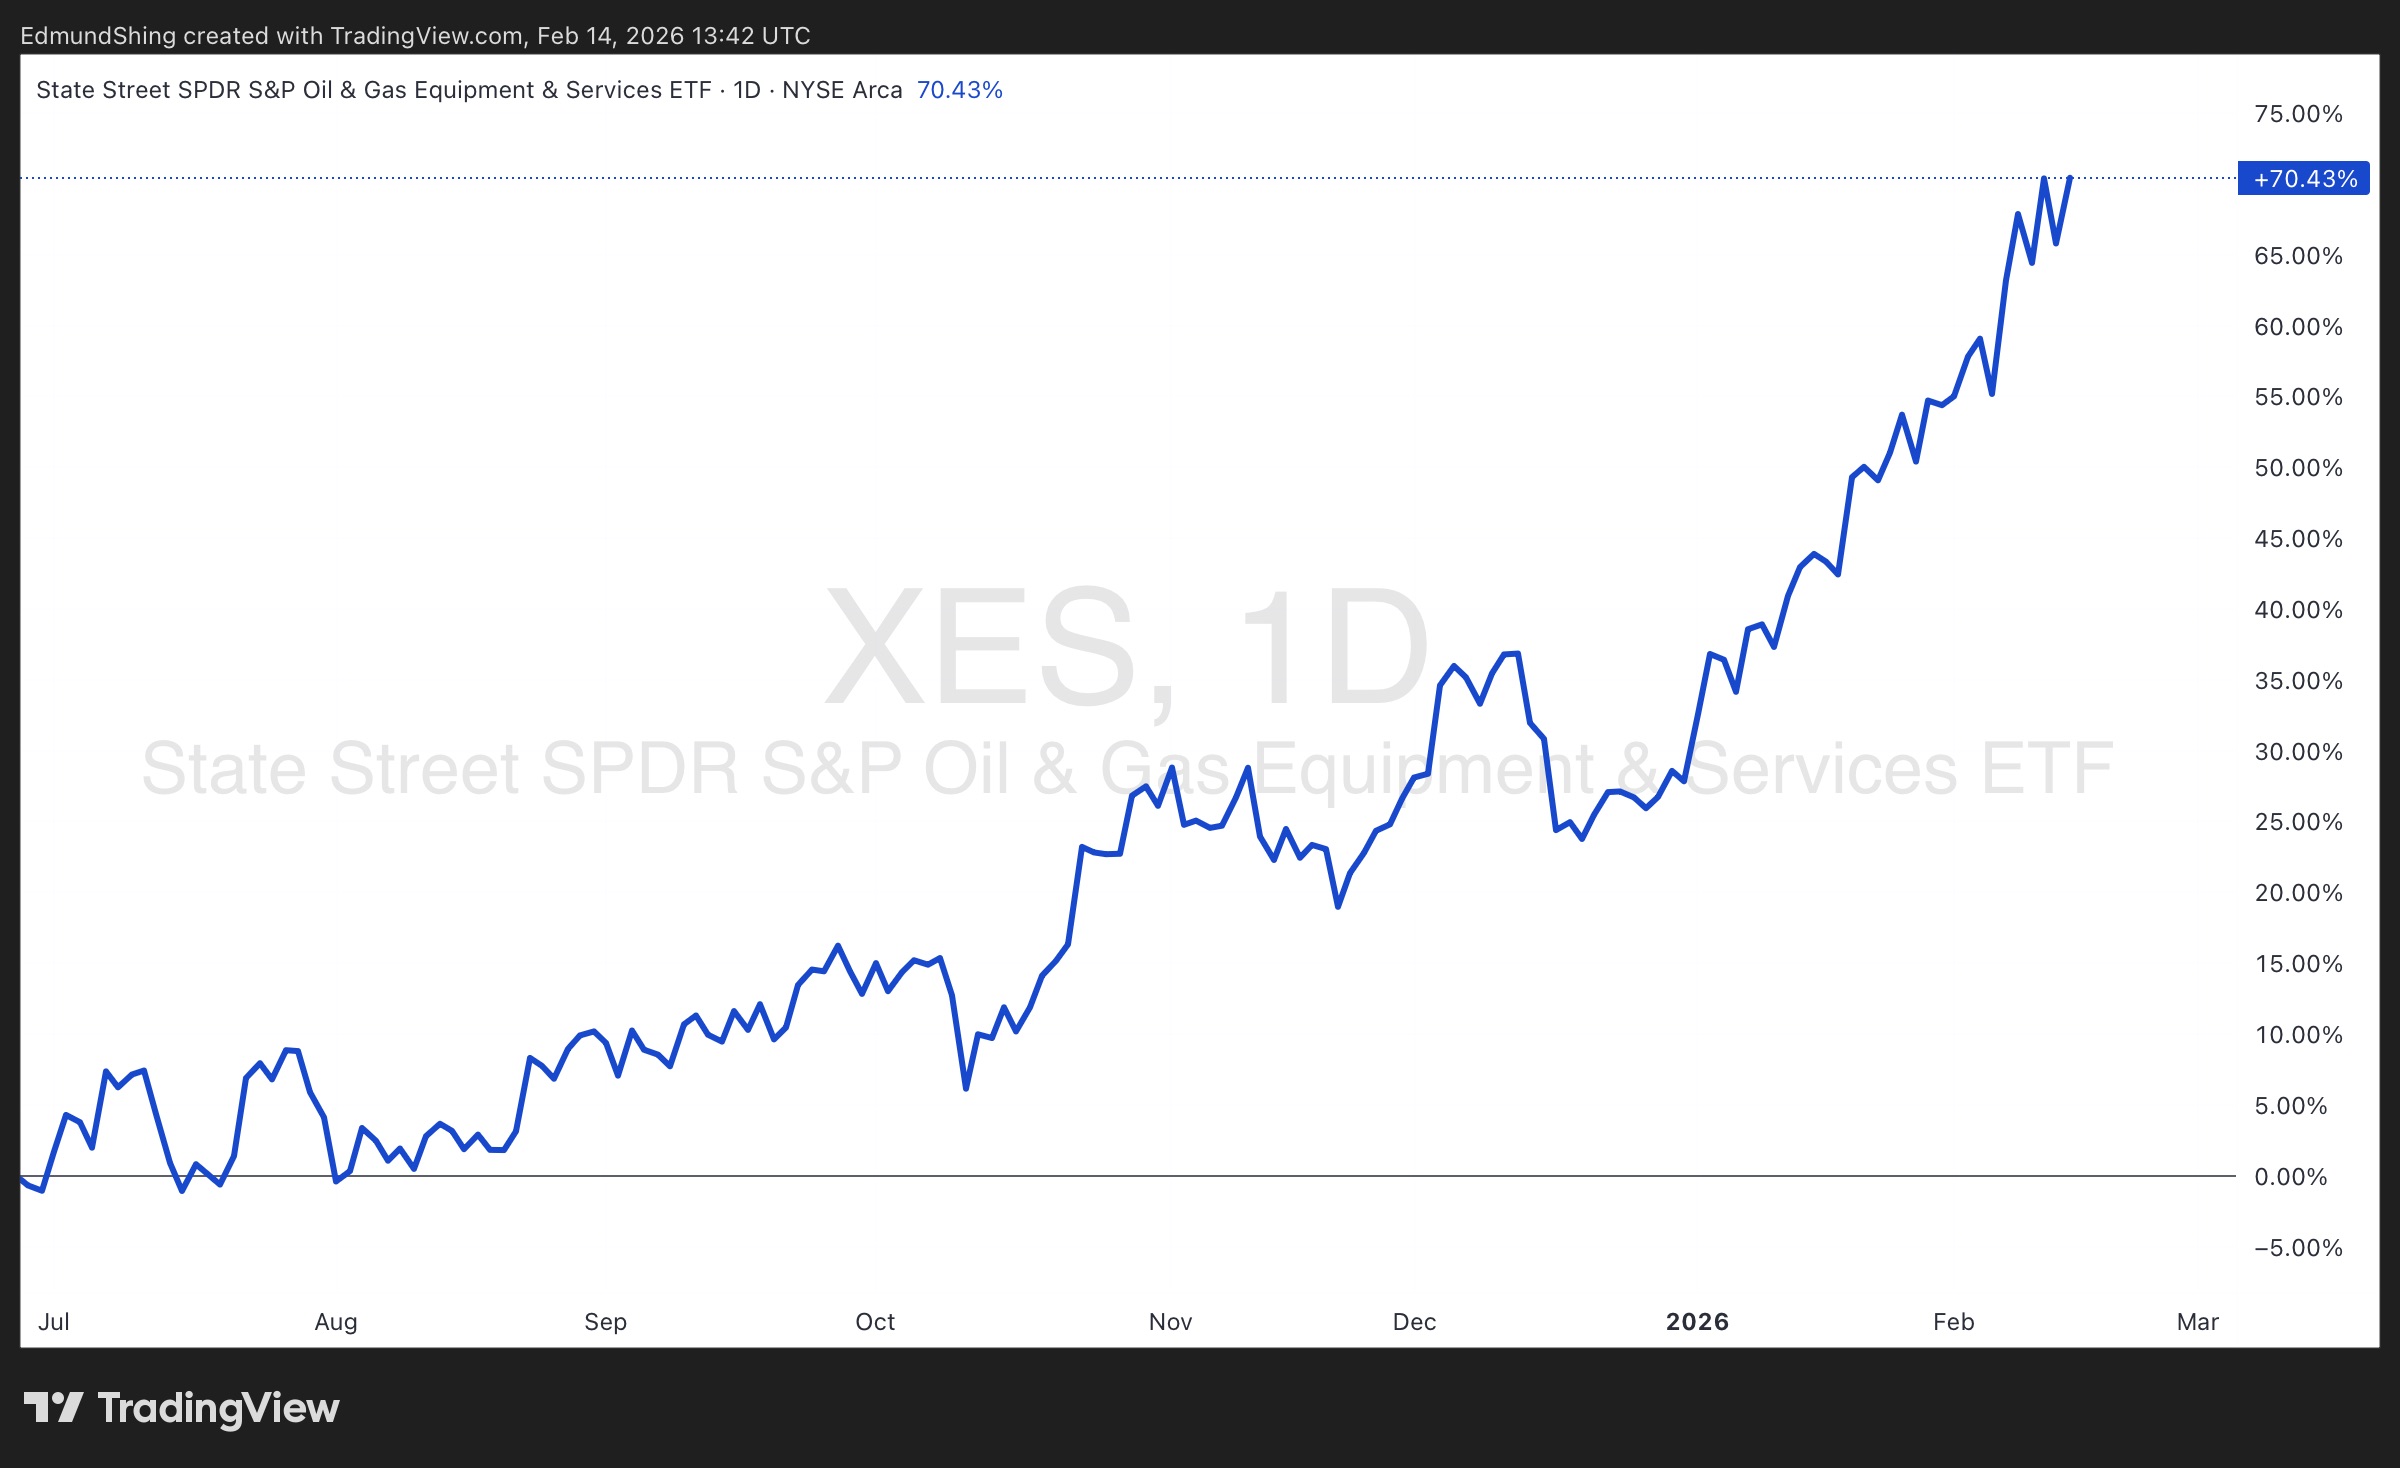
But could go a lot further given the scale of long-term under-performance
Agribusiness and fertilisers are the latest to ride the commodities bull cycle
Global miners, junior gold miners look strong post correction
Disclaimer
This is not financial advice. Our content is intended to be used and must be used for information and education purposes only. Please read our disclaimer and terms and conditions to understand our obligations.
4 comments
I found this sentence by Edmund interesting:
"Note that over time, equal-weight indices typically outperform their cap-weighted cousins by 0.5%-1%,but that this has not been true over the last few years in the case of the US."
Always thougt it to be counter intuitive as you are removing the momentum effects with an equal weight fund in the rebalancing process. I asked Gemeni what they thought and got an interesting response, see below:
Andy
Based on long-term historical data, it is generally true that equal-weight indices have outperformed their market-cap-weighted counterparts, with studies often citing an average outperformance in the range of 0.5% to 1.5% per annum. However, this outperformance is not guaranteed, is often cyclical, and has faced significant challenges in recent years due to the dominance of mega-cap technology stocks.
Historical Performance Context
Long-Term Trend: From 1970 through roughly 2023, the S&P 500 Equal Weight Index showed a consistent tendency to outperform the standard S&P 500. For example, studies have shown an annual outperformance of over 1%.
Recent Underperformance: Since 2023, the market-cap-weighted S&P 500 has outperformed the equal-weight version because the "Magnificent Seven" stocks (which hold a much higher weight in the cap-weighted index) drove a significant portion of market returns.
The 0.5%-1% Range: While many studies cite 1% or more, some data suggests the average annual outperformance (e.g., since 1990) may be closer to 0.6%–1%.
Key Reasons for Outperformance
"Size" Factor Exposure: Equal-weight indices effectively reduce exposure to large-cap stocks and increase exposure to smaller or mid-sized companies within the same index, which historically offer a higher risk premium.
Rebalancing Process: Equal-weight indices are rebalanced quarterly. This forces the strategy to act as a contrarian—selling stocks that have gone up and buying stocks that have gone down—which captures mean reversion.
Lower Concentration Risk: Cap-weighted indices can become heavily concentrated in a few top performers (like the current high concentration in tech), while equal-weight indices spread risk evenly.
Important Considerations and Risks
Higher Volatility: Equal-weight indices are typically more volatile and can experience sharper drawdowns during market corrections because they lack the stability of massive, mega-cap companies.
Higher Fees and Costs: Because equal-weight indices require regular, high-turnover rebalancing, the costs to manage these funds can be higher, and they may have higher transaction costs (slippage) than cap-weighted, passive, buy-and-hold strategies.
Sector Divergence: Equal-weight indices have a higher allocation to cyclical sectors like industrials and materials and lower exposure to technology.
Conclusion: The statement is supported by long-term, decades-long studies but is subject to market cycles. The outperformance tends to occur when "market leadership" broadens out, rather than in concentrated, growth-driven, tech-led markets.
The Value Factor ETFs are doing well to in Europe, Emerging Markets and Worldwide:
See iShares Edge MSCI Europe Val Fctr UCITS ETF EUR A (LON:IEFV) iShares Edge MSCI EM Value Factor UCITS ETF USD A (LON:EMVL) Xtrackers MSCI World Value UCITS ETF 1C (LON:XDEV)
At the weekend, I noticed iShares S&P 500 Energy Sector UCITS ETF USD (Acc) (LON:IESU) broke out recently, one which I've held before
Edmund, I really appreciate your trend analysis on the sectors. Could you suggest some UK stocks which might benefit from the graphhs trending upwards. This morning HTG has been recommended by the IC which may relate to your oil services graph. Best Wishes DS