Market Musings 141126: Improving returns at lower risk with simple timing models

Market Musings 141126:
Improving returns at lower risk with simple timing models
Even for long-term, patient stock market investors, there comes a point when the stock market falls by a certain percentage, let’s say 5% or 10%, where the question of reducing risk or staying fully invested should be asked.
In this latest September-October stock market pullback when the MSCI All Country World Index fell 6% in US dollars and 4% in euros, many invested heavily in stocks would likely have asked themselves this question.
As of the end of last week, the S&P 500 index was just 3% off its early October all-time high. However for many investors it has probably felt much more severe, given that the median US stock is down nearly 12% and 32% of stocks have fallen by 20% or more. The most popular stocks with US retail investors (as defined by companies in the Defiance Retail Kings ETF) have dropped 28% since the end of September.
Volatility is the price of stock investing
Since 1945, the US stock market has experienced a 10%+ decline from peak on average once every 1.1 years, i.e. nearly every year. The average such 10%+ decline is 13%-14%, although more painful bear markets (defined as a 20%+ drop, which take place every 3.5 to 4 years on average) obviously also occur. Volatile years on average see 2 such market corrections of 10% or more. 5%+ declines from peak are of course even more common, occurring on average somewhere between 3 and 4.6x per year. Simply put, this volatility is the price of investing in stocks for the long term.
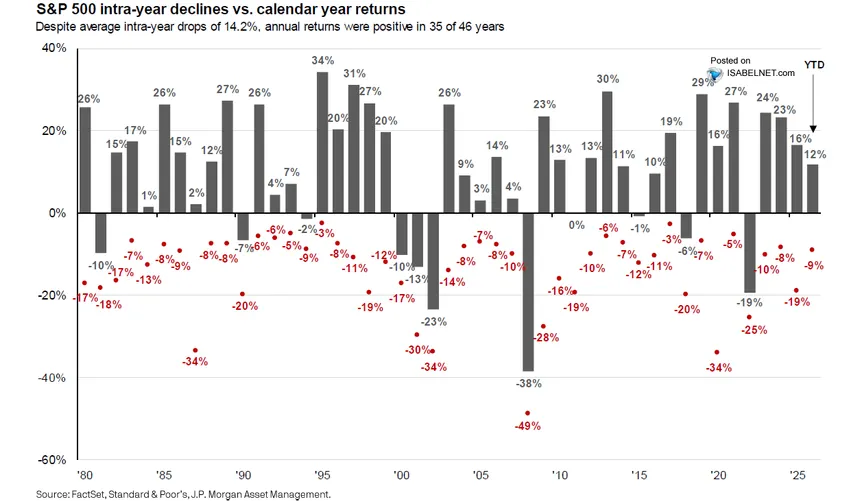
Source: JP Morgan Asset Management
In principle, the default answer when stock markets decline by 10% should be to stay invested, on the basic principle that it is “time in the market” rather than “timing the market” that generates long-term compounding of wealth in stocks. But even long-term investors who accept that volatility is the price of investing in stocks for higher returns, still want to avoid the bulk of bear market drawdowns if at all possible.
While no system is foolproof, there are a number of systematic approaches that can boost overall long-term stock market returns by limiting drawdowns when a substantial stock market decline takes place.
Tactical asset allocation with the 200-day/10-month moving average
Investors want in general to be invested in stocks when they are trending higher. Over the long term, stock markets give positive annual returns more than 75% of the time. What a simple trend-following system tries to do is to capture the bulk of an uptrend, while avoiding much of the damage done to stock portfolios in bear markets when stock markets fall 20% or more.
But to be realistic, no trend-following system can either perfectly capture all of an uptrend or avoid all of a downtrend. If the system manages to capture 75%+ of the uptrend and avoids 75%+ of major downtrends, that already represents a very successful system which will generate substantial outperformance versus buy-and-hold over several years.
A very simple filter for deciding whether a stock market index is trending upwards or not is the 200-day or 10-month moving average. The simplest system would test whether a given stock market is above its own 10-month moving average once per month.
If it is, then you buy stocks for the next month. But if not, you instead buy government bonds. This reflects the simplest form of a risk-on/risk-off system, and is simple as it only requires one decision per month.
This system has been tested by Meb Faber in his paper “A Quantitative Approach to Tactical Asset Allocation’ (click on link to access the PDF of this paper).
Here are his results (the column TIMING) when tested for the S&P 500 index (and US government bonds) over the period 1901-2012:
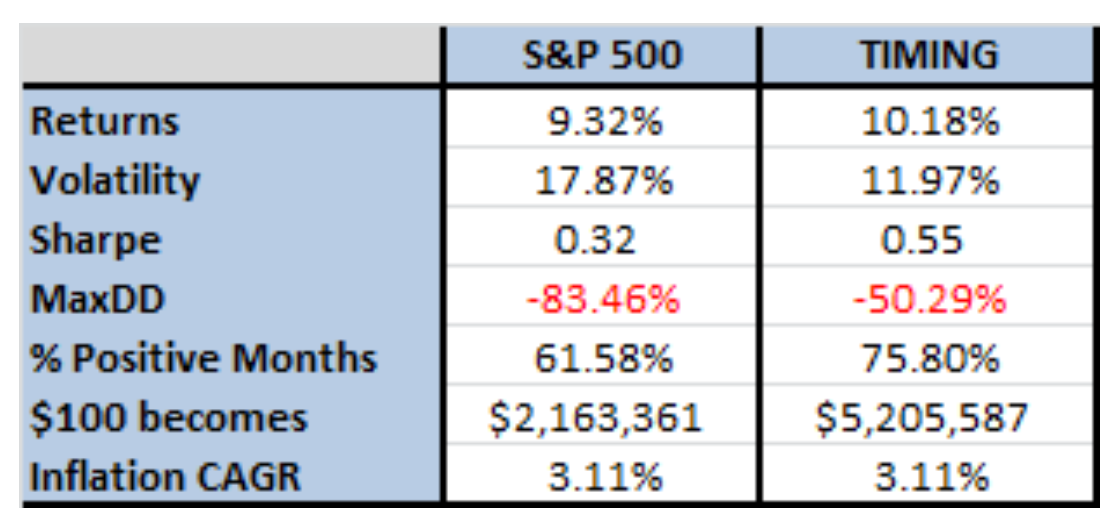
Two things are immediately obvious from this table - this simple 10-month moving average timing system achieved higher annual average returns with lower maximum drawdowns and much lower volatility.
However, there are periods when this system does underperform buy-and-hold by often going defensive too early and for too long. Since 1990, this happened in the exit from the early 1990s recession and also in the final phase of the internet bubble in 1999-2000. But the system largely avoided the big bear markets of 2000-2002 and 2007-2009, allowing the system to outperform over the 22-year period.
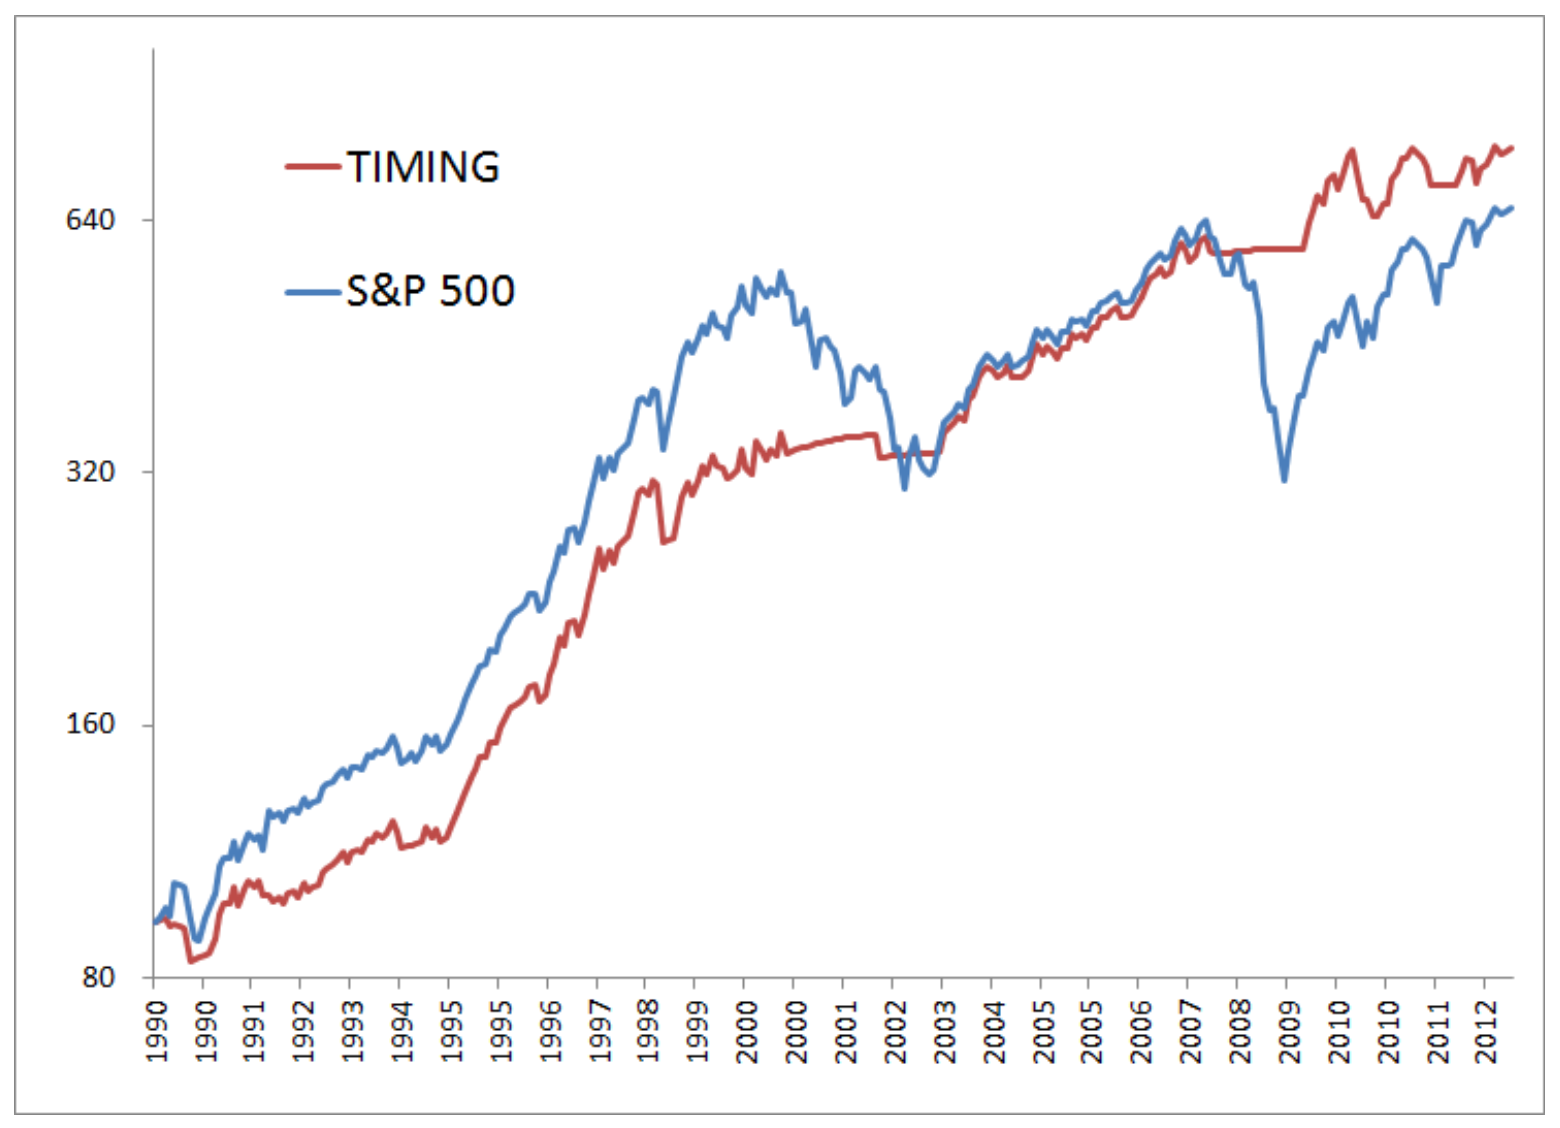
Source: Meb Faber
This is not a system designed to maximise stock market returns, but rather one that aims to increase long-term returns largely by avoiding the worst bear market periods.
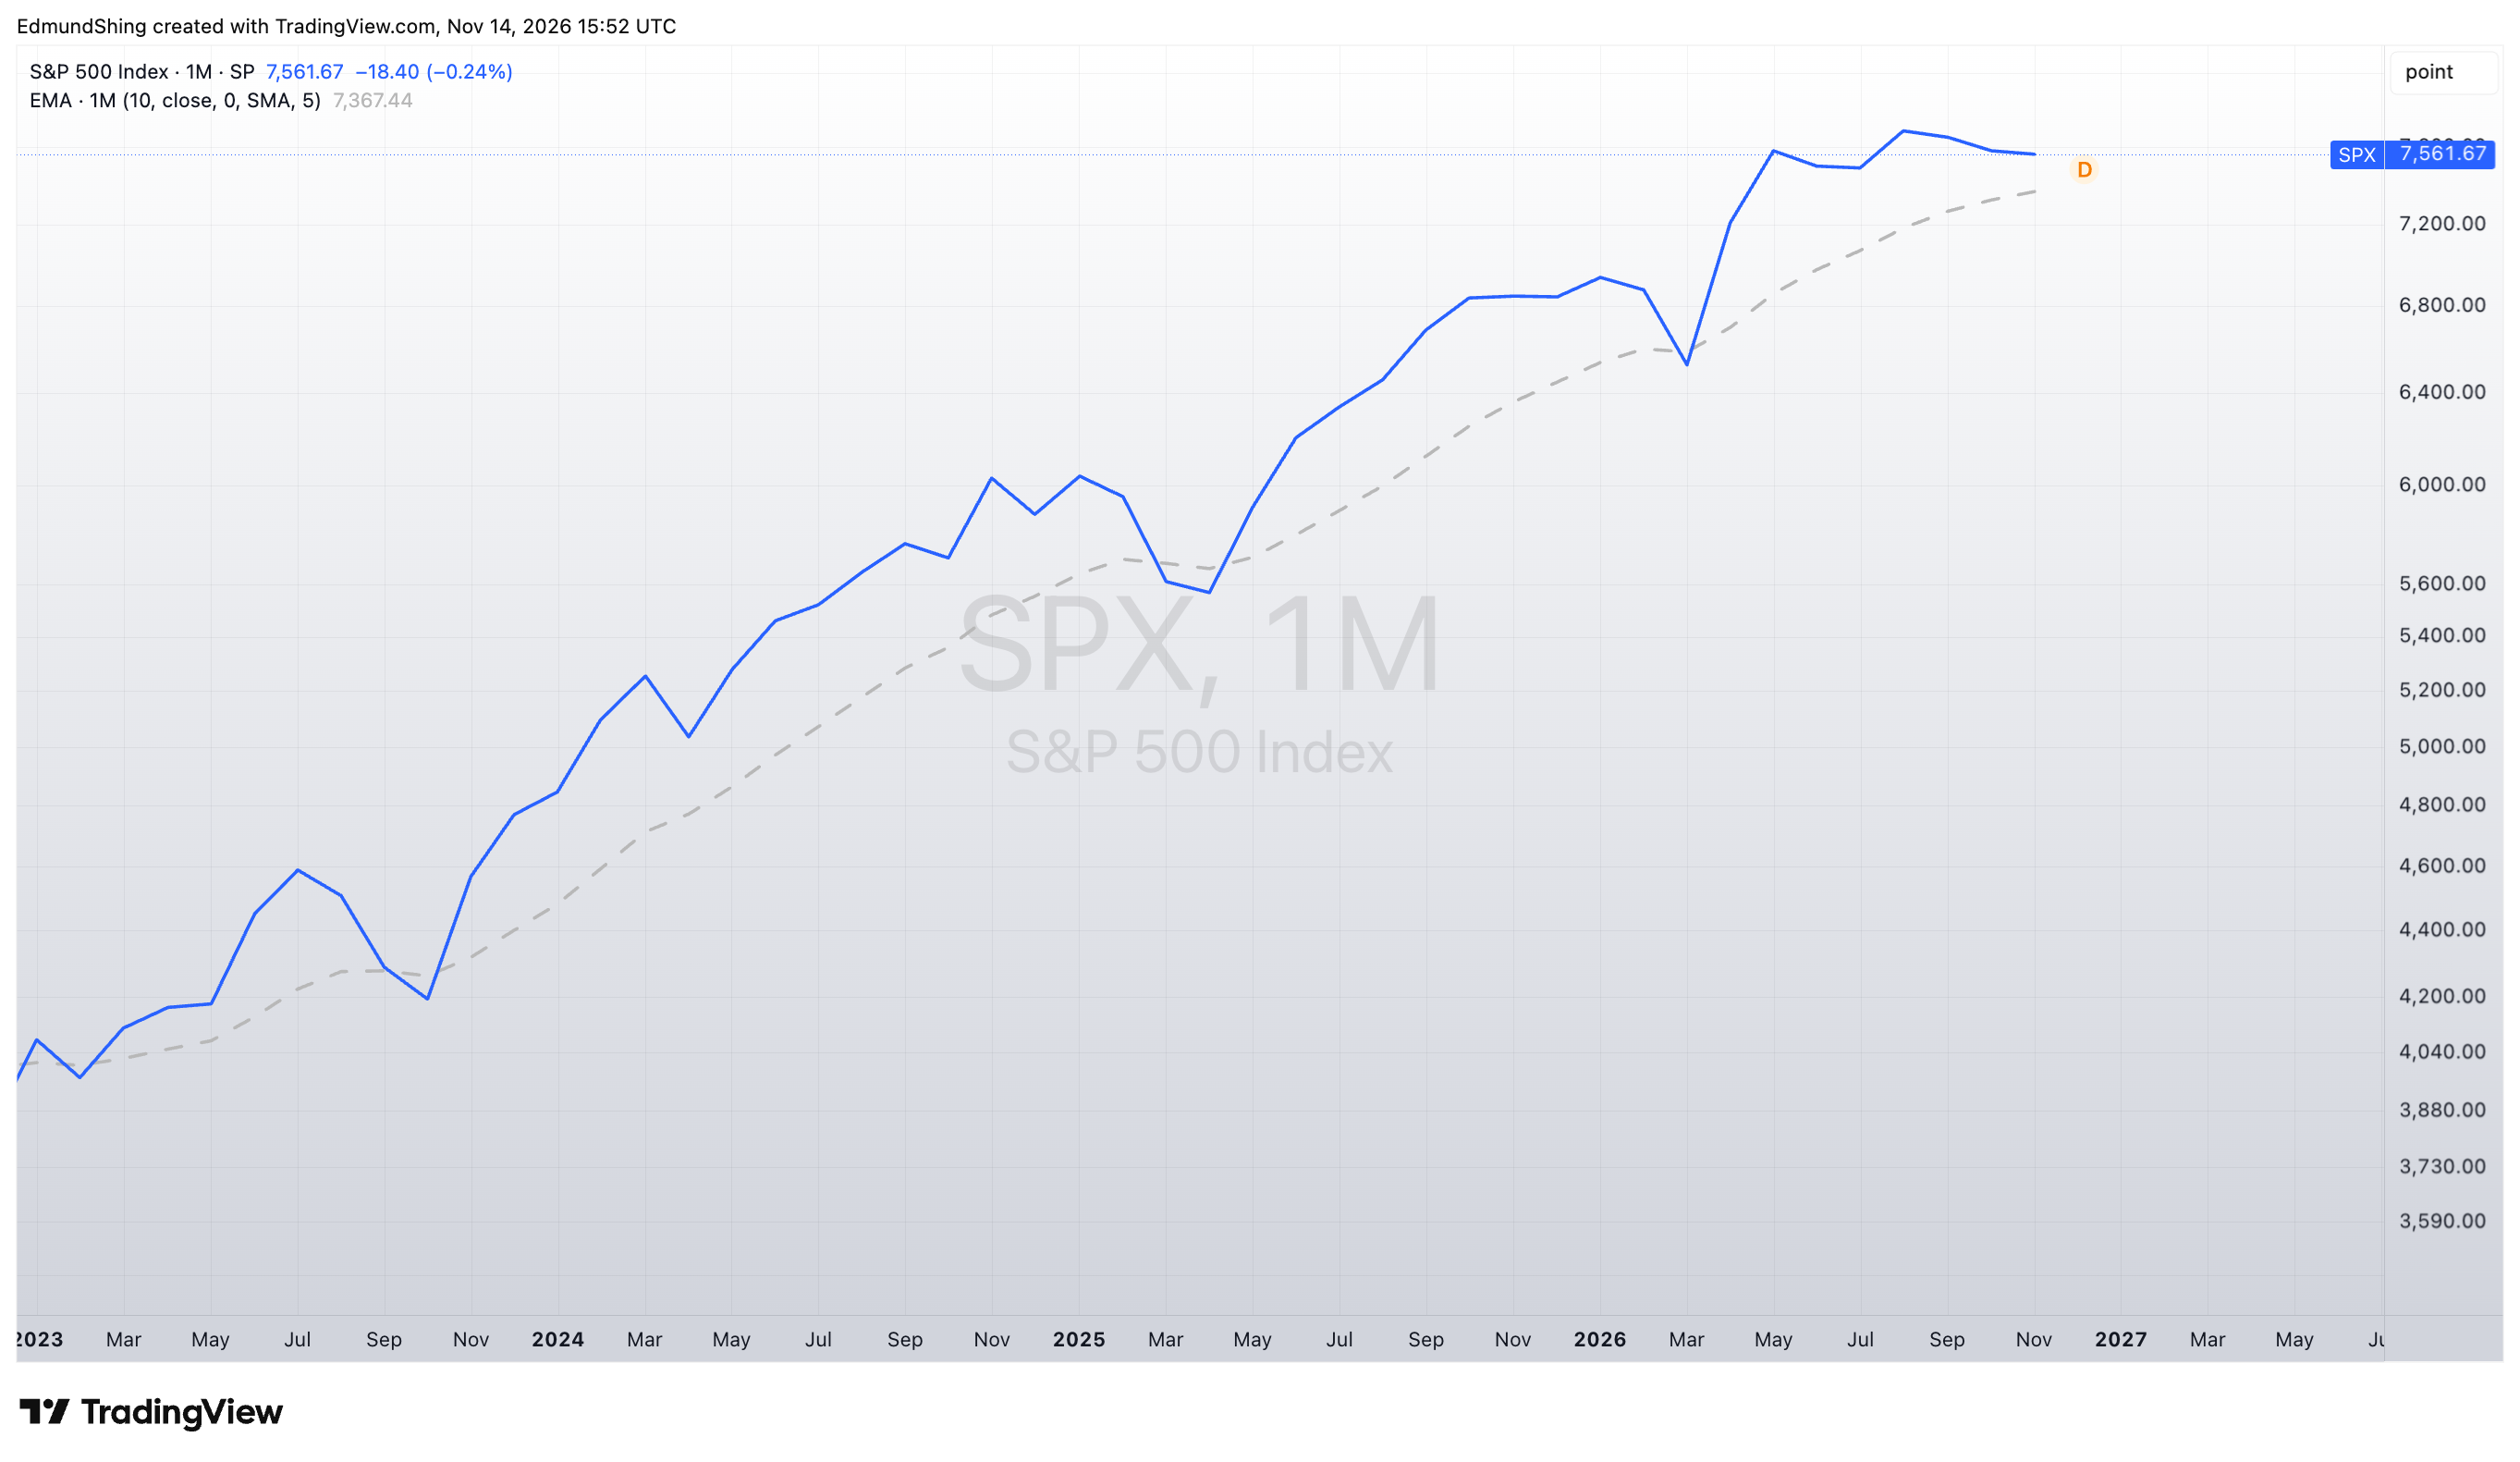
Since 2023, the S&P 500 index has been almost exclusively above its own 10-month moving average (in grey), and the signal from end-October was to hold the S&P 500 over November.
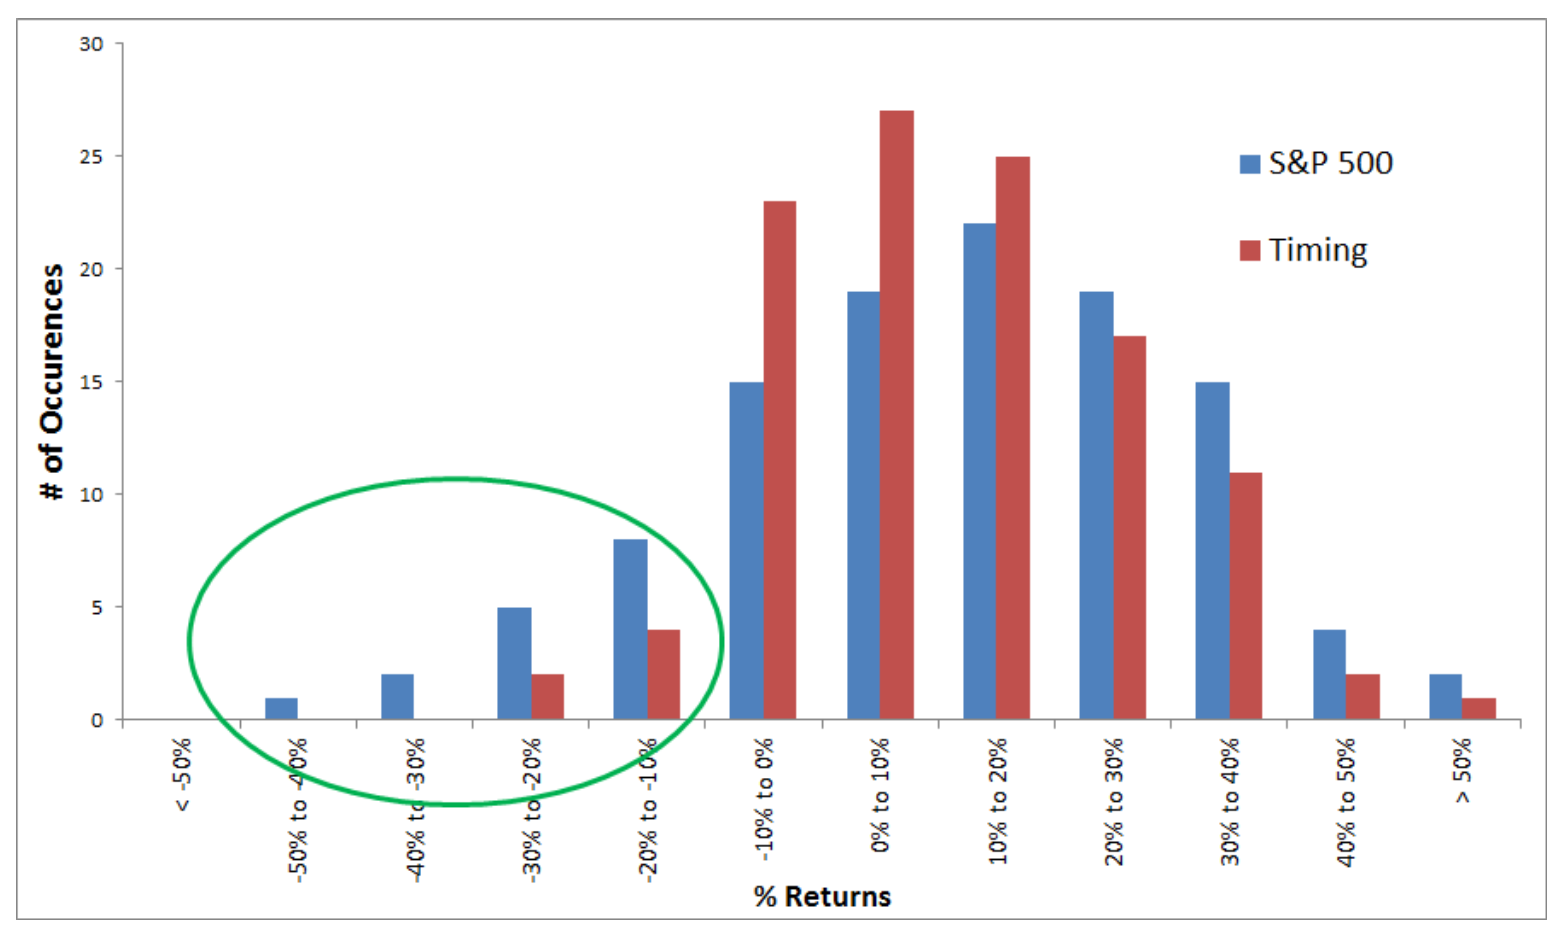
I call this a “sleep well at night” strategy as it largely avoids the worst-performing years for stocks, as you can see from this graph of annual returns comparing the 10-month moving average strategy with buy-and-hold for the S&P 500 index:
The “Buy at/close to 12-month highs” strategy
An alternative to the moving-average strategy is the following:
invest in stocks once a month at the end of each month, only if the stock market in question, let's say here the S&P 500, is within 5% of its 12-month high. So, at the end of every month, you say: what has been the highest level of this S&P 500 index in the last 12 months? In this case, the highest level of the S&P 500 index in the last 12 months has been 7,816 points. At the end of October, the S&P 500 index stood at 7,578 points. So, you only have to ask yourself one question. Is the high less than 5% away from where you are today? The answer is actually yes, you are under 5% below the 12-month high. So, in this case, you would hold the S&P 500 index over November (rather than US government bonds).
Now, if you were to have executed this system between 1972 and 2019, and this is taking the data provided by Mebane Faber of Cambria Investments, who very kindly wrote a paper all about this model. Between 1972 and 2019, a so-called “switch model” that would switch between US stocks and bonds based on being within 5% of the 12-month high each month or not, would have provided a return of 11.7% per year on average over these 48 years, and with much better risk-return characteristics than simply buying and holding the S&P all the time.
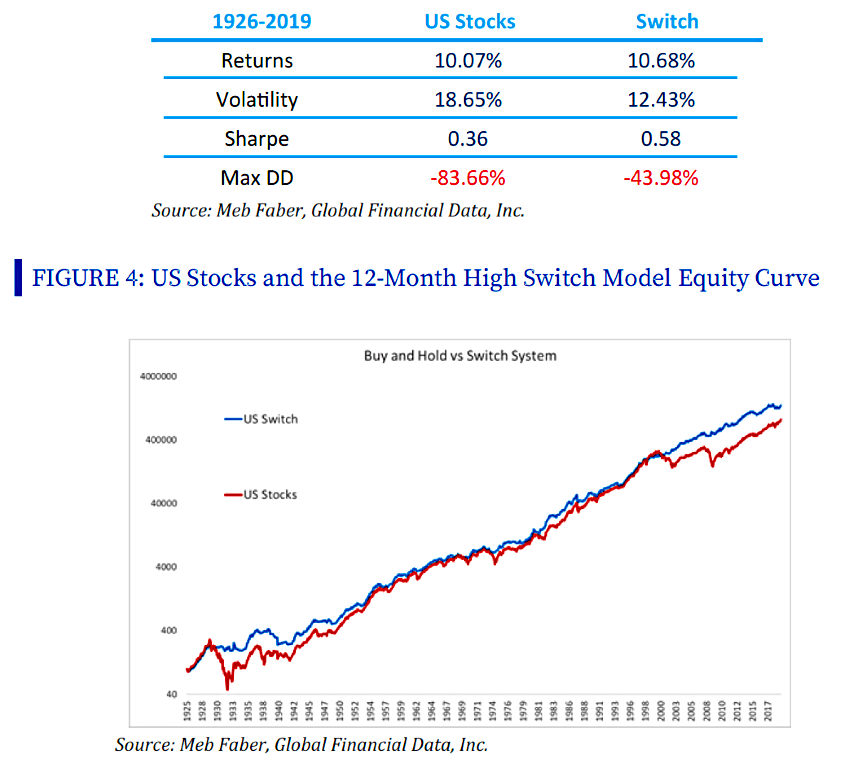
So in the case of buying and holding the S&P all the time, over those 48 years, your maximum drawdown from peak to trough would have been minus 51% as achieved in 2008, whereas with this system, you would only have had a maximum drawdown of minus 23%, so less than half. So what I'm saying is with this system, applied to US stocks once a month at the end of every month, and just asking are you within 5% of the 12-month high on the S&P 500 index. Just using this very simple system to either buy equities for the next one month or buy bond exposure for the next one month, you achieved an average yearly return of 11.7% in US stocks with a much more limited drawdown.
And what's more interesting is you can apply this to a number of other assets as well, not just US stocks. So, in this case, Mebane Faber has also looked at foreign stocks, so that's everything outside of the US, largely Europe, Japan, and emerging markets. And this foreign stock grew as a whole, achieved in dollar terms at least, an average return over these 48 years between 1972 and 2019. They achieved an average total return per year of 13.7% so even better than for US stocks. And this compares to, if you had simply bought and held this foreign stock index, which is MSCI World ex-US, for the period between 1972 and 2019, you would achieve an annual average return of 9.4%. So 13.7% using this 5% away from 12-month average tactic once a month at the end of every month, as opposed to only 9.4% if you had bought and held the stocks all the time. And again, achieved at a much lower level of volatility and drawdown risk using this switch model than buy and hold.
There you have it, strong performance from this system over time with much reduced drawdown and nothing particularly to worry about because it is a simple quantitative system without any subjective judgment necessary. There you go, the Mebane Faber switch model, which I think provides very interesting returns, something for you to consider when thinking about what to do in this very volatile environment.
Best for the week ahead
Edmund
Disclaimer
This is not financial advice. Our content is intended to be used and must be used for information and education purposes only. Please read our disclaimer and terms and conditions to understand our obligations.
No comments yet
No one has commented here yet! Why not be the first one?