Momentum Monday 03 June 2024

Welcome to Momentum Monday.
This week we learned that Inflation is sticker than first. Also while markets took a breather this week, for the month they were still solid. The maxim “sell in May and go away” was once again proven wrong… I even read somewhere a new saying, “April showers bring May flowers.” Which is true in the US as they experienced a tougher month last month. We think these sayings are nice rhyming piece, but not an investment strategy.
And I just want to thank members for our growth to date. We are still nowhere near our objectives but it heartens me that there are still DIY investors out there AND they value their time correctly. Without Stockopedia you are burning the most precious resource we have (note: its not $$$)
Also ‘Thank you’ for completing the recent survey we emailed you on possible future offerings. If you haven't completed it to date, then please check your email. We will be closing submissions shortly.
Interesting links
We look at Airline AQZ Alliance Worldwide Services this week on Weekend Watchlist run in conjunction with Shares for Beginners. A stock we shared with members in print last week. Listen here to the replay
We just released our most recent emails to members recapping the fortnight it was. Be sure to check your inbox for your email. We sent in on Friday.
Our “Empower Others” referral program will be undertaking a change. For now we maintain the current system, be sure to Learn more here if you are interested in current plan
For any external commentary we make to the broader market, follow us on Social Media Facebook Linkedin Instagram or X (formerly Twitter)
This week’s content is as follows:
Broader market sentiment
Member corner
Stocks in the “Shine Zone” (including changes)
Buses pulling out of the station (volume + price movers)
52 week high screen (including changes)
A reminder that you don’t have to read all this contribution. Simply scroll to the area of interest.
Broader Market Sentiment
We look at the direction of both the US and ASX markets to gain an understanding of the broader sentiment at the minute. It is important to stress here that I DO NOT use this to time my entry or exit out of stocks. I prefer to use the individual charts of stocks to do that. However I find it useful in helping us determine how aggressive/cautious traders should be in their trading. In short the more positive the broader market is the more risks you can take and vice versa.
US / S&P500
We finished the last trading day of the month of May with the largest jump in the Dow this year, though the NASSAQ lagged mega tech stocks like NVIDIA took a breather. Nonetheless, this transferred to a solid close on S&P500 on Friday

S&P500 Weekly chart
Though for the week, it was down 0.51% in fact. However that was not enough to turn May negative. In fact it was the sixf positive month in seven, so once again, it is hard to change the aggressive stance I have in the market at the moment.
I read that the number of buybacks over the quarter remained very strong, but obviously not enough to stand against sentiment this week. However when we witnessed NVIDIA's mighty result we learnt that there is a lot of money sloshing about out there.
For now my level of 4734 remains the same as I won’t look at the market or my strategy until then really. I have left on the chart why I feel that level will be significant. Fingers crossed this doesn’t end up being a double top, but we shall see.
AUS S&P/ASX200
It certainly is a funny market at the moment. Let me paint you a picture…. On Friday I noted the US market was down. Big stocks like Salesforce got smacked and Nvidia also fell. I can see that Iron Ore and Copper took a breather and our Bond Rates domestically were up… but our Market was up. It actually finished up quite strongly rising almost 1%

S&P/ASX200 Weekly chart
So if there is anyone out there convinced that Eugene Fama was incorrect when he said that, “The premier anomaly is Momentum”, please raise your hand?
The performance however was not enough to insulate the ASX200 from falling 0.34% over the week, our second consecutive down week in a row though over the month of May we were up.
Despite the second consecutive down week, the index stayed above 7547 so again, my disposition hasn’t changed. Actually we look due for another run (if you can believe that) as the pullback still keeps us above the range and short term awareness level. I am not counting my chickens before they hatch but it looks promising, especially after the close in the US on Friday (Sat morning our time.).
This week was only about what everyone already knew that consumers are still under pressure, and inflation is indeed still sticky with the release of retail and CPI figures respectively. I even nearly fell off my chair when I read that our next interest rate move could be up, rather than down. Oh well, the market kept going up.
Is there much to glean from the lists I produce? Well to me the drop off in Stocks in the Shine Zone indicate that things may be rolling over. But then I see volume is picking up instocks heading in the right direction (Bus Pulling out of the Station) and there are more stocks trading close to their 52 week high. But remember, at the start of every section there is a description of what is trying to be achieved. MAKE SURE YOU READ IT. On the surface though it looks suitably confused so I am not going to read anything into it. I will always prioritise individual stock behaviour ahead of such lists, but we ignore what they are telling us at our own peril.
I won’t add much more as there is little to discuss in my view.
Member corner
In this section we will provide a detailed chart assessment, on a maximum of ten stocks weekly, on companies from those of you in the Gallery.
We welcome stock requests to be analysed from members. We will also be looking at the charts of some of the more actively researched stocks for the week. We will try to rotate through a selection so as to not make the charts stale, however we will likely not cover a stock within 2 months of when it was last discussed.
If you want to see what has been written about a stock recently, go to the discussion area.

We will not be making up suggestions. If there are no changes to the most viewed list and/or there are no suggestions from members, then no stocks will be covered.
To learn of the methods used to analyse companies in this section, refer to my Momentum Journey series that I articulate here in three parts.
They will help provide context on what I am writing about and the editorial angle of this report.
Also look at the market capitalisation and liquidity before making any decisions!
And again, if you have a stock you would like analysed from a momentum perspective, please write it into the comments section below or email us at @stockopedia.com.au">support@stockopedia.com.au
IF NO ONE ASKS… HOW AM I SUPPOSED TO KNOW?!?
ASX: TLX Telix Pharmaceuticals
StockRank 58
Momentum Rank 90
QM Rank 87
VM Rank 45
A$18.15
A member this week asked about Telix Pharmaceuticals (ASX:TLX) and I was interested to see that this is the first time the stock has been looked at from a Momentum perspective, particularly given it has been a great Aussie export story from my biotech hometown in Melbourne..

ASX:TLX 1 year Daily chart
The stock is at all time highs. It’s rising and charts don’t look much better than this. In terms of when I feel the music may potentially stop with this? Before Friday, I don’t see it ending until there is a cross below $10.52. However I have held this stock for a while therefore I do look at it with a different lens than most. For those with a shorter term view or recently acquired the stock, a break below $12.54 would have been a more appropriate as a level to watch.
Now though, a newly acquired investor will look at $14.56 (whereas I will go up to $12.54).
Always remember though, the response to when to take profits is always subjective, especially for stocks trading at all time highs. The answer depends on your overall exposure and faith in the business. Though the answer gets a little easier when there is a 15% spike in a day.
The reasons for the general positive direction has been numerous, and the stock has had a lot of news recently. For those that don’t know, TLX is a biopharmaceutical company focused on the development and commercialisation of both diagnostic and therapeutic radiopharmaceuticals and associated medical devices. Its headline product Illuccix used in prostate cancer imaging. However the company sees itself nowadays as having an integrated Theranostic Approach to Cancer Treatment following recent acquisitions and manufacturing enhancements.
There is no need to bore you with science, however its focus on radiotherapy gives it a number of advantages, particularly at the FDA level and the huge addressable market in the US. Furthermore, I always like it when a stock gets a speeding ticket from the ASX after a positive announcement. That announcement was from the CUPID interim study results which were quite good and obviously a positive as the company says in its own words, “TLX592 is an antibody-based targeted alpha-therapy for prostate cancer and is a key part of the Company’s prostate cancer pipeline.”
By the way, that speeding ticket had nothing to do with the pop on Friday where the stock jumped 15% positive data it received from the ProstACT SELECT trial of TLX591 as a treatment for prostrate cancer.
It seriously won’t take long to read the list or recent positive announcements, and unlike the litany of emerging stories in this space, TLX has a service now that it can sell to a very large addressable market, hence its price has done well. It also helps that the company is now expected to be profitable moving forward. This is a massive milestone for any biotech business and allows it to come at emerging competitors and new technology with power.
Finally, its stock will be available on the Nasdaq Global Market as ADSs (American Depository Shares) putting the business in front or more eyeballs. If they continue with the string of positive announcements this will likely continue to be a positive for the price.
ASX: MAH - Macmahon Holdings
StockRank 99
Momentum Rank 99
QM Rank 99
VM Rank 99
A$0.28
I actually first noticed Macmahon Holdings (ASX:MAH) on the Sunday prior, though it missed the deadline it had to be excluded. Though during the week it maintained investor interest, hence we will discuss it from a Momentum perspective also for the first time.

ASX:MAH 1 year Daily chart
Much like the stock discussed prior, the stock has been on a tear in recent times, rebounding from the low from mid-year to now find itself creating a series of high highs and higher lows to be in a clear uptrend with the price at 52 week highs.
However I have looked at MAH before in a past life and it has seemingly been a consistent Value play for some time. In fact if one takes a five year view the price is actually not too different than where it was back then.

ASX:MAH 5 year Weekly chart
But the chart is looking promising and I feel a close above 28.5 cents would break through that strong resistance the stock has for itself.
However, what could also happen is that a “cup and handle pattern” is starting to form. In that scenario we have had the basing period (the cup), now we could see a pullback which is not as low as the previous lower low, and then a run back up again (the handle).
Personally, I am very sceptical of engineering businesses given their perineal discount, thin margins and their likelihood of having financial trouble. But in the case of MAH the chart is starting to look promising. I am more inclined however to wait for a pullback to then commit to the stock.
It is obviously a different beast today than when I looked at it all those years ago. In fact the acquisition of also perennial value play in Decmil, saw investors originally raise their eyebrows on the premium paid, but now they may see there is logic in the madness?
Either way, investors can wait for MAH’s next full year result to see if the increase over the past year has been justified. But its not too often you come across a stock with Green Traffic lights up and down the Momentum column. “Think less and make more money.” This has definitely been true for the past 12 months with MAH.
ASX: XRO - Xero
StockRank 76
Momentum Rank 99
QM Rank 99
VM Rank 57
A$135.00
Sneaking into this list on Saturday was Xero (ASX:XRO) a stock we haven't discussed from a Momentum perspective since November last year.

ASX:XRO 1 year Daily chart
In that I said, “Just be wary in this market buying the dips can be a challenging strategy to execute as you are not supported by the market's levity.” Obviously the market is now positively floating and this strategy has been of benefit to traders in XRO. Further I also said the price needs to hold $97.11. in fact sown at those levels it may be in a better buying zone. The price got down to $98.49 and then bounced quite hard
So what to do now that the price has run hard? Well if you hadn't ridden the rise since it was flagged then you need to see a cross into all time high territory of $138.01 to convince you this trend may continue. A structural stop loss from here for those who have been in is may look to that recent higher low on $111.63.
As an upside target though, we are rapidly approaching levels last seen in 2021 and 2022 therefore there may be volatility around that point. I think what it does around these key levels will be important when it comes to analysing XRO’s price history.

ASX:XRO 5 year Weekly chart
ASX: IPG - IPD
StockRank 65
Momentum Rank 58
QM Rank 81
VM Rank 43
A$4.46
We last discussed IPD (ASX:IPG) from a Momentum perspective back in November last year. At the time we noted that the price had rolled over and that it needed to hold current levels and break above $3.93 hopefully with a period of consolidation.

ASX:IPG 1 year Daily chart
Well it broke above $3.93 but there was no consolidation. The price eventually got to above $5.30 and now is tracking back down.
Irrespective of the recent profit upgrade, this is a messy chart that is very difficult to read,other than to say after breaching the low from March 2024,this stock is technically in a short term down trend.
Hope springs eternal however, and the long term expectations on EVs remain solid and therefore one would assume this extends to those installing charges for them. AS a result I am pretty clear there are two ways to look at this thing:
1.Ignore the price noise and take a +5 year view on a business with strong links to quality technology..
2. Follow the charts to make your moves, though don’t delay as big swings can be quite common and the underlying fundamental support for the business remains solid.
So for those that are following option 2, as I say the stock is in a short term downtrend at the minute. I would be watching $3.67 like a hawk and I would be patient to wait for a further fall back in price to get closer to that level. This sentiment would change if price broke $4.81
ASX: RIO - Rio Tinto
StockRank 92
Momentum Rank 87
QM Rank 89
VM Rank 91
A$128.96
It came as a shock to me that I am yet to discuss Rio Tinto (ASX:RIO) from a Momentum perspective. Though many have it, it has never been asked for by members and the stock has only recently appeared in the most viewed list.

ASX:RIO 1 year Daily chart
As a large cap Iron Ore play in many eyes I can understand why. As a price taker it has received no favours there. However I suggest the interest in the stock is coming from its copper exposure backed by the massive Escondida project in Chile.
The price of the stock has done quite well and it appears to be on a bit of a precipice. Investors will note the price is currently butting heads against resistance (The line on top). These are also all time high levels for the venerable company, so they are ignored at one’s own peril. But the second line below, it tells a more interesting tale in my view. That line is drawn from the July 2021 high and looking at a 5 year chart we can see that level was clear resistance which was broken toward the end of last year. The recent price pullback has seen us dip back below that level.

ASX:RIO 5 year Weekly chart
That said, from the low of October 2023 there have been a series of higher highs and higher lows to get up to this point and assuming the price stays above $115,35 it remains in that short term uptrend. If however $115.35 fails there is a risk that a double top has formed and the downside target becomes $93. 87. Fingers crossed this doesn’t happen. Even if you hold nothing but ETFs you need RIO to do well given it is one of the largest stock on the exchange. The good news is a break above $136.57 and the short term up trend continues.
ASX: SGLLV - Ricegrowers
StockRank 99
Momentum Rank 91
QM Rank 97
VM Rank 99
A$7.18
It has been two months since we looked at this inclusion into the NAPS 2024 portfolio from a Momentum perspective. You can read that commentary here on Ricegrowers (ASX:SGLLV) .

ASX:SGLLV 1 year Daily chart
In it I described the sideways channel the stock had been in for some time and that a sustained break above $7.27 was needed form to become committed to the stock.
Well the announcement on the 27th May of the New South Wales government easing export condition certainly did make the stock pop on the day, though it was hardly committed as the next day it fell back into the range and has stayed within it ever since. Not clutching at straws, I did mention that the stock is closer to the upper end of the channel than the bottom. And obviously we can’t ignore the break. Though time will tell whether we see this run is sustainable or whether it is another false break as we saw in the middle of 2022
Stocks in the Shine Zone
To learn about the Shine Zone and how to use it, you can read it here.
The rules for inclusion in this list are based on those I like to see in a stock before considering a trade in it:
QM Rank above 80
Price is above the 2.5x ATR
50d MA is above the 200d MA
Price is greater than the 200d MA
Market cap greater than $200M
This is a very important point: the “Shine Zone” are rules for possible buying. They are not for holding and/or selling. If a stock falls out of the shine zone, use support levels to set your stops, or instigate a parachute stop if necessary. With markets moving sideways, one expects frequent changes in these lists.
If you feel there is a stock that should be included but is missing please let us know. This is a manual process and occasionally one gets through the cracks
Also look at the market capitalisation and liquidity before making any decisions!
Data is at 01 June and is sorted by the stock code.
Changes from last week
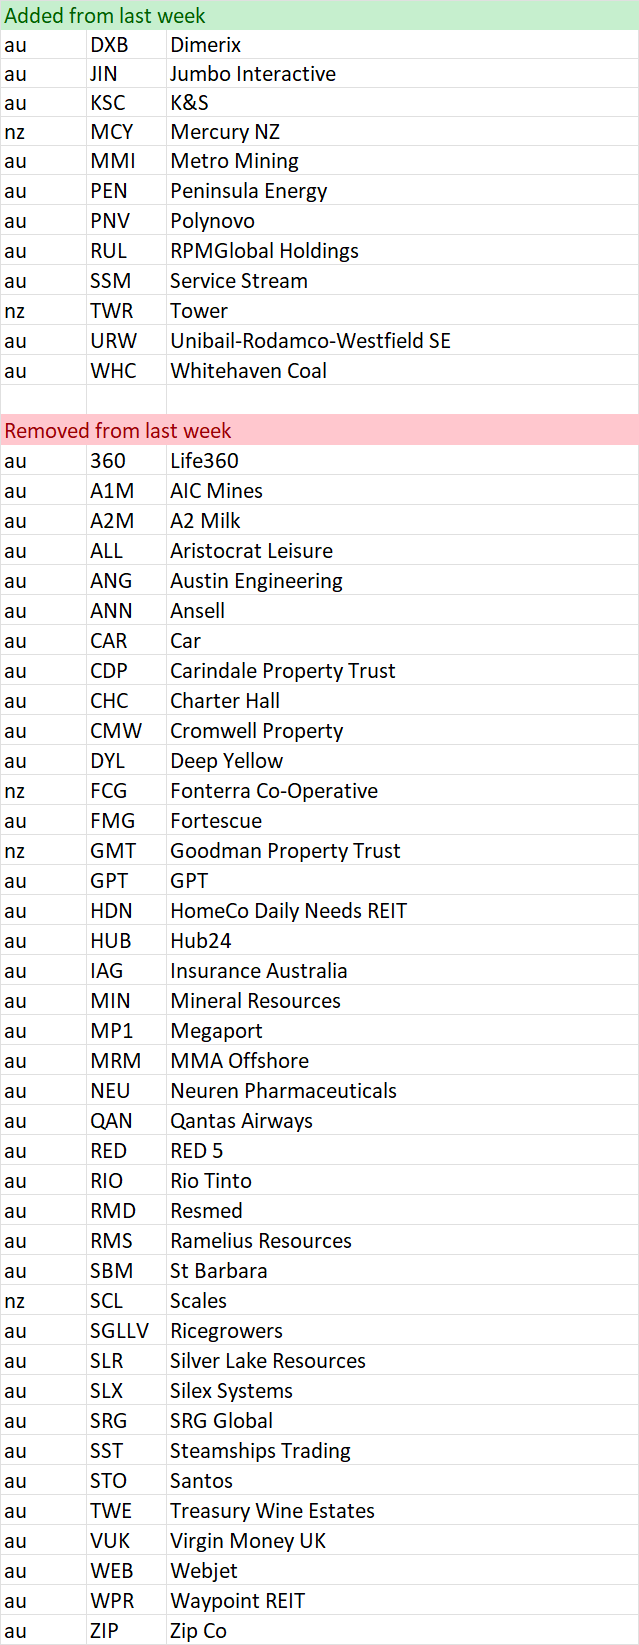
Shine Zone list as at 01 June

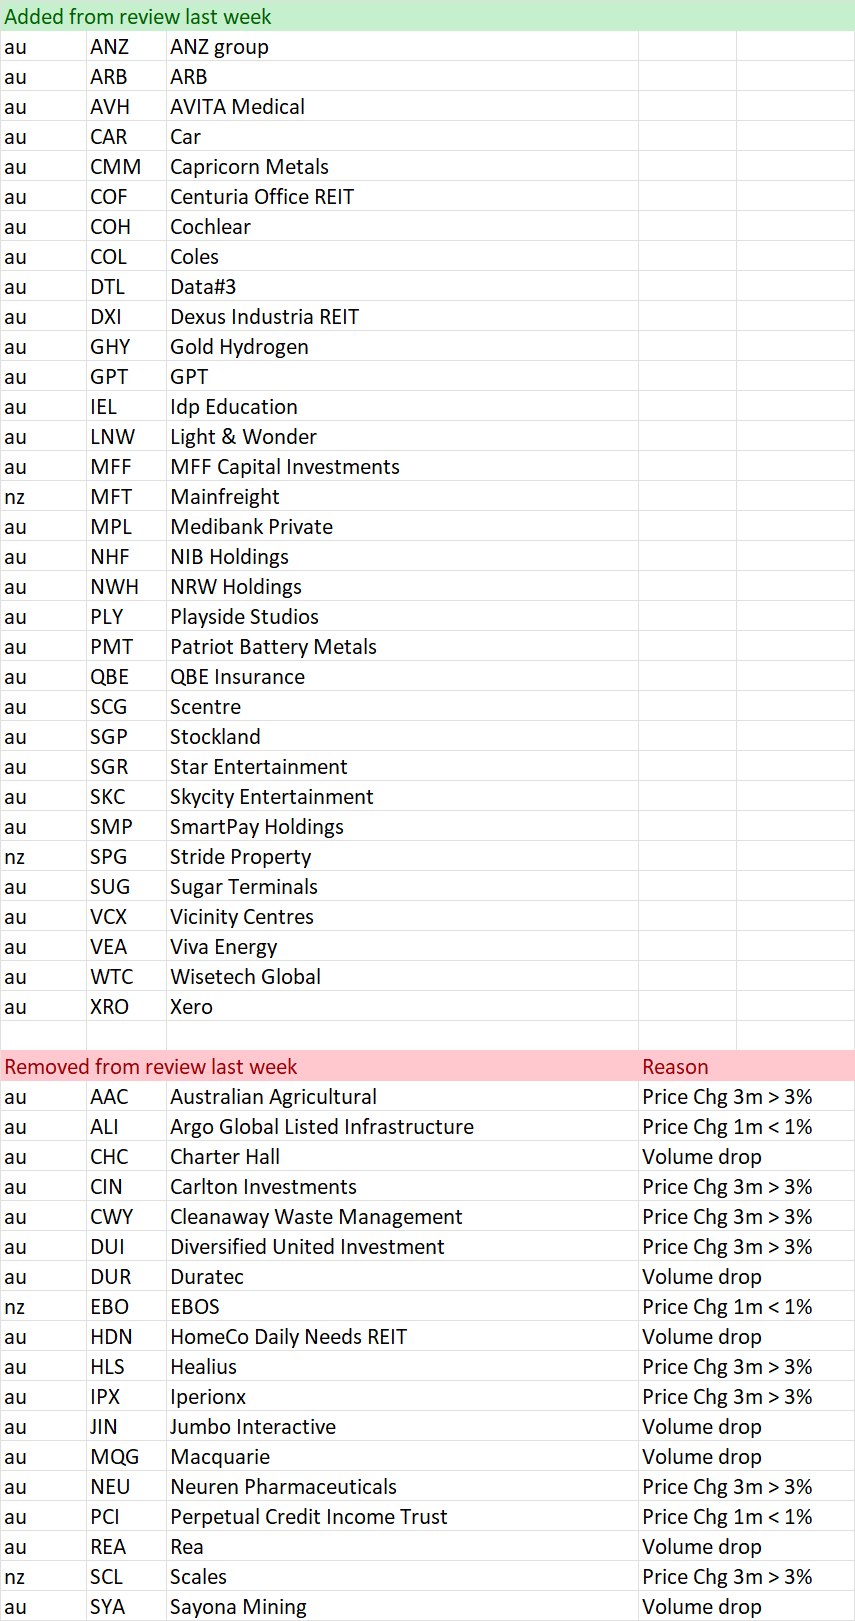
“Bus pulling out of the station”
To learn more about this screen read the following article on the objective of the screen
Here is a shortcut in understanding the reasons why a stock is removed:
Volume drop = Bus might be moving, but no one is on it
Price 1 mth < 0% = Bus has been cancelled
Price 3mths >= 3% = Bus has pulled out of the station
Also look at the market capitalisation and liquidity before making any decisions!
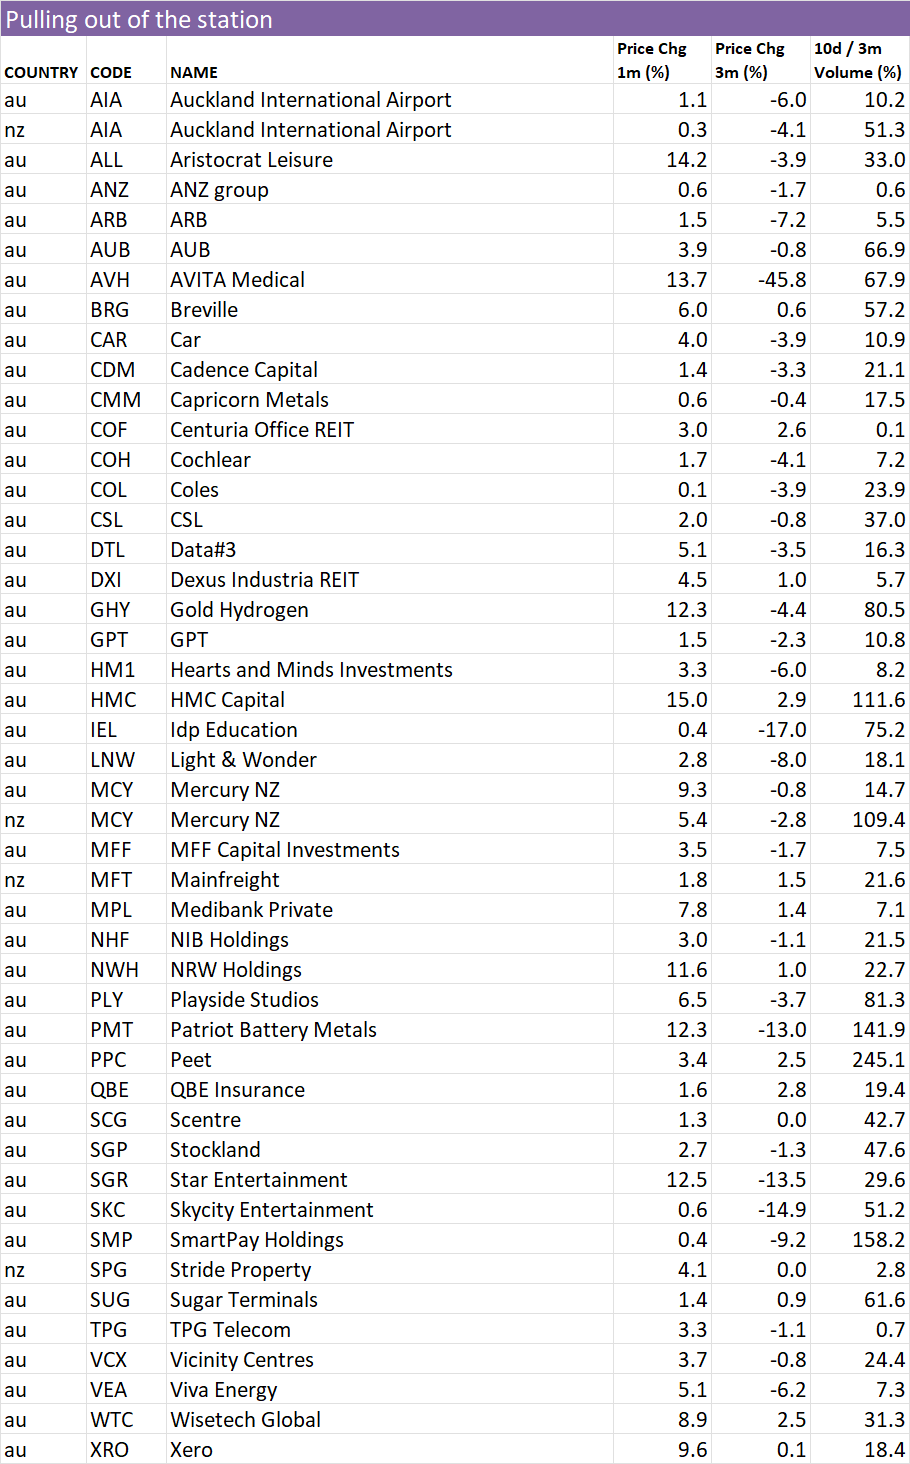
Data is at June 01 and is sorted by the stock code.
Changes from last week
“Pulling out of the station” on 01 June
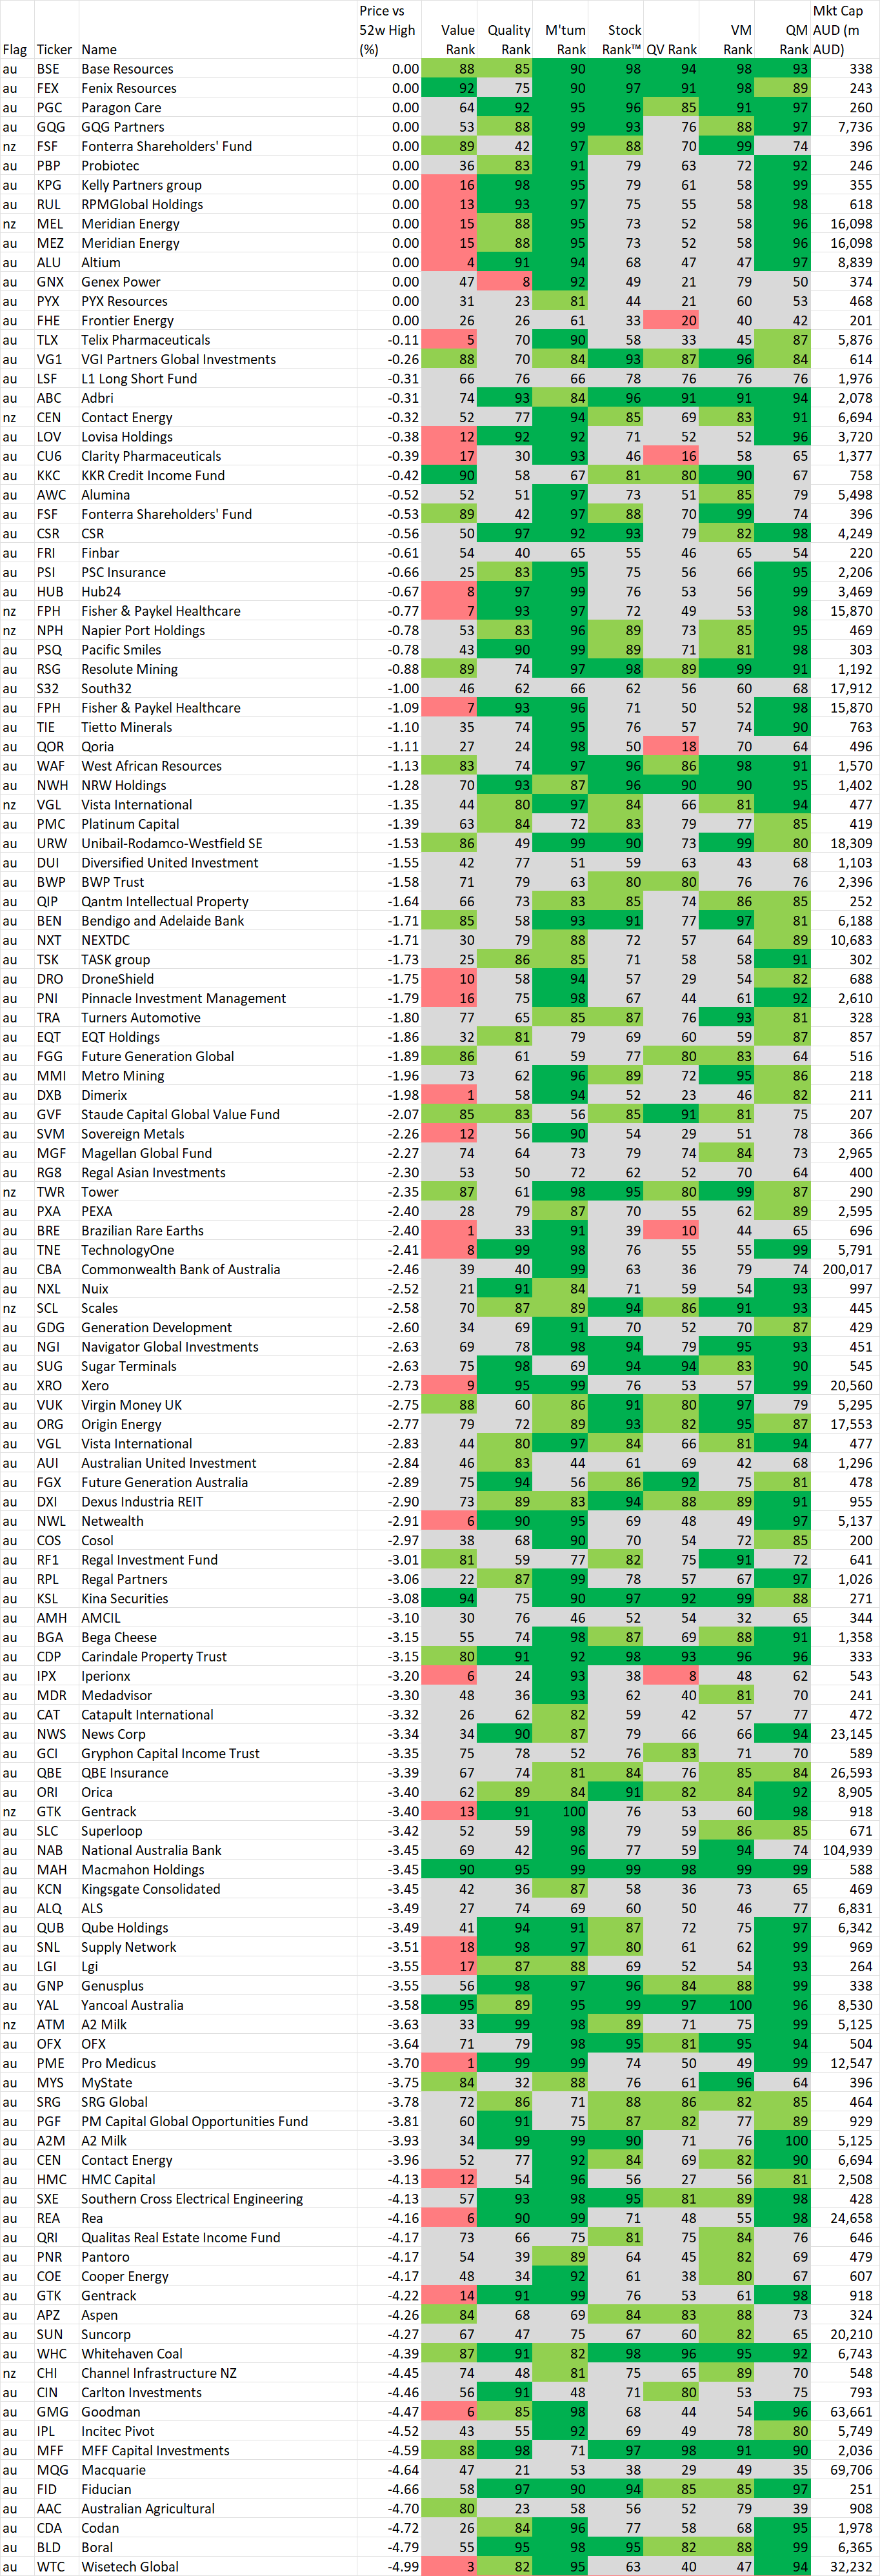
52 week high screen
In this section we identify stocks within 5% of their 52 week intraday high based on the idea, supported by academic studies, that stocks close to their 52 week highs tend to outperform. Weekly changes to the list will also be noted.
If you wish to recreate this screen in the screener select "Price vs 52 high" greater than -5% and Mkt Cap greater than $200M
A stock coming onto the list is NOT an automatic buy, just as a stock that leaves the list is NOT an automatic sell. As with the shine list, assess every chart on its merits. However movements on this list may alert you to interesting charts so be sure to look at Stockopedia and the chart first.
Data is at 01 Jun and is sorted by the stocks closest to their 52 week intraday high.
Also look at the market capitalisation and liquidity before making any decisions!
And remember, past performance is no guarantee of future performance.
Changes from last week
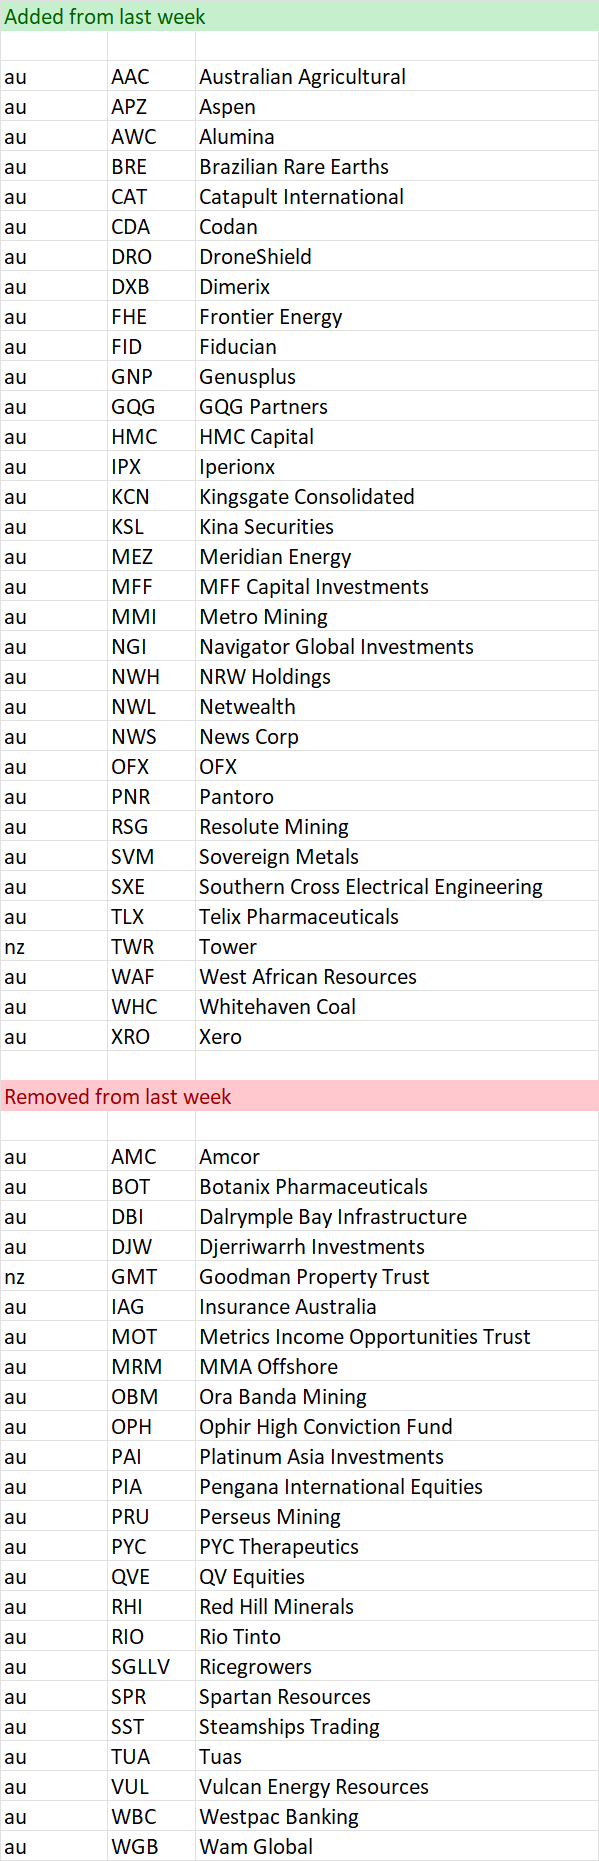
Stocks within 5% of their 52 week high as at 01 Jun
Important Information: Stockopedia Ltd ABN 39 757 874 670 UK business registration number 0637267 (“Stockopedia”) is an Authorised Representative of Daylight Financial Group Pty Ltd ABN 77 633 984 773 (“DFGPL”) which is the holder of an Australian Financial Services Licence (AFS Licence No. 521404).
Information in this commentary is current as at date prepared unless otherwise stated. However, please bear in mind that investments can go up or down in value, and that past performance is not a reliable indicator of future performance. For more Important Information please refer to the Disclaimer section of this website.
This communication may contain general financial product advice. It has been prepared without taking into account your personal circumstances, and you should therefore consider its appropriateness in light of your objectives, financial circumstances and needs before acting on it.
If our advice relates to the acquisition or possible acquisition of a particular financial product, you should obtain a copy of and consider the Product Disclosure Statement (PDS) before making any decision.
The author holds interests in TLX and in companies listed in the data tables . This position can and will change at any time without notice.
Disclaimer
This is not financial advice. Our content is intended to be used and must be used for information and education purposes only. Please read our disclaimer and terms and conditions to understand our obligations.
3 comments
Thanks for this article Elio :-)
Regarding Macmahon Holdings (ASX:MAH) … yes, the last time MAH was at the current price of 0.28 was towards the end of 2020 … I bought it as a value stock towards the end of 2021 … have held it since … only recent have I been in profit :-(
The accounting numbers/ranks seems better today though for MAH compared to 2020 … so cross fingers MAH will continue going up … will sell MAH once the accounting numbers/ranks start to deteriorate!
But you are in the money! So that is worth a
Sorry don't know why that was cut off. I tried the double hands in air emoji and it didn't work obviously. I also had that the Decmil acquisition really changes things and that I hope Momentum continues.