Momentum Monday 05 December 2022

Welcome to our Momentum Monday newsletter.
Remember: In Stockopedia momentum doesn’t just mean price moves (though it is a big part of it.)
Just to refresh your memory Stockopedia’s Momentum Rank is a ranking system based on a blend of price momentum and earnings momentum in the form of upgrades, positive revisions to earnings and earnings surprises to learn more, read here.
In this report we pay no attention to the factors of Quality and/or Value. However, when combined with either of these two factors, an analysis of the charts can be a powerful strategy, if applied with discipline.
Week ended 2 Dec 2022
Markets have experienced strong rallies across the week on hopes that the pace of inflation, and therefore rate rises, are slowing and that China may be close to solving its Zero COVID policy issues.
I start by looking at weekly market charts (Both the S&P500* and the S&P/ASX200 in order to determine whether we can be aggressive in our stock positioning or whether we should be more cautious. Once established if our market is in an up or downtrend, only then do I start to look at individual charts and act accordingly.
* The reason for looking at the US S&P500 chart is because it plays such a large role in the sentiment of the broader Bourse and therefore it can’t be excluded from broader consideration.
S&P500 (US)
The S&P500 achieved its second consecutive week of positive gains.
This recent run has taken the index to the top of the well-entrenched downward channel. A channel which had been forming since December 21.
In the short term we are at a pivotal juncture in the US market. Either the index will hold and rise above 4280.1 which will be bullish and see the next level likely to be tested around the 4620 mark.
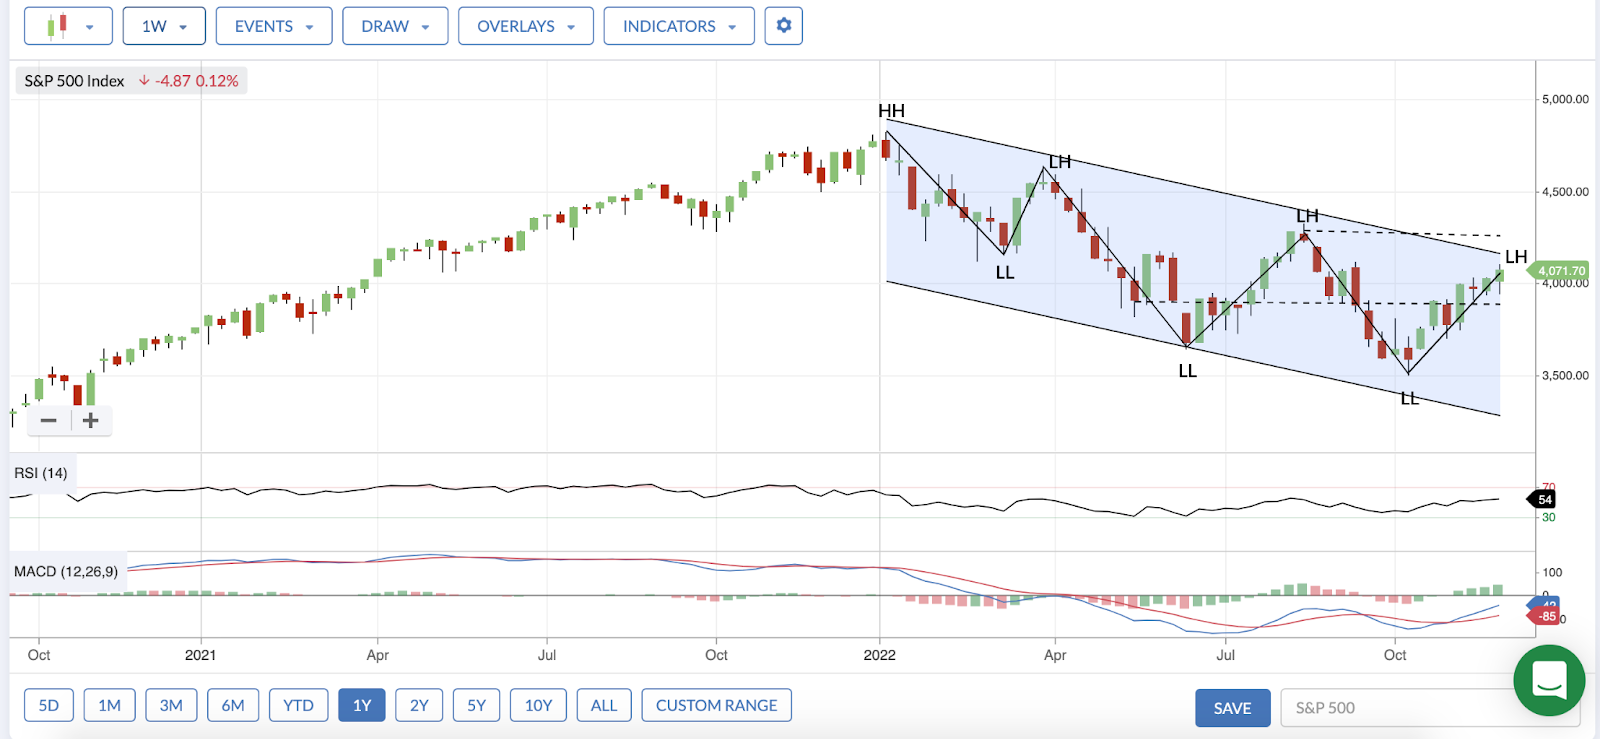
S&P 500 Weekly Chart
Or, if it fails to hold 3903, there is a real risk we could head back to sub 3400 which is the bottom end of the channel. The level is relatively significant for short term investors given the past three weeks have seen the wick of each weekly candle come close to testing.

S&P500 14 Nov – 28 Nov
Pleasingly, the index has been able to consolidate its RSI indicator above 50 which it first saw at the start of November, and it is rising. As is the MACD, therefore hope springs eternal that we can finally, and sustainably, break out of this downward channel.
While we’re not out of the woods yet, a positive outcome would help support sentiment on the Australian market.
S&P/ASX200
Despite the sell off on Friday (2 Dec), the S&P/ASX200 had another positive week. Confirming the return to positive momentum following the bounce off support in the start of October.
Crossing above the short term lower high of 7114.5 and the lower high of May has provided some strong hope that a retest of the solid resistance which has formed from the all-time high of 7628.9 can be re-tested.

S&P/ASX200 Weekly Chart
Re-testing the previous high is now a strong probability given the renewed market sentiment and the time of year which anecdotally is a strong one for prices.
Pullbacks are a normal part of the course for markets, in fact any pullback, provided it stays above the range of 6760 to 6830 (hopefully higher), will be quite bullish and further confirmation that the market may be headed on a short-term gallop.
More longer-term investors may wish to wait for a break above the previous all time high (resistance) to confirm that after a year of going sideways, perhaps markets are in for some clear air.
Other factors which further support a run to the previous resistance level include the RSI above 50 indicating that the market is moving in a positive trajectory, and the MACD has crossed to the positive side, with a growing positive bias.
All-in-all we can remain comfortable in the short-term allocating funds to stocks.
Stocks of interest
Following the lows of June, the recovery has seen many stocks set for a new run up. Its pleasing to see so many Bullish looking charts, though as always, I caution investors if you are using charts to time your entry into stocks, then you should use them to exit to protect your capital.
With so many potential road blocks from inflation, to rising rates, to geopolitical concerns there is a risk that any move may prove to be a false move as we saw with several protagonists in August.
ASX:DMP Domino’s Pizza Enterprises
After a horrible year price wise, this stock has found its feet and seems to be on a path to recovery.
Not even a capital raising was enough to change the base that the company has formed. The company has crossed into positive Average True Range (ATR) trailing indicator territory with the On Balance volume (OBV) indicator further supporting the recent price momentum. In the very short-term the next target is $75.51. A cross above that level will provide further confidence that the price has bottomed.

Shorter term traders may wish to implement a stoploss at $58.17 if the drawdown is not too large for them. Longer term, holding above $51.33 is critical.
ASK:IPL Incitec Pivot
IPL has seen nice support return to its price on the back of a strong operating environment and talk that is looking to split the fertilizers business from the explosives business. The sale of the troubled Waggaman ammonia plant in the US is also increasing hopes of a nice payout to investors should a suitor be found.
The price chart has been a nice step up with a series of High highs following lower highs. In the most recent run, the price is above the ATR , with new higher high created on Thursdays (1 Dec) close.

A retrace that sees the price stay above $3.50 could be a good possible entry point with an immediate stop loss set at $3.34, through to $3.18 for those with a longer term positive view on IPL.
ASX:ILU Illuka Resources
Mineral sands producer ILU has seen their price pull-back as China lockdowns impacted perception of the stock. Fundamental analysts will point to the company’s Eneabba Rare Earths refinery in 2025 as a driver for long term performance.
Trader wanting to take a position may wait for the price to break a short-term lower high of $10.73. Should it do that, hopes are it could run to its previous high of $12.50.
Price is above the ATR showing recent momentum is to the positive side, and the run has been supported by the OBV, ILU appears to be a stock setting itself up for another run if it can break key levels.

ILU Daily Chart
Should traders jump the gun and take a position now a stop at $9.60 would be appropriate with longer term believers setting their level around $8.22
ASX:SUL Super Retail Group
A very solid recent trading up has done much to allay the fears of investors post their report. Strong sales growth year to date of 20% were cheered by the market as reflected in the price.
The price has now crossed above previous resistance which was established at the May 2021 period, with traders hoping for clear air ahead as exemplified by the strong price moves above the ATR and OBV rising as well.

A suitable stop from here for shorter term traders would be $9.50, below that $8.67 would be another prudent place to put a stop should a position be taken now because the investor likes the business.
ASX:CIA Champion Iron
The talk of China lifting it’s COVID Zero policy has done much for the Iron Ore sector who have suffered as price has pulled back.
One of the more rapid recoveries has been experienced by $CIA who recently broke above a resistance range that started at the commencement of this financial year. As the sentiment around China’s re-opening has picked up pace, so too has the price of CIA and a number of other Iron Ore stocks.

Given the rapid bounce in price, traders who take a position here might set an initial stop loss at $6.50 which is where the price opened on the day it gapped up (1 Dec) . A movement back into the previous range (sub $5.58 would be a worry)
ALQ:ASX ALS Limited
Mining and life sciences firm ALQ has experienced a similar rebound in sentiment. In mid September this year, the stock had a false breakout where it cleared the $12.45 ceiling but then pulled back quite aggressively, retesting the recent lower low. Fortunately, the price rebounded since then and is once again near this level.

While the price is above the ATR and the set-up looks bullish I, don’t feel the recent recovery has been supported by volume. The OBV hasn’t quite been able to maintain the same position as price. Though it has moved sideways since the original price peak in April, it does have a downward bias.
Ideally when traders are looking for a strong run, the hope is that the increase in price is supported by a subsequent increase in volume.
Therefore, caution is warranted. Perhaps confirmation first rather than a pre-emptive move could be prudent.
However, for traders that do wish to take a position based on the recent build up at the $12.45 signifying an impending breakout to the upside, a stop loss of $11.20 would be prudent. $10.05 would be appropriate if investors really like the business.
ASX:ANN Ansell Limited
Healthcare business Ansell (ANN) has recovered solidly since the depths of the post COVID sell off. The sentiment of fear which drove the price down quite aggressively, particularly when coupled with the Russian war which has seen them exit the country and civil unrest in Sri Lanka which had the potential of impacting production levels.
But to the company’s credit, thus far it has successfully navigated these challenges and its price has reflected that.
Now that prices have returned to April levels, investors would be hoping the new higher low setup coupled with the breach of resistance, could prepare the stock for another run to close the gap to $31.
Should it be able to achieve this, hopes are that a retest of $34.50 could occur which then puts it back on a more solid footing for another positive move up.

Stop losses could be set for more aggressive investors at $27.50. Passive investors, may hold out to $24.50
AUB:ASX AUB Group
Likewise AUB has been progressively setting up for a solid run. Traditionally the stock is not too volatile, however it did have a big pullback to June lows. It has now recovered and the price is in the range of $22.95-$$23.55. A break above this range would potentially be positive.

Both the ATR and OBV suggest that momentum is on the side of AUB so investors may wish to get in a little early for another possible run to $26 and beyond should it get through this current range
ASX:NST Northern Star + Other Gold Stocks
Gold stocks have experienced a renaissance in recent times as some heat has finally come out of the USD. Further many Gold producers had flagged the risk of rising costs well before a number of other industries did.
This saw analysts take the red pen to their outlooks, however now that the shock of rising costs pressures has normalised. Many feel the expected cuts were overcompensated for with value appearing in the sector.
One such stock has been NST, since its recent lows in July the stock has rebounded strongly and is fast approaching $11.68- $11.85 which has been a range the stock has tested before in the past.
A break above that range would be a positive from a chart perspective. The risk would be that it hits the level, bounces off, and heads back south-east, which in the case of NST could be back to around $6.70.
Therefore, if you take a position on the back of rising gold stocks, be sure to keep your stop losses tight. In the case of NST, $10.30 would be an appropriate level to set a stop loss for the price where it currently is.

ASX:ALU Altium
ALU takes the title of “second best house on the street” behind Wisetech in the IT sector. The developer of software for 3D printed circuit boards is consistently growing its operations.
Since breaking up above $37 traders would be hoping for another run to all-time highs of $45.
The price has moved back above the ATR and has just created a new HH with its price moves last week. OBV also seems to be supporting the latest run up.

The latest run would have short term traders implementing a stop loss at around $33.50. Beyond that the next level would be $30.10. But for now, the chart looks bullish.
ASX:CSL CSL Limited
A stock hoping for a return to sustained positive momentum is CSL. Following the bedding of the protracted Vifor acquisition, coupled with an improvement in plasma collections, investors have high hopes for the longer-term.
For the minute the stock remains stuck in a broad two year channel of between $240 and $320.

An analysis of more recent price moves shows that the company has been setting up with a series of higher lows, which is a necessity for a stock wanting to get into an uptrend. Another tilt at cracking the $300 mark appears imminent, which would obviously be a precursor to heading back to above $320.
Further the short-term uptrend has been respected (touched) twice making it a valid move (highlighted below).

What is needed now is a sustained break above $300 to confirm that life has returned to the price. If it is unsustainable, then the price may fall back to $280. A price below that would be appropriate for a stop loss should a position be taken now.
ASX:MSB Mesoblast
Aggressive traders (hopefully) have watched the plight of MSB from the sidelines.
The brave may see the current price moves as something of interest, as price has bounced off the low from the end of June and has seen a series of higher lows confirm a path, it appears price has broken short-term resistance and with the nature of the stock, it could be headed for a run.

But volatility is a double-edged sword and MSB is prone to surprise negative announcements. Therefore, taking profits on the recent run will be prudent if you are lured to take another bite of the company.
Any suggestions?
We are just commencing with our contributions to the Australian / NZ market insights section of Stockopedia.
Is there anything else you would like to see written about? Do you have feedback on this contribution? Your feedback would be most welcome as we ensure that you receive editorial content that is most relevant to your investing.
Also if you have a specific chart that you would like to see reviewed in our weekly momentum newsletter please submit a request using the chat system (Green icon) on the bottom right hand corner of the screen.

While there is no guarantee we will be able to cover all requests, we are happy to fit one in if time allows.
Important Information: Stockopedia Ltd ABN 39 757 874 670 UK business registration number 0637267 (“Stockopedia”) is an Authorised Representative of Daylight Financial Group Pty Ltd ABN 77 633 984 773 (“DFGPL”) which is the holder of an Australian Financial Services Licence (AFS Licence No. 521404).
Information in this commentary is current as at date prepared unless otherwise stated. However, please bear in mind that investments can go up or down in value, and that past performance is not a reliable indicator of future performance. For more Important Information please refer to the Disclaimer section of this website.
This communication may contain general financial product advice. It has been prepared without taking into account your personal circumstances, and you should therefore consider its appropriateness in light of your objectives, financial circumstances and needs before acting on it.
If our advice relates to the acquisition or possible acquisition of a particular financial product, you should obtain a copy of and consider the Product Disclosure Statement (PDS) before making any decision.
The author holds interests in the following stocks mentioned in this article: ANN, ALU, CSL, DMP, ILU, IPL. This position can and will change at any time without notice.
Disclaimer
This is not financial advice. Our content is intended to be used and must be used for information and education purposes only. Please read our disclaimer and terms and conditions to understand our obligations.
12 comments
Thanks Elio, it's great to see a focus on some ASX and look forward teethe weekly momentum reports. Are you also looking at news /trading updates in terms of potential impact or focusing on the momentum that comes as a result afterwards?
Ours is a broad brief. So we will be looking at stocks from all angles.
But in this specific report it will be momentum only (up and/or down)
this is great thanks. I’m followingWhitehaven and Terracom (is the Div yield Stockopedía have correct?), it’d be good to have your analysis on these
Yes the Terracom yield is half correct. Its actually better as they have paid a dividend + special div twice in the last 6 months. The yield is expected to remain high but most expect them to moderate... a little. You can see the historic dividends here
So correct in fact that investors can't stop rubbing their eyes (and it has nothing to do with the lingering hay fever.) It has forced many managers to enter the space because not only are the yields so good, but they are still dirt cheap. I'm sure you noticed that the have very high StockRank scores (at least the ones in production). That said most, even the companies themselves expect thermal coal prices to moderate.
There is a lot to unpack with Coal miners. And I can't do it justice hear. Therefore it may require an exploration all on it own. But I encourage you to read their latest AGM presentations which will be available on your broker sites. The recent drivers for price are clearly articulated in their commentary. And its not just the Queensland super royalties tax.
Thanks for the suggestion
Thanks Elio
So will you be providing a Momentum report every week on the S & P?
It was really helpful in understanding where we are in the market
That is the plan John. Just an important point of clarification for others (though I believe by your statement you are aware of this John). I don't try to predict the future.
My style of looking at charts is based on a strong tendency for prices going up to keep going up and vice versa. Our job is to try to identify when that sentiment shifts.
I will try to add a bit more 'science' to this concept over the coming weeks as I discuss my momentum journey (with instalment one also published today) .
But 'yes' I do look at the broader S&P/ASX200 and SP500 as their sentiment affects how aggressive one can be in both position sizing and in 'buying the dip'.
Thanks for the kind sentiment.
Elio
Do you mind if you can write a segment on MQG?
TIA
Absolutely. More than happy to, as yours is the first request I have had. Of course it may also get covered in the wide range of articles that we right from now on in...
Just a reminder to everyone else, if you do have a suggestion for stock to be looked at on a Monday morning from a momentum perspective then click on the little Green speech bubble in the bottom right hand corner >>>
While there is no guarantee we will be able to cover all requests, we are happy to fit one in if time allows.
thanks for this excellent development!
You're welcome. Chris and I plus others look forward to delivering more over the coming weeks.
I thought the analysis was excellent and can only support your efforts. However, my main interest is resource stocks and the current vogue sector in lithium. Was very happy to see the note from Sam that you are launching a dedicated team to focus on Australian stocks. Cheers.
We're onto it Peter. We couldn't be an Australian contributor without discussing the big and lill' diggers from time to time. After all... they make up nearly 37% of the entire ASX in terms of number. Enjoy the show! BTW if there are any you are interested in us having a look at, you know where to find us.