Momentum Monday 06 February 2023

I started last week's Momentum Monday with one word, "Positive" and that carried on to the week just past.
<With the renewed optimism don't forget to share your stock of interest for all of us in the Village Square... read on here if you want to learn more>
It's amazing what a difference a month makes. January has done more than enough to distract us from real world issues such as inflation and so forth. This despite analysts all over the world, including here in Australia, increasing their expectations on interest rate rises, yet the market hasn’t battered an eye lid.
It reminds us why traders often choose to ignore analysing the macro scene, preferring price to do the research for them. And with so many stocks showing an improvement in sentiment, is it any wonder we have all forgotten about the impending crash.
I was asked by someone this week, "when will the crash come?" My response, "when we least expect it."
Broader market sentiment
S&P500
Despite the negative close on Friday, it was another positive week for the S&P500.

S&P500 Weekly chart
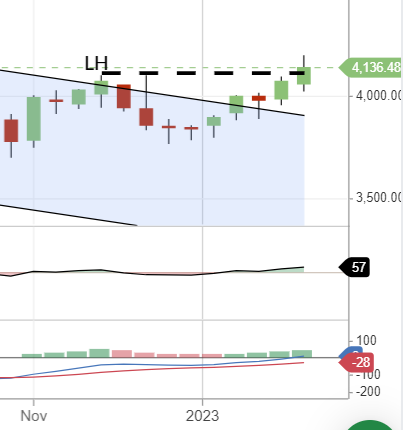
The index now looks well on its way to the 4250 range which would be the retest of the lower high back in early Aug 2022. Any break above that will likely see continued positive momentum.
The most pleasing aspect of the last two weeks performance was the break about the upper band of the downward channel that the stock was in.
S&P500 3 month weekly chart
While in of itself, it was not going to guarantee a positive stretch of performance, it does provide some comfort that the sell off which commenced from the peak in December 2021 is starting to lose steam, which will form a base for future moves.
But it was an extraordinary week for US markets. Meta rose 25% in a single day on the back of their latest quarterly result. To provide some relative context for Australian investors, imagine Telstra doing the same? Mind boggling.
The triple AAA's (Apple, Alphabet & Amazon) also reported mixed results, with the latter a major contributor to index's weaker finish on Friday.
But we had some big macro news week. First we saw the Federal Reserve lift rates by another 25 bps . At the time of the announcement the Reserve said it was likely there were more rate rises to come. This saw the market initially fall, until Chairman Powell told the market that there was already evidence that the US economy was tightening, and we saw a rebound.
Given those comments Chairman Powell obviously missed the employment memo.
Because on Friday, jobs data in the US came in red hot with nonfarm payrolls increasing by 517,000, nearly triple what was expected and the unemployment rate fell to 3.4%, the lowest jobless level since May 1969. This doesn't sound like an economy where tightening is occuring to me!
Which brings me to why I love Stockopedia so much. Because trying to make sense of last week's noise is a no sum gain. In fact reading the headlines, and more importantly the narratives that are attempted to be attributed to market falls , are pageantry at best. Stockopedia keeps me aligned to my strategy by providing objective data that I combine into my decision process.
The sole reason why a market goes up or down in a day is because more people choose to buy than those that choose to sell. Why this decision is made at any point in time is beyond the scope of any one's comprehension unless that had access to the investment strategy of the people/computers engaging in the trading. But that is their strategy, not mine, I will do what I do based on my objectives and tolerance to risk and I won't let headline sway me from that.
It's true that the macro pieces of news do have an impact on our companies fundamentally over time, so we can't ignore them completely. But to suggest they are drivers of performance is a misnomer. And this week proved as much.
As Warren Buffet once famously said, "Market forecasters will fill your ear but will never fill your wallet."
Again I am digressing... back to the Chart
To which there is really not much to add as all indicators look positive, even the daily SP500 reflects the positivity and looks even better given the retrace in December and subsequent rebound.

S&P500 1 year daily chart
So our next upside target is 4300. Our positive disposition should remain unless the price falls below 3650.
ASX200
The market experienced its 17th out of 22 weeks of positive moves. While the grade of gains have not been too significant, the sheer number of up days and weeks have certainly helped the spirits.
We are only 70.8 points away from our all time high and that retest of resistance will occur soon

S&P/ASX200 Weekly chart
Given the length of this rally, I will say now that my preference would be for the market to pullback for a week or two and then make another push up.
So many up days relative to down days has the risk of this being like butter spread over too much bread. The longer it stretches out in a North Easterly direction, the more likely the market will have a steeper pullback.
There is really not much to add other than range of 7580 all the way through to the high of 7628.9 is our next target.
As mentioned many times before this level / range will be a critical resistance point that we need to monitor, especially as it has been tested 3 times before.
Break through and we have blue skies at all time highs, fail to break through and the pullback could be deep, even down to 6500.
All indicators, MACD, RSI look positive. This includes on the day charts where ATR, moving averages or OBV are working in tandem..

RSI & MACD weekly chart

S&P/ASX200 Daily chart YTD
With a chart like this, we can look to buy stocks. Even to feel more comfortable with 'buying the dip' which I will do when some of the names we are all looking at pause to take a breath.
Stocks of interest
Tip: if you look at the list on the right hand side you will see the stocks mentioned within this week's contribution.
Caution: While there are a number of positive set ups, we are approaching the reporting season which can traditionally lead to more volatility on both the up and downside. These moves will be driven in large part by Fundamental factors making Momentum less effective. Investors should be mindful of this when looking at charts for the minute.
We continue to see a number of stocks shaping up for recoveries and/or many primed for continuation of their strong trends. It's been a while since so many charts have looked this promising. Fingers crossed it can continue .
Author note: In line with the approach I am using with Stockopedia, I will focus the majority of my attention to stocks with a QM rating above 80 and market cap above $500M. To learn more please read the last instalment of my momentum journey here. I will discuss where their charts presently sit to provide context for potential and current investors.
These stocks are considered purely for the purposes of education. Be sure to read all relevant commentary to understand the context from which a chart is presented. It’s not always positive!
ASX:NHC New Hope Corporation. QM Rank 94 A$5.79
It is fair to say that Thermal Coal stocks have had a very tough month after what had been a stellar year. Talk of miners having to reserve as much as 10% of output for domestic supply from mines based in New South Wales has impacted sentiment in the short term.
We have discussed WHC frequently and their price is currently sitting around a key support level. But a stock we have not covered is New Hope (ASX:NHC).

ASX:NHC 1 year daily chart
From a chart perspective it is not too dissimilar to WHC. After peaking in October at close to $7.50, the price has been in steady decline.
It's easy to see why over enthusiasm gripped this stock, and some pundits would argue this is a case of the price normalising. However its still generating a cracking return on equity, huge dividends and all on a PE of 3.5x. If the company can return a strong half year report then there is a possibility of a return to favour soon if the profit taking sentiment is not too strong.
However the company has a July/January reporting period and therefore NHC won't release a result until next month, though we should get an activity update towards the end of this month.
NHC is in the short term a little directionaless, given the general sideways move and price below the ATR. The key levels to watch here in the short term for more recent investors will be $5.16 which was the close in Early November. This is because since that low point we have seen a new lower high, and a breach below the $5.16 level will flag an new lower low. This will mean the stock has moved into an official downtrend.

ASX:NHC Daily chart 4 months
As a bare minimum a break above $6.52 will be needed for some confidence that the downward bias on this sideways channel has ended. This coincides with the ATR level at the moment which therefore implies how pivotal this point is.
I mentioned the key level of support for those who have entered the stock more recently. For those who have held the stock for a long time, that level of support will be next at $4.00. However if you are nervous, then likewise you may wish to choose the $5.12 level as your key area of support.
I feel the $5.12 level will be strong as many investors wait to see how big the dividend will be. If it comes in at the top end of estimates we may see a rapid rebound.
ASX:CAR Carsales.com. QM Rank 97 $23.41
A request was made to look at the chart for carsales.com (ASX:CAR), which has seen a floor of support since the capital raising to fund the acquisition of the Trader Interactive shares it did not already own.

ASX:CAR 1 year daily chart
Since then price has set its short term lower low, with subsequent high highs formed since then. At this point the price is at a short term resistance level, though it has just breakthrough the short term higher high of $23.24 and looks primed to retest the all time highs at $25.70 achieved back in December 2021.
Zooming the chart out and looking at it from a longer term perspective It looks primed for another run.

ASX:CAR 2 year daily chart
Not only the retrace back to $17 in June 2022 create a new higher low, but as every retrace has occurred on the recovery it has been shallower and shallower.
The OBV has supported moves in the price, and if it is able to break above all time highs then it will continue the stocks positive trajectory.
For those keen to take a position now before the breakout one would look at a stop loss level of $20.40.
ASX: IPL Incitec Pivot. QM Rank 98 A$3.42
Another request from a client is Incitec Pivot (ASX:IPL). The stock was discussed in our first ever Momentum Monday article back in early December 2022. You can it read here

At the time we said a retrace back to $3.50 would be a good possible entry point if the price stayed above that level. It hasn't unfortunately.
While it is still above an immediate stop loss level of $3.44, it would not surprise me if there was better buying all the way down to the last chance saloon which is $3.18.
However, ignoring this short term move, it's obvious that the price $4.12 has proven to be a strong resistance level now that it has been tested three times since April 2022 and the price has failed each of those.
Investors who are yet to take a position in IPL, may wish to wait until price breaks through that resistance level. Otherwise they may wish to take a position now (or atleast above $3 60), given at this stage the retrace has been orderly. The good news is you won't have to wait long to know if you are wrong as $3.18 would be your stop loss.
ASX:XRO Xero. QM Rank 85 A$81.90
Investors have waited a long time for Xero (ASX:XRO) to find a floor since the pullback from alltime highs commenced in October 2021. Have we reached it? Not until we cross back above $97.11 which was the lower high in August 2022.

ASX:XRO 1 year daily chart
This stock has been quite volatile. Since hitting the low of $64.74 recently in November 2022. Pleasingly the rebound since then has been supported by an increase in volume which may entice some traders to get in a little earlier (stop loss would be $64.74)
However more conservative traders will want to see the price create a new higher, retrace and then consider a position. As we know when it comes to Dow Theory, a stock is in a downtrend until it's not. And XRO is still in a downtrend.
ASX:IAG Insurance Australia Group. QM Rank 82 A$4.73
"When it rains it pours "
Sorry... but has there ever been a more apt saying for Insurance Australia (ASX:IAG). Thinking it was over the worst of the Australia East Coast floods, the Auckland crisis has tipped the stock over the edge. It announced last week that 5000 new claims had been made and it was forced to increase its natural hazard provisions. The net outcome is a further squeezing of margins.

ASX:IAG 1 year daily chart
Therefore it is unsurprising to see the pull back in price since the 52 week of $5.08. In the face of its current challenging environment, the company's price had remained resilient though it all. However, the rapid pullback suggests that the dam wall may have broken.
Those looking for an entry may find better buying towards $4.30 or even $4. Though we encourage investors to keep their stop losses tight.
ASX:TWE Treasury Wines QM score 96 $14.79
It's amazing to think that the US business for Treasury Wine Estates (ASX:TWE) has been tha saviour in recent years where it once was the reason for its large correction.
However a massive restructure of the business and focus on premium labels has given it enough support to oddest the damaging China tariffs which risked crippling the business.

ASX:TWE 1 year daily chart
As we can see in the chart, the imposition of tariffs in 2020 saw the price fall heavily as at the time China made up about two thirds of the total Asia regions earnings or a total of 30% of its overall group earnings.
However since the big reset, the price has steadily risen from the canvas and has been making a series of higher highs and higher lows with a clear upward move since June 2022. And since we last discussed it at the start of this calendar yearr it has gone from strength to strength.
The price is now at 52 week highs and with talk that there may be a thawing of China/Australia trade relations imminent, investors are hoping that is the bonus on what has been a pleasing ex-China recovery to date.
Let’s hope the balloon doesn't pop on this.
ASX:LIC Lifestyle Communities Rank score 88 A$19.93
Since the lows of June 22, Lifestyle Communities (ASX:LIC) has seen a stepped up improvement in price and is clearly in an uptrend given the series of higher lows and higher highs. It's next target is all time highs at $23.50.

ASX:LIC 1 year daily chart
It's quite staggering that the lifestyle downsizer has seen price rise four fold since the COVID lows, therefore investors don't need indicators to suggest this stock has been in a clear up trend since then. Had an investor ridden this stock up for all those multiples, a stop at $11.63 would be the official end of the run.

ASX:LIC 3 year weekly chart
However if that is too deep to stomach then we can look at shorter term trends to help us to some degree. And that price is $14.95. That said, there is no immediate risk that the level will be breached as this is a strong uptrend.
ASXJIN Jumbo Interactive. QM Rank 94 A$15.19
A stock that has likewise discussed at the start of the year and has appeared to have found its floor is Jumbo Interactive (ASX:JIN). Following the lows in October the stock has made a stepped recovery in price with a series of higher lows and high highs.

ASX:JIN 1 year daily chart
It now finds itself at a structural level where support can be found at a previous lower high in August 2022. If the price can hold this level it bodes well for the future trajectory of the price.
However at this point a stop loss at $13.79 would be appropriate as that level was tested during the last leg up a number of times between November and December.
But the price is close to the ATR which is a level of support, the price is above the 50 day exponential moving average (EMA) and the 50 day EMA has crossed back above the 200 day EMA.
All in all the price for this Lottery SaaS business is on the mend price wise after a tough 2022.
ASX:CUV Clinuvel Pharmaceuticals. QM Rank 97 A$24.47
We also last discussed Clinuvel Pharmaceuticals (ASX:CUV) a month ago. The price then was about $23. Since then the price rose to $28.29, but over the past week has fallen aggressively to $24 50. This despite results from the drug afamelanotide showing it can reduce critical skin damage caused by ultraviolet (UV).

ASX:CUV 1 year daily chart
Back then we highlighted what the potential action was likely to be. While the price didn't hit ~$30 (it got close), it has behaved as expected and the retrace was the previous breakout point of $24.50 which was a structural resistance level identified from a previous lower high..
Normally I would point to this being a strong set up stance. And it will be, IF it can hold this level. If so then we maintain a continued bullish stance. Failure to hold and it could move back down to $18.
ASX:GPT GPT. QM Rank 81 A$4.76
I have decided to cover GPT (ASX:GPT) however there are a larger number of property trusts that look like this chart GOZ, SGP and CIP to name a few and similar commentary could therefore be attributed to each.

ASX:GPT 1 year daily chart
GPT has found a floor in September following a period of significant sell down. As for the reasons? Well take your pick. Rising Interest Rates, falling property values, changing retail shopping behaviour, changing work practices….
The latest run up however has taken us above two previous lower highs in June and Nov 2022 which is pleasing. There will be an inevitable pullback. And traders will be hoping it stays above $4.20 as that would mean a new high low, and the start of a potential uptrend.
While it will be a long slog back to prior levels, the set up will deliver some confidence that the down trend since the peak at the end of 2021 may be over... or at least receiving a bit of a reprieve.
In this scenario I would trade the pullback to around $4.50 with $4.20 my stop loss.
52 Week High screen.
Academic Research has shown that stocks close to their 52 week highs tend to outperform.
To that end I have attached the results of a screen run within Stockpodedia showing every stock above 200 million market that is trading at least 5% from its 52 week high. (If you wish to recreate this criteria in the scanner select "Price vs 52 high" greater than -5%)
This has not considered liquidity of the stock nor does it consider is fundamental qualities. However we have included each factor score to help you.
a is cu3 February and is sorted by the stocks closest to their 52 week high.

Any suggestions?
If there is any company you would like to see written about? Do you have feedback on this contribution? It would be most welcome as we want to ensure that you receive editorial content that is most relevant to your investing.
Please feel free to write any comments below.
While we guarantee that all feedback will be read and digested, there is no guarantee that we will accept them. Though we do have an open mind at the minute.
________________________________
Important Information: Stockopedia Ltd ABN 39 757 874 670 UK business registration number 0637267 (“Stockopedia”) is an Authorised Representative of Daylight Financial Group Pty Ltd ABN 77 633 984 773 (“DFGPL”) which is the holder of an Australian Financial Services Licence (AFS Licence No. 521404).
Information in this commentary is current as at date prepared unless otherwise stated. However, please bear in mind that investments can go up or down in value, and that past performance is not a reliable indicator of future performance. For more Important Information please refer to the Disclaimer section of this website.
This communication may contain general financial product advice. It has been prepared without taking into account your personal circumstances, and you should therefore consider its appropriateness in light of your objectives, financial circumstances and needs before acting on it.
If our advice relates to the acquisition or possible acquisition of a particular financial product, you should obtain a copy of and consider the Product Disclosure Statement (PDS) before making any decision.
The author holds interests in the following stocks mentioned in this article: IPL, JIN, TWE. This position can and will change at any time without notice.
Disclaimer
This is not financial advice. Our content is intended to be used and must be used for information and education purposes only. Please read our disclaimer and terms and conditions to understand our obligations.
1 comment
Hi Elio
Can you please discuss JH X. As the USA market is improving I thought this stock maybe a good investment opportunity