Momentum Monday 06 March

The reporting season is now over, and as has been previously mentioned this time of year is very important, even for momentum investors.
Not only because analyst rework their estimates, (and an element of which is incorporated in our Momentum score), but also because with regards to the chart, it is often a period of get volatility and any move can re-base the price from which future moves may be assessed.
I look for structural levels of support and resistance and often these are formed around this time of year as prices can have sharp reversals or spikes.
A new month also means we have a new Village Square open that you are all welcome (and encouraged) to contribute to. Please click on this link to be whisked away to our community sharing place.
And we also have our reporting season webinar review happening on Thursday 9th March at 12:30pm AEDST. Book your seat today in the Virtual Room. Even if you can’t tune in live, be sure to book in and we will send you a copy of the recording to watch at your own leisure.
Finally don’t forget to check out the recent reporting season review where we monitored the change in Rank Scores for all ASX200 companiesand a few more of interest. You can read the article here.
The agenda for today’s report as always:
Broader market sentiment
Stocks of Interest
52 week high screen
Broader market sentiment.
S&P500
The S&P500 experienced a positive week, after three prior negative weeks, with the index rising 1.9%.
This positive short-term signal adds to the hope expressed in weeks prior, that we’re in the process of establishing a new higher low and continuing out short-term rebound that can hopefully put the downward channel of 2022 behind us.

S&P500 weekly chart
While the immediate concerns around rising inflation and interest rates haven’t gone away, there was a reprieve this week as a member of the Federal Reserve board indicated that perhaps 25 basis point rises were all that were need herein, rather than stepped 50 basis point increases (or worse).
Also yields on 10 year treasury bonds fell to below 4% and the market likely found some support with that.
There is also a growing idea amongst companies (its coming up a lot more in their commentary) that the Inflation Reduction Act signed last year further supports economic growth for the nation. For those who don’t recall, the Act is a $237 Billion program to be spent over the next 10 years to promote companies to consider domestic manufacturing capabilities as well as encourage procurement of critical supplies domestically or from free-trade partners (like Australia). There is also a heavy focus towards promoting green technologies. This program is expected to contribute significantly to the Economy for the time it is in place.
Back to the chart, and if we look at daily prices we can see the action in more granular detail.

S&P500 6 month daily chart
In the January 30 edition of Momentum Monday we said, “Should a golden cross emerge (50 day moving average crosses back above the 200 day moving average) that will provide some further comfort the pace of the sell off may be ending.”
That actually occurred at the start of the next week, with the added good news that the February pullback has been mild, and therefore this trajectory has not changed. While not traditionally the most reliable indicator, however mathematically it reflects more positive sentiment.
For now, the US Market remains ‘optimistic’ of a possible turn around.
S&P/ASX200
It was our fourth consecutive down week for the market. Which means (as it always does) that we are closer to an up week.

S&P/ASX200 Weekly chart
The month of February was a down month overall, which is to be expected after the very strong January we experienced.
“IF” the market is able to stay above the 7038 level that we highlighted last week, it could possibly go down as one the very best examples of an orderly retracement on a short-term uptrend we have seen in a long while. Four consecutive down weeks haven’t been enough to breach it (or even come close to it) but it has been of a sufficient time for everyone to catch their breath after a hectic January and then reporting season.
Speaking of which, we have discussed reporting season enough in other forums and as expected margins were the main pressure point this time around. While revenue outlooks looked good (which we already knew with sales updates in Jan) costs have been rising as well.
While it is easy to forget, with the exception of the past decade and a half, companies have always had to deal with rising costs brought on by inflation. It will be really interesting to see how companies continue to manage it moving forward.
The down move in February wasn’t enough to turn the RSI below 50 or turn the MACD inside out. Again a promising position to be in.

As an aside, for those wondering whether proposed changes to double the concessional tax rate, from 15% to 30%, for superannuation balances over $3 million is likely to impact the market, the answer for now is no.
The unknown factor of course is the failure to index the cap over time which may create a future issue. Notwithstanding this, volumes in the market are driven by much larger balances than personal super monies, and funds still need to go somewhere, so this move if anything is likely to impact politically, more than market wise.
Just to reiterate as we have the last few weeks, this market is investible. Though always be alert.
Stocks of interest
Tip: if you look at the list on the right hand side you will see the stocks mentioned within this week's contribution.
Author note: In line with the approach I am using with Stockopedia, I will focus the majority of my attention to stocks with a QM rating above 80 and market cap above $500M. For those who may be new to this report please read the last instalment of my momentum journey here. I will discuss where their charts presently sit to provide context for potential and current investors. You can revisit the series of articles starting with Episode One here.
These stocks are considered purely for the purposes of education. Be sure to read all relevant commentary to understand the context from which a chart is presented. It’s not always positive!
ASX:LOV Lovisa Holdings. QM Rank 99 A$24.01
We last spoke of Lovisa Holdings (ASX:LOV) in the last edition of 2022.

ASX:LOV 1 year daily chart
The price held the $21.30 level flagged and even went on to create a new higher high at the peak January run up.
The new level of support is now $22.50 that I too will be watching closely as the price continues to find itself finely priced and I want to ensure I capture as many gains as I can.
Of comfort was the fact that even despite the premium placed on the stock, its report obviously didn’t disappoint the market (note: you would have noticed had it.)
For those looking to take a position, I wouldn’t even consider it until it broke above $26.60 which is where I have my 2.5x ATR multiple sitting at the minute.
ASX:CTT Cettire QM Rank 97 A$1.63
Another stock that seems to be in a recovery since July 2022 lows is CTT.

ASX:CTT 1 year daily chart
If there was to be a stock that reflected the fickleness of market sentiment it has to be Cettire (ASX:CTT). With sentiment changing like last seasons clothes, CTT listed at IPO in 2020 for 50 cents, rose to an all time high of $4.74, then fell all the way back down to a low of $0.35 in July 2022 (otherwise known as a “Mt Fuji pattern”).

ASX:CTT Weekly chart since IPO
However since it has found it reached its peak low, it has started to climb back up the moment in what would appear to be a more steady and controlled way.
A series of high highs and higher lows supported by a rising OBV show commitment is starting to return to the price. Even the 200 day EMA now appears to be turning upward. It was even one of the big improvers in StockRank this reporting season.
Given the strength and length of the last negative move, I will wait to see if the price can cross above the ATR which is at $1.80 before committing because there is still a risk we could test $1.165 which was the last level of structural support.
For those who currently hold, that level may be too far aware to palate, so a stop of $1.52 would be more appropriate.
ASX:FLT Flight Centre Travel QM Score 84 A$18.86
Another big improver from a Stock Rank perspective this interim reporting season was Flight Centre Travel (ASX:FLT)

ASX:FLT 1 year daily chart
The challenges faced by FLT require no explanation. From a peak of $60 in 2018, to eventually below $10 at the peak of the COVID craziness.
It would be fair to say that when looking at FLT, it is best now to do so following the COVID reset.
FLT has actually found itself in a price channel for the last two years since creating the new higher high in 2021. The price is currently within the channel of $13.40 and $23.50.

ASX:FLT 5 year weekly chart
I point this out because looking at a short-term chart, things do look on the mend. Since the capital raising in February, support has returned to the price. So much so that an underlying loss for the half wasn’t enough to stop the move.
Since breaking above the short term lower high, the price is above the ATR. Last week the 50 day EMA crossed above the 200 day EMA, and the recent turn up has been supported by on balance volume.

ASX:FLT 6 mnoth daily chart
The company still has it all to do ahead of it fundamentally, however from a price perspective it looks ok. The rapid run will eventually need to take a breath. Better buying may be had around the $17.70 mark with a stop at $15.60.
For those over eager to jump in now, then a stop at the previous lower high level of $17.10 may be appropriate. For now the upside and downside targets correspond with the channel it is in between $13.40 and $23.50, they will likely prove strong support/resistance levels should price again test either level.
On the balance of probabilities it will likely be the upper point of the channel that will be tested first.
ASX:MMS McMillan Shakespeare. QM Rank 97 A$14.78
Another interesting chart belongs to McMillan Shakespeare (ASX:MMS) at the minute.

ASX:MMS 1 year daily chart
Anyone trying to trade MMS since September 2022 would have found this a must frustrating exercise. MMS is a high quality company whose price has been somewhat suppressed by the lack of availability of stock to fulfill orders.
However that bottle neck is easing and as employers look for smatter tax efficient ways to reward staff in a high inflationary environment, salary packaging makes sense.
So MMS is one to have on your watchlist, particularly if it can break out of this $12.70 to $14.80 channel it has been in. The possible outcomes from a breakout in either direction should be daily obvious now to those of you who have been reading Momentum Monday since we launched it 3 months ago.
However, one thing to remind you all, even if price breaks up above resistance at $14.80, I would expect price to have a slight pullback first before continuing on its trajectory. So I think better buying will be had at the $13.85. Its pretty obvious where a stop loss would be set - so I will leave that to you to figure out.
ASX:SIQ SmartGroup QM Rank 92 A$6.60
Not as frustrating for investors has been Smartgroup (ASX:SIQ)

ASX:SIQ 1 year daily chart
We last discussed SIQ in the 16th Jan edition of Momentum Monday (remember: you can access back editions by clicking on "Discuss" area on the left of screen.) At the time we mentioned a long awaited turnaround in the sentiment of price was starting to occur, but that it still had work ahead of it including filling the gap to $6.85.
Fast forward to today and we are almost there. The 50/200 moving averages continue to converge and the rising price has been supported by a rising OBV. This $6.85 - $7.30 level will be a pivotal point for the stock as it it’s likely that it will act as a resistance level with the price due for a pullback when it gets there.
That point may prove a good entry for those that missed the latest run (assuming the price can stay above $5.70 on the retrace)
Alternatively if it keeps running and breaks through the barrier, then the next upside target is $9.05.
ASX:IEL IDP education QM Rank 93 A$27.87
A stock I have had a positive disposition on for some time is Idp Education (ASX:IEL) and until one month ago, I would say I was vindicated.

I last spoke of IEL back in the last edition of 2022. I said then that if price could hold $26.14 (which it did) and bounce off it, that it will be a bullish indicator. The price subsequently ran up to $32 creating a new short term high high but it has retraced since and is now rapidly approaching the support level of $26.58.
For those who may have missed out on the first run, an opportunity may soon be approaching. Should price hold above $26.58 and get back above $29.60 (this is when the ATR 2.5x multiple will turn green ) an entry signal will be given. At least you won’t have to wait long to know if you were wrong as $26.14 would be the stop loss level.
ASX:IMD Imdex QM Rank 98 A$2.45
Mining technology business Imdex (ASX:IMD) has experienced a steady recovery in price.
ASX:IMD 1 year daily chart
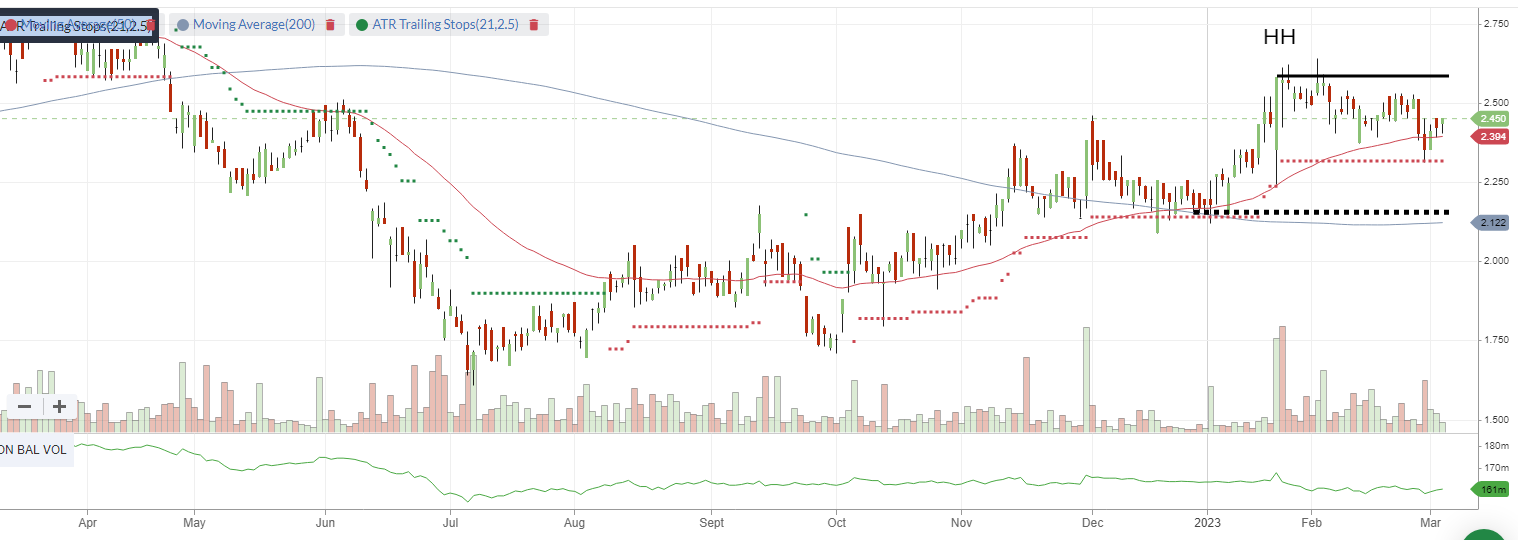
The most recent high in January was enought to pass the prior June 2002 level and the series of short term higher highs and higher lows has the stock in a short term up trend.
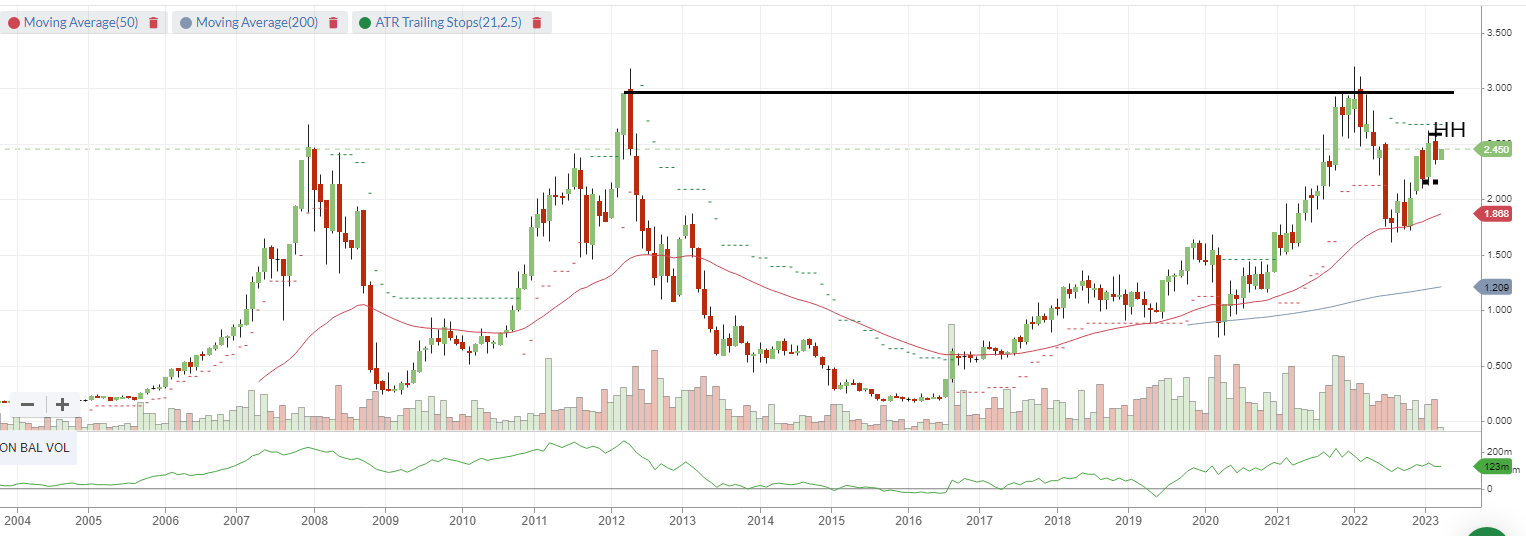
Should the level break $2.58, then should the market find some support, sentiment may drive this stock back to all time high levels of $2.95 - $3.00. This will be a significant level for IMD as not only was it the December/January period, but it also correspons with the all-time high set in 2012. Therefore this range will be one to watch when it gets there.
ASX:IMD Since listing monthly chart
Back to more immediate levels. For traders a price break above $2.58 will be positive, with a stop below $2.16.
ASX:AUB Group QM Rank 91 A$26.92
One argument for holding insurance companies is “you’ve got to have insurance anyway…” But rather than take direct exposure, why not consider a broker like AUB (ASX:AUB)?

We last discussed AUB at the start of the year. We wrote, “A break above the very short-term mini high of $23.50 may be enough to convince the price to go for another run to the high at the start of the year of $26, and then who knows beyond that.”
Well we are here now, a little higher actually. Where to now? Who knows. We are at all time high levels and the price and complexity of insurance is ever increasing which adds further support to the demand of AUB’s service. (PS I speak from experience as I utilise one of their subsidiaries CountryWide brokers for my own policy).
Someone once told me, “think less, make more money”. That rings true for AUB at all time highs.. A stop for those considering a position from here would be $22.86.
NSX:VCT Vector QM Rank 85 NZ$3.99
New Zealand energy company and communication services company Vector (NZE:VCT) delivered a solid result without shooting the lights out. Unfortunately this has seen the price reflect that sentiment.
The stock has held up quite well, like on account of Entrust who holds a 75% interest in the company. This large holding poses both a risk and potential boon for those brave enough to take a position.
Though at the moment it looks like the risks are weighted to the downside.

NSX:VCT 1 year daily chart
The price has touched the $3.97 - $4.00 range three times over the past 12 months. In fact if it wasn’t for Friday, the stock would have closed below that range.
Since reaching the all-time high in August 2022 supported by the lack of free float shares available, the price has retraced back to support. The bounce off that line wasn’t enough to get back to higher high, so there is a risk we are starting to see a textbook start of a downtrend.
Investors in it will need to act with caution as with only ~NZ$400k traded per day, there is a risk that a run on the stock could push it down quickly. How low could it go? With the support of Entrust who are in it for the long haul (Entrust were the Auckland Energy Consumer Trust or AECT and owners the 75% interest for its trust members.) It is unlikely that any sell off will be too steep, but then again, the buy up may have been because of the lack of liquidity resulting in a disconnect between price and the fundamentals.
A breach of the current level will see us run quite quickly to NZ$3.60 - NZ$3.70. Below that and COVID levels of NZ$3.15 then come into play.
ASX:SLX Silex Systems. QM Rank 88 A3.40
We last discussed Silex Systems (ASX:SLX) in late January. At that point, I mentioned that stocks who have massive runs make it difficult to apply structural levels of support because they are running so hard. That was when the price was $4.85. It eventually got to a high of $5.11.
But the price has since cratered on the back of the announced $120M capital raising at $4.05. With the price currently at $3.40, it tells you what the market thought of it!

ASX:SLX 1 year daily chart
Back when we wrote about it at $4.85 we said a parachute stop would be appropriate at $3.80 (which was the low on the day trade resumed.) In effect after the further rise to $5.11, that well too would have risen to above $4.00 which is where the stock opened on the day.
Some investors (including myself) may now be thinking it is their opportunity to get into the Uranium Enricher while the price is back to levels not seen since the start of the year.
It is also a timely reminder as we mentioned in January, that traders need to be extra cautious on aggressive runs, because common sense applies in that after such rapid rises there can always be a big pullback.
While this situation is incredibly frustrating for holders, to those sitting on the sidelines it throws up an opportunity. Am I going to get in now? Well given that the fall is likely caused by the capital raining, rather than any problem with the business, I will strongly consider it (as I have held it in the past).
Most likely not now though. There are still a lot of investors in profit so there may be some flushing out still yet to occur. I will look for a consolidation in price first to convince me that those willing to get out have done so.
Could it get to the $2.60 structural support level? Maybe. But I think it would be a blink of an eye if it did. So for me a buy zone about $2.80 - $3.00 which would still see the company in that medium term uptrend, and I am still picking it up much cheaper than recent highs. Also with the $2.60 level so close “I won’t have to wait long to know if I am wrong” as that would be a good stop loss level.
Of course there is a chance I will miss it as I don’t think it will take much to see price run once again if the company continues to deliver good news. That is always the challenge of balancing risk vs reward. But patience more often not is rewarded.
52 Week High screen
Academic Research has shown that stocks close to their 52 week highs tend to outperform.
To that end I have attached the results of a screen run within Stockopedia showing every stock above 200 million market that is trading at least 5% from its 52 week high. (If you wish to recreate this criteria in the scanner select "Price vs 52 high" greater than -5%)
This has not considered liquidity of the stock nor does it consider its fundamental qualities. However we have included each factor score to help you.
Data is at 03 March and is sorted by the stocks closest to their 52 week high.

Important Information: Stockopedia Ltd ABN 39 757 874 670 UK business registration number 0637267 (“Stockopedia”) is an Authorised Representative of Daylight Financial Group Pty Ltd ABN 77 633 984 773 (“DFGPL”) which is the holder of an Australian Financial Services Licence (AFS Licence No. 521404).
Information in this commentary is current as at date prepared unless otherwise stated. However, please bear in mind that investments can go up or down in value, and that past performance is not a reliable indicator of future performance. For more Important Information please refer to the Disclaimer section of this website.
This communication may contain general financial product advice. It has been prepared without taking into account your personal circumstances, and you should therefore consider its appropriateness in light of your objectives, financial circumstances and needs before acting on it.
If our advice relates to the acquisition or possible acquisition of a particular financial product, you should obtain a copy of and consider the Product Disclosure Statement (PDS) before making any decision.
The author holds interests in the following stocks mentioned in this article: LOV, IEL, AUB. This position can and will change at any time without notice.
Disclaimer
This is not financial advice. Our content is intended to be used and must be used for information and education purposes only. Please read our disclaimer and terms and conditions to understand our obligations.
No comments yet
No one has commented here yet! Why not be the first one?