Momentum Monday 06 November

Welcome to Momentum Monday.
I’ve said it before, the more consecutive down weeks we face, the more likely we will see a positive week. And after the 3 months to the end of October - we were due. More in a moment.
Also despite the Melbourne Cup, the race that stops the nation…. Literally for two days… we will be open and support will continue as per normal.
Interesting links
Next member only Friday’s Lunch ‘n Learn webinar Book your place here
Weekend Watchlist with Shares for Beginners Listen here
“Empower Others” referral program Learn more here
Follow us on Social Media Facebook Linkedin Instagram or X (formerly Twitter)
This week’s content is as follows:
Broader market sentiment
Member corner
Stocks in the “Shine Zone” (including changes)
Buses pulling out of the station (volume + price movers)
52 week high screen (including changes)
Also as a final reminder, the recent research area has changed its appearance. However if you wish to see the full list of articles we have written then go to the “Discuss” area and select Aus/NZ blogs

A reminder that you don’t have to read all this contribution. Simply scroll to the area of interest.
Broader Market Sentiment
We look at the direction of both the US and ASX markets to gain an understanding of the broader sentiment at the minute. It is important to stress here that I DO NOT use this to time my entry or exit out of stocks. I prefer to use the individual charts of stocks to do that. However I find it useful in helping us determine how aggressive/cautious traders should be in their trading. In short the more positive the broader market is the more risks you can take and vice versa.
US / S&P500
Last week I mentioned we were right on structural support.
This week, five days of consecutive gains would suggest the market also noticed, rising 5.8%, the best week since November last year. The price action actually took us back above where we were two weeks ago.
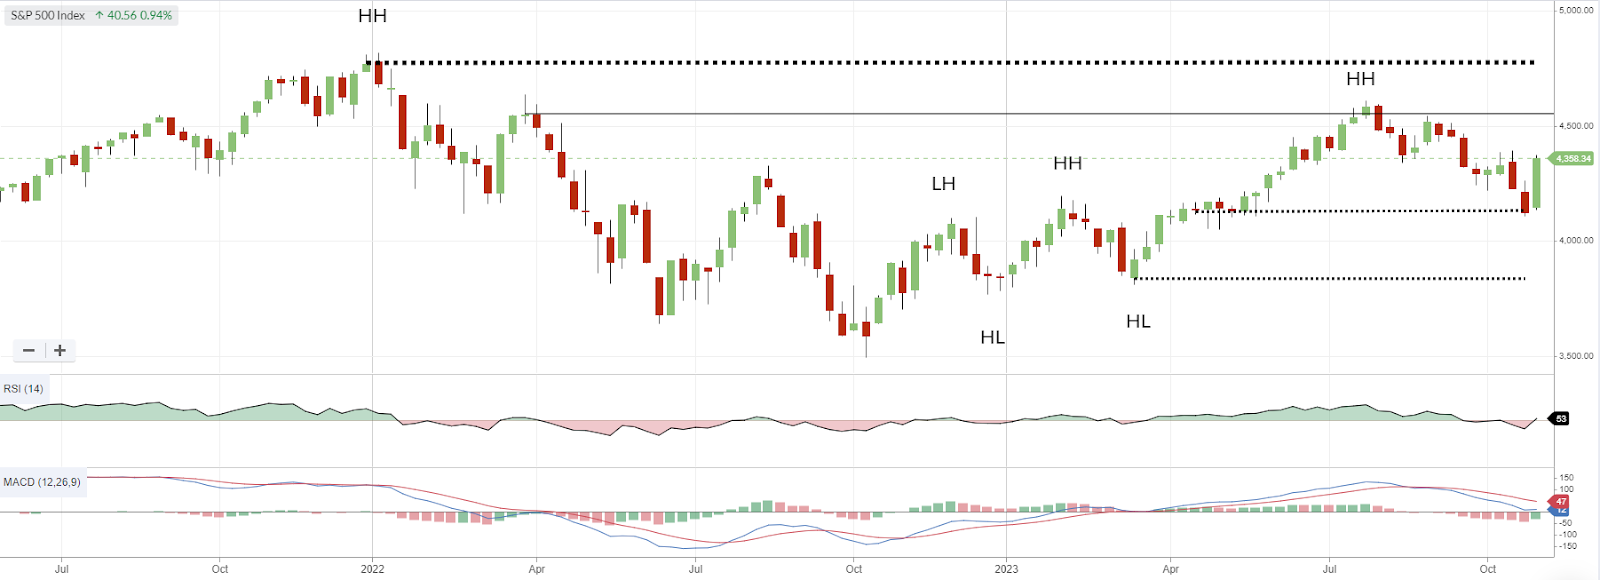
S&P500 Weekly chart
With the Fed keeping rates on hold and changing its tune regarding the strength of the economy the market popped. Further the jobs report showed less than expected jobs were created in the month of October, adding further weight to the idea of a pause for longer. The market lapped it up.
This also saw Bond yields fall heavily with the 10 year treasury yield falling to 4.57%. It was above 5% two weeks ago.
Also two weeks ago I mentioned, that if we didn’t have the shroud of uncertainty hanging over us, that the pull back looked orderly. Hopefully the market’s shield of invincibility can keep the pessimists at bay. I can dare to dream, and hope the recent higher high can be surpassed. For now I am happy where we are.
Last week’s action also saw improvements in the MACD and RSI. In the case of the later, it crossed back above 50. Not to be left behind, the MACD also had a positive week, though still in the negative territory.

So with a sigh of relief and a slightly more straightened back, we remain in equities globally, remaining vigilant to any possible future occurrence.
AUS S&P/ASX200
Last week after falling below our support range, we bounced back into it this week. We started weaker, which initially was quite worrying. But strength towards the end of the week lead by US moves resulted in a 2.2% gain for the five days. This has certainly made us feel a lot more chipper. ‘Hope’ has re-emerged that we are on the cusp of a rebound.

S&P/ASX200 Weekly chart
While I for one will cheer loudly if it occurs, we can’t let sentiment rule our head The level we want to see hold remains 6474. There is a good chance this could occur in the short-term given the week of positive sentiment from overseas. But one swallow doesn’t make a summer, so we still need to be alert.
All eyes will also be on the RBA this Tuesday as it hands down its rates decision. Following the one hold decisions by US, UK and Japan, unfortunately bets are rising locally that we will see one.
Last week we mentioned the slightly hotter than expected inflation rate. Unfortunately inflation is proving stickier than expected. Much of the supply side problems which hurt us over the past 12 months have eased…. Yet here we are, still rising. Odds are a rate rise will be coming. The question I think most are asking is will it be one more or two?
If the RBA are fair dinkum about returning to a range of 2% - 3% by 2025, its hard to see how one rate rise will be enough? No point worrying about it though. The chart will do the worrying for us and we just have to trade based on what it tells us.
So while we can remain exposed to stocks. Only look for a good setup. Messy charts are too hard to figure out right now without the general lift of the market. So be discerning
Member corner
In this section we will provide a detailed chart assessment, on a maximum of ten stocks weekly, on companies from those of you in the Gallery.
We welcome stock requests to be analysed from members. We will also be looking at the charts of some of the more actively researched stocks for the week. We will try to rotate through a selection so as to not make the charts stale. Hence why we welcome member suggestions to keep our list fresh. We will not be making up suggestions. If there are no changes to the most viewed list and/or there are no suggestions, then no stocks will be covered.
Also please note, that while we may receive a number more queries than can be covered, therefore we retain the right to save a stock for another week, or ignore it all together.
To learn of the methods used to analyse companies in this section, refer to my Momentum Journey series that I articulate here in three parts.
They will help provide context on what I am writing about and the editorial angle of this report.
And again, if you have a stock you would like analysed from a momentum perspective, please write it into the comments section below or email us at @stockopedia.com.au">support@stockopedia.com.au
ASX: MQG Macquarie Group
StockRank 66
Momentum Rank 89
QM Rank 71
VM Rank 79
A$ 163.24
Last week, many investors looked over Macquarie (ASX:MQG) following the release of its half year result.

Unfortunately the result showed a 39% drop in revenue and the dividend was cut from last year. Though to its credit the price held up well. (Fortunately for it, it was a good day on the market on Friday.)
We last spoke of MQG from a momentum perspective in January this year . At the time the price was looking ok, breaking out of a downward channel and crossing above $180. For the next 2 months it stayed above $180, however it subsequently failed and ultimately in October created a new lower low.
While Friday’s price action was pleasing, over the next few days the price needs to hold above $150. Otherwise we would have breached the previous long-term lower low set in September 2022. Positive is, if Friday’s move proves to be a turning point then the next target is $183.

At least you won't have to wait long to know if you are wrong. A stop loss at $150 from here would be appropriate should one enter the trade now. Allthis aside, long-term holders who pay little attention to charts understand that given the cyclical nature of MQG's earnings, it will have its moment in the sun again.
ASX:PRU Perseus Mining
StockRank 95
Momentum Rank 70
QM Rank 87
VM Rank 88
A$ 1.69
The ASX listed African Gold miner Perseus Mining (ASX:PRU) is another stock being keenly watched by members. Perhaps long serving Board member Sean Harvey deciding to step down as Chairman was the reason?

ASX:PRU 1 year Daily chart
Gold stocks have seen a good run to date on the back of record AUD Gold prices, even the USD Gold price is close to US$2000 per oz. However it doesn’t look like PRU has joined the party. One suspects it may have to do with the company’s exposed to the political quagmires of Cote d’ Ivorie, Sudan and Ghana and therefore there is a discount applied to its valuation. Therefore perhaps the moving on of Mr Harvey is significant as the links established are hard to rebuild?
Looking at the business and it is quite good. It’s sitting on a lot of cash, and while the company hasn’t said what they will do with it, either a buyback, special dividend or acquisition (possibly out of Africa) is on the table.
As for the price action, when last discussed from a Momentum perspective back in March we mentioned that at the time a stop of $1.99 with believers holding on to $1.88. Now at $1.68, that $1.88 is a resistance level that needs to be breached and held before it can be considered again. There are other gold stocks that represent easier trades at this stage.
That said, I caveat my comments as I did last time, that with stocks, anything can happen!
ASX:LAU Lindsay Australia
StockRank 99
Momentum Rank 93
QM Rank 98
VM Rank 97
A$ 1.01
Another recently reviewed company is Lindsay Australia (ASX:LAU). We last covered LAU in September, and the view hasn’t changed. Please read it here

Stocks in the Shine Zone
To learn about the Shine Zone and how to use it, you can read it here.
The rules for inclusion in this list are based on those I like to see in a stock before considering a trade in it:
QM Rank above 80
Price is above the 2.5x ATR
50d MA is above the 200d MA
Price is greater than the 200d MA
Market cap greater than $200M
This is a very important point: the “Shine Zone” are rules for possible buying. They are not for holding and/or selling. If a stock falls out of the shine zone, use support levels to set your stops, or instigate a parachute stop if necessary. With markets moving sideways, one expects frequent changes in these lists.
If you feel there is a stock that should be included but is missing please let us know. This is a manual process and occasionally one gets through the cracks
Data is at 04 November and is sorted by the stock code.
Changes from last week

Shine Zone list as at 04 November

“Bus pulling out of the station”
To learn more about this screen read the following article on the objective of the screen
Last week I spoke of why we are seeing more companies now than previously. Refer to the 30th October for more detail.
Please let us know any feedback
Data is at 04 November and is sorted by the stock code.
Changes from last week

“Pulling out of the station” on 04 November

52 week high screen
In this section we identify stocks within 5% of their 52 week intraday high based on the idea, supported by academic studies, that stocks close to their 52 week highs tend to outperform. Weekly changes to the list will also be noted.
If you wish to recreate this screen in the screener select "Price vs 52 high" greater than -5% and Mkt Cap greater than $200M
A stock coming onto the list is NOT an automatic buy, just as a stock that leaves the list is NOT an automatic sell. As with the shine list, assess every chart on its merits. However movements on this list may alert you to interesting charts so be sure to look at Stockopedia and the chart first.
Data is at 04 November and is sorted by the stocks closest to their 52 week intraday high.
And remember, past performance is no guarantee of future performance.
Changes from last week
Due to a processing error we could not compile the changes list. We apologise for any inconvenience.
Stocks within 5% of their 52 week high as at November 04, 2023

_____________
Important Information: Stockopedia Ltd ABN 39 757 874 670 UK business registration number 0637267 (“Stockopedia”) is an Authorised Representative of Daylight Financial Group Pty Ltd ABN 77 633 984 773 (“DFGPL”) which is the holder of an Australian Financial Services Licence (AFS Licence No. 521404).
Information in this commentary is current as at date prepared unless otherwise stated. However, please bear in mind that investments can go up or down in value, and that past performance is not a reliable indicator of future performance. For more Important Information please refer to the Disclaimer section of this website.
This communication may contain general financial product advice. It has been prepared without taking into account your personal circumstances, and you should therefore consider its appropriateness in light of your objectives, financial circumstances and needs before acting on it.
If our advice relates to the acquisition or possible acquisition of a particular financial product, you should obtain a copy of and consider the Product Disclosure Statement (PDS) before making any decision.
The author holds interests in companies listed in the data tables . This position can and will change at any time without notice.
Disclaimer
This is not financial advice. Our content is intended to be used and must be used for information and education purposes only. Please read our disclaimer and terms and conditions to understand our obligations.
1 comment
Wondering about AHX.
And what's with all the cash holdings of ASX?