Momentum Monday 08 July 2024

Welcome to Momentum Monday.
And so it begins again. The Annual Reporting season is soon upon us and we have been working with our data suppliers to improve the timeliness of the data you receive. In short, for large cap well covered stocks (the majority of what we all personally own) we expect to receive the financial data in the system within 12 hours. This also means that you should have updated StockRank scores within 24 hours based on the latest numbers.
This has involved a lot of work behind the scenes to get this done. Though we may appear as a duck on a pond to most of you, we are peddling like crazy underneath
Therefore, what better time to recommend Stockopedia to a friend, family member or colleague? Please see the link below for more detail on the large saving we have for them.
Interesting links
This week on Weekend Watchlist run in conjunction with Shares for Beginners. This week we cover a stock that flies under the radar of many but it's a big global oil player and one of our NAPs stocks for 2024. It is KAR Karoon Energy. . Listen here to the replay
Our quarterly review of the NAPS portfolio is now done. Compiled as an education tool, as a collective it has stacked up quite well. Read about it here.
The next edition in the Mastermind series will be Alan Hull of Actvest is on. Book your place here
Don't forget our next Friday Lunch 'n Learn session will be held this week. Click here to register your spot at the virtual table.
We issued to the general public two lessons of how Stockopedia forewarns and forearms investors. Both companies went broke last week. They are CAI Calidus Resources and BKG Booktopia. Read each article for more information. Avoid just one of these and Stockopedia pays itself for a lifetime.
Our “Empower Others” referral program has been updated and it offers the biggest discount we have available anywhere (Even better than the EOFY offer). To Learn read more here if you are interested in sharing this tool with other like minded investors. There is even a basics of investing email education series that either your friend, or yourself can sign up
For any external commentary we make to the broader market, follow us on Social Media Facebook Linkedin Instagram or X (formerly Twitter)
This week’s content is as follows:
Broader market sentiment
Member corner
Stocks in the “Shine Zone” (including changes)
52 week high screen (including changes)
A reminder that you don’t have to read all this contribution. Simply scroll to the area of interest. Also the Bus Pulling out of the Station section has been removed. Refer to last week’s edition to understand why.
Next week we will look to include a new table into the list. Stay tuned for more detail.
Broader Market Sentiment
We look at the direction of both the US and ASX markets to gain an understanding of the broader sentiment at the minute. It is important to stress here that I DO NOT use this to time my entry or exit out of stocks. I prefer to use the individual charts of stocks to do that. However I find it useful in helping us determine how aggressive/cautious traders should be in their trading. In short the more positive the broader market is the more risks you can take and vice versa.
US / S&P500
It was a shortened trading week in the US. They were lost half the day on their Wednesday time… and all day on Thursday for their Indepence Public Holiday. Notwithstanding the closures, the S&P500 rose to another record week closing at 5.567.19

S&P500 Weekly chart
It’s up for the fifth consecutive week. Given the tech run and their weighting in the index (as mentioned last week) It was unsurprising to see the reaction. Even for the negative weeks that it had the index hardly went down. To be frank, its pretty much been a straight line since mid April.
I hate to sound like a broken record, put one day someone will listen to me. Every up week brings us closer to the next down week. But the market has ignored me to date, so you might as well too.
All MACD and RSI indicators for now are acceptable as far as my chart goes. AS the market keeps going up,
From a news perspective there wasn’t much. There was confirmation on Friday that the economy was not overheating and therefore there could be the potential for further rate cuts in the future. I remind everyone that while rate cuts may come, the emergency rate levels we saw are not going to happen again (hopefully) and if anything they play more of a role with sentiment than actual benefit. This was confirmed when Chairman Powell gave a talk at an economic forum and said the Fed has made ‘quite a bit of progress’ on inflation but needs more confidence before cutting. Basically this is code for “the bias is down but rates are not in free fall.”
The UK Election landslide was a big news story, but on the economic front it will likely have little to no impact on us economically. Of slightly more impact is what is occurring in US politics and that just leaves everyone bemoaning the need for a respectable candidate. The French election, though possibly more fascinating than all three given developments over the weekend, even less so importance despite the CAC40 being amongst one of the worst performers in Europe.
It is important to remind everyone that I previously said my watch and act level was 4734. I still feel that is relevant. However it is a 15% drawdown from current levels and that may be too steep for some to stomach. That is why I offered the 4967 level for those particularly nervous. But here is the thing…. Another up week and I think I will be using that level as well. The pace of the recent run in the index has been strong and it would be remiss of me to ignore it. Also remembering that I am not trying to pick tops and bottoms. Rather I try to identify the chunky bits in between. In sum, at all time highs, we can’t get more aggressive than this.
AUS S&P/ASX200
Being left to our own devices in large part, plus a bounce in the price of Iron Ore price saw our benchmark, the S&P/ASX200 rise for the week.

S&P/ASX200 Weekly chart
It would appear that the prospect of rates staying higher for longer is a concept we seem to be getting used to. Though not the market it would appear has in effect been trading sideways The all time high for the index occurred in March this year. Anyway, at least it is out of that sideways channel so I have to be pleased with that (and I am). Anbd I would rather us here than an opposite scenario.
With reporting season on our doorstep we have seen a number of early updates come through from businesses and what they disclose should not be a surprise to anyone. Be it “the price of doing business is going up” through to “consumers are under financial stress”.
What I am saying is for you to maintain the confidence that all is well with your holdings, just ask yourself whether the businesses you own are exposed to cyclical factors. If they haven’t reported yet, just assume it will be on the side of negative therefore make decisions based on that. ESPECIALLY if it is supported by a price pullback. Listen to what the market is telling you. After all, you can always buy it back.
Of course, what I have mentioned above is not an issue for the price takers. This is because we physically see the prices of the commodity they deal in and can make a judgement based on that, More often than not the price of the stock, will reflect the move in the hard/soft commodity. It is also interesting to monitor that those who feel they will continue to exist through the cycle are making more noise recently. Therefore we continue to monitor their charts.
Looking back at the market chart and as I mentioned, while we are not atall time highs like the US, it would be a far stretched to be upset about what is going on (assuming you understand the dynamics of it all) The only fault on the index at the moment is the direction of the MACD where the faster moving average is below the slower one. And the MACD Histogram is negative at the minute. But the weekly RSI remains above 50, and what I see as key structural levels hold therefore I see no change to my previously stated sentiment or remaining aggressive for as long as the index stays above 7547 in the short term.
Member corner
In this section we will provide a detailed chart assessment, on a maximum of ten stocks weekly, on companies from those of you in the Gallery.
We welcome stock requests to be analysed from members. We will also be looking at the charts of some of the more actively researched stocks for the week. We will try to rotate through a selection so as to not make the charts stale, however we will likely not cover a stock within 2 months of when it was last discussed.
If you want to see what has been written about a stock recently, go to the discussion area.

We will not be making up suggestions. If there are no changes to the most viewed list and/or there are no suggestions from members, then no stocks will be covered.
To learn of the methods used to analyse companies in this section, refer to my Momentum Journey series that I articulate here in three parts.
They will help provide context on what I am writing about and the editorial angle of this report.
Also look at the market capitalisation and liquidity before making any decisions!
And again, if you have a stock you would like analysed from a momentum perspective, please write it into the comments section below or email us at support@stockopedia.com.au
IF NO ONE ASKS… HOW AM I SUPPOSED TO KNOW?!?
ASX:WHC Whitehaven Coal
StockRank 98
Momentum Rank 87
QM Rank 95
VM Rank 96
A$8.97
During the week I noticed that a stock I do like in Whitehaven Coal (ASX:WHC) had appeared in the most viewed list among Stockopedia members. It is a stock that has been looked at a number of times from a Momentum perspective. Most recently was here.

ASX:WHC 1 year Daily chart
Most recently I said, “But I will wait until the price gets above the short term higher high of $8.43 until I start looking at this again.” It got close in early June, and it has definitely done that now.
So what do I do from here? As a patient investor, I know prices zig and zag and I am glad this zag has been quite strong. However I expect the price to come back a bit. If it stays above $6.32 it will be in uptrend. So if the price pulls back to around $7.41 I will feel a lot more relieved and may consider a position at that point (given I like this business and I won’t ‘have to wait too long to know if I am wrong’.)
I have spoken at numerous lengths on how the met coal purchase of BHP’s Daunia and Blackwater projects were transformational, and I still believe that. The price has run recently on the China ‘hope’ trade as Iron Ore prices pick up (and therefore activity for Coal would also improve by extension).
I read a report that the use of Coal power increased quite a bit in the June quarter, recording its first year-on-year growth in almost a decade. This will likely be a reason for the rebound.
ASX:PPS Praemium
StockRank 92
Momentum Rank 88
QM Rank 94
VM Rank 84
A$0.505
A member has asked about Praemium (ASX:PPS) and it has never been discussed from a Momentum perspective. The stock was raised by a keen reader who noted the stock had entered a short term uptrend and that they would enter the Shine Zone this week given the 50 day average has crossed above the 200 day average.

ASX:PPS 1 year Daily chart
The fact both moving averages were heading the wrong way show you the depth of the correction in price of PPS. The big correction moment coming when it delivered a disappointing update at the AGM late last year. Since then the price has stabilised. The company has even released an updated set of numbers (that the StockRank is calculated on). Even news of a cyber breach within a recently acquired business from Iress has not been enough to halt its recovery. Therefore the question beckons, “what do we do now?”
Well the stock has created a new higher high and therefore is technically in a short-term uptrend. Assuming one takes a position based on the return to favour, defensive nature of recurring earnings and a more domestic focus. I would have an upside target of $0.615 (though I note the gap below that level as well. It will need to break this level to convince market participants that the disappointment of November 2023 is behind it.
I notice though it has a bit of work to do and there are a few key levels ahead of it. The next significant one above that that I see is $0.72 which coincides with the high inAugust last year.
On the down side, structurally over the short-term I see a solid level at $0.415 tha the price must hold. Given the drawdown from current levels are so high, perhaps a cross below the ATR 2.5x of $0.46 maybe appropriate and therefore any parachute stop loss level set at that point.
When I look at peers like Hub 24 and Net Wealth, despite the overall ranking, I see that it is cheaper than the other two incumbents which means it could be on the radar of a possible takeover. Though the ACCC will probably have a big say in that if it was one of its competitors that opened its wallet.
This is a good reminder that you can select “Compare with…” under the “Tools” section to compare it to peers.

For those wondering why the Momentum score is relatively strong given the 12 month performance, well over 6 ,pomths it hasn’t been that bad and analysts have at least kept their EPS view of the company steady. As a result, all the sums work out as they do.
Stocks in the Shine Zone
To learn about the Shine Zone and how to use it, you can read it here.
The rules for inclusion in this list are based on those I like to see in a stock before considering a trade in it:
QM Rank above 80
Price is above the 2.5x ATR
50d MA is above the 200d MA
Price is greater than the 200d MA
Market cap greater than $200M
This is a very important point: the “Shine Zone” are rules for possible buying. They are not for holding and/or selling. If a stock falls out of the shine zone, use support levels to set your stops, or instigate a parachute stop if necessary. With markets moving sideways, one expects frequent changes in these lists.
If you feel there is a stock that should be included but is missing please let us know. This is a manual process and occasionally one gets through the cracks
Also look at the market capitalisation and liquidity before making any decisions!
Data is at 06 July and is sorted by the stock code.
Changes from last week
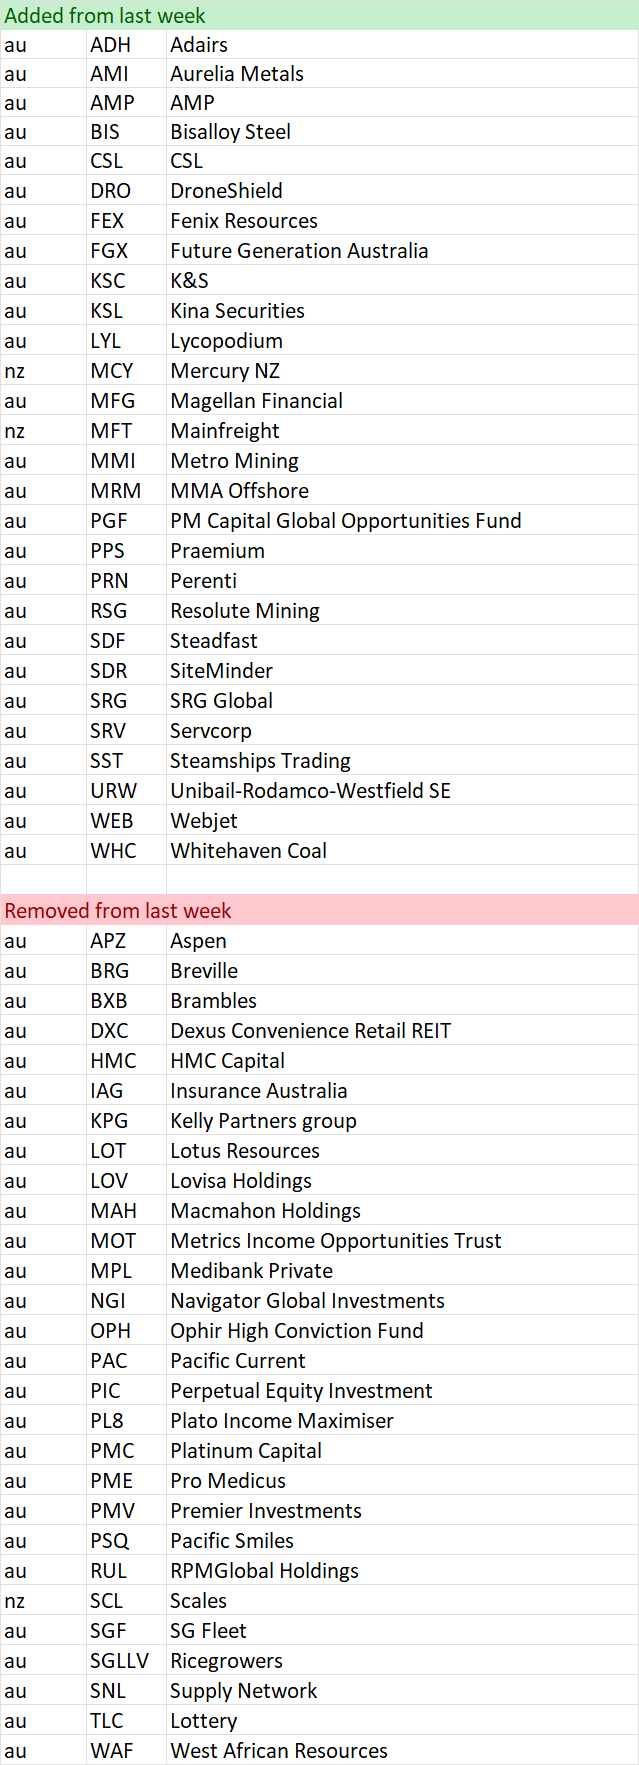
Shine Zone list as at 06 July

52 week high screen
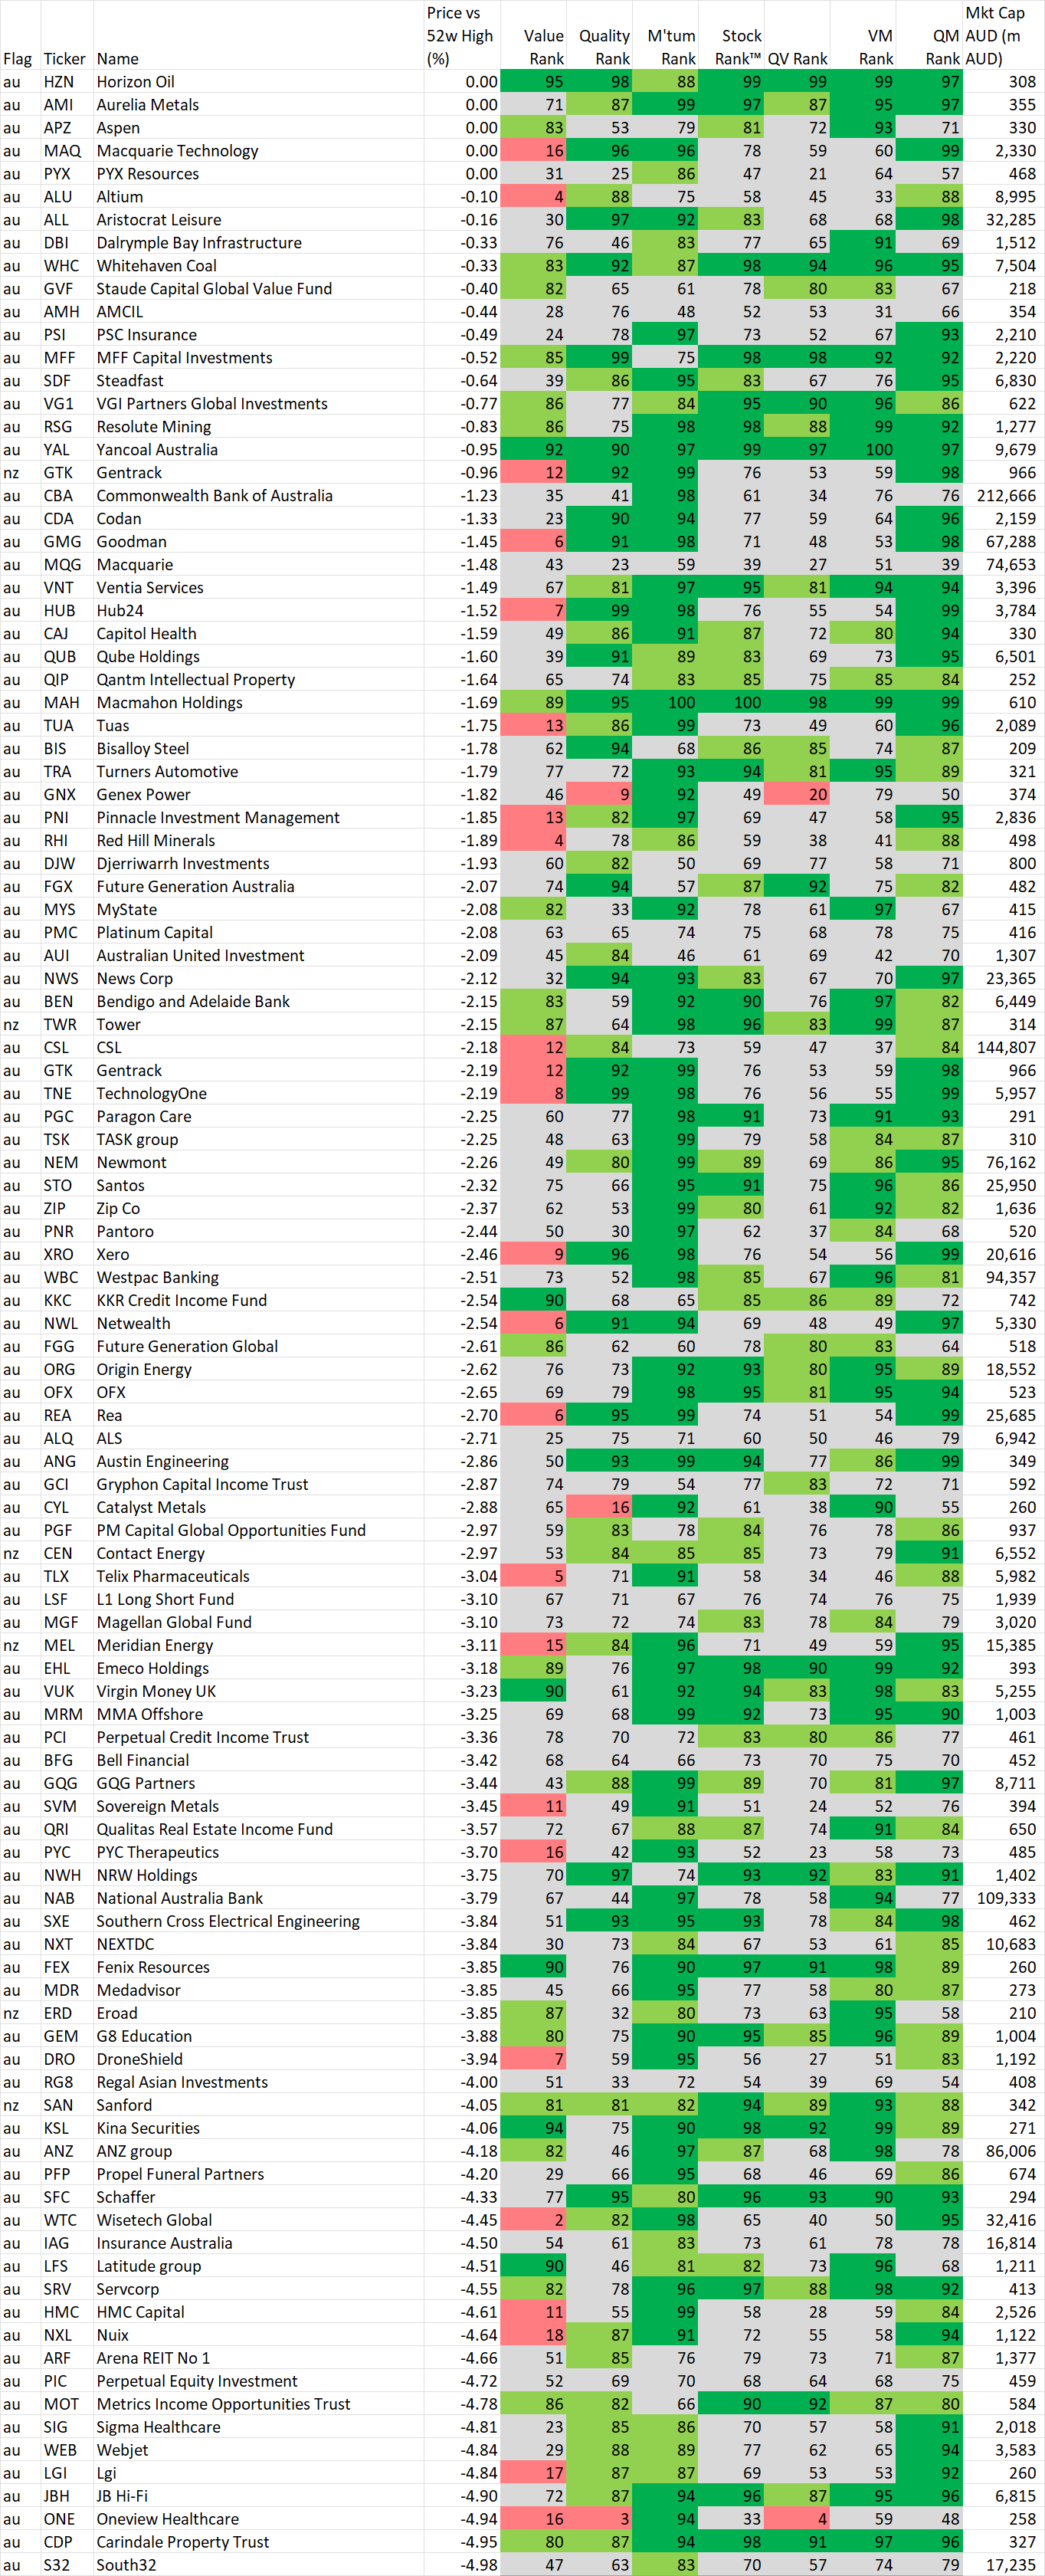
In this section we identify stocks within 5% of their 52 week intraday high based on the idea, supported by academic studies, that stocks close to their 52 week highs tend to outperform. Weekly changes to the list will also be noted.
If you wish to recreate this screen in the screener select "Price vs 52 high" greater than -5% and Mkt Cap greater than $200M
A stock coming onto the list is NOT an automatic buy, just as a stock that leaves the list is NOT an automatic sell. As with the shine list, assess every chart on its merits. However movements on this list may alert you to interesting charts so be sure to look at Stockopedia and the chart first.
Data is at 06 Jul and is sorted by the stocks closest to their 52 week intraday high.
Also look at the market capitalisation and liquidity before making any decisions!
And remember, past performance is no guarantee of future performance.
Changes from last week
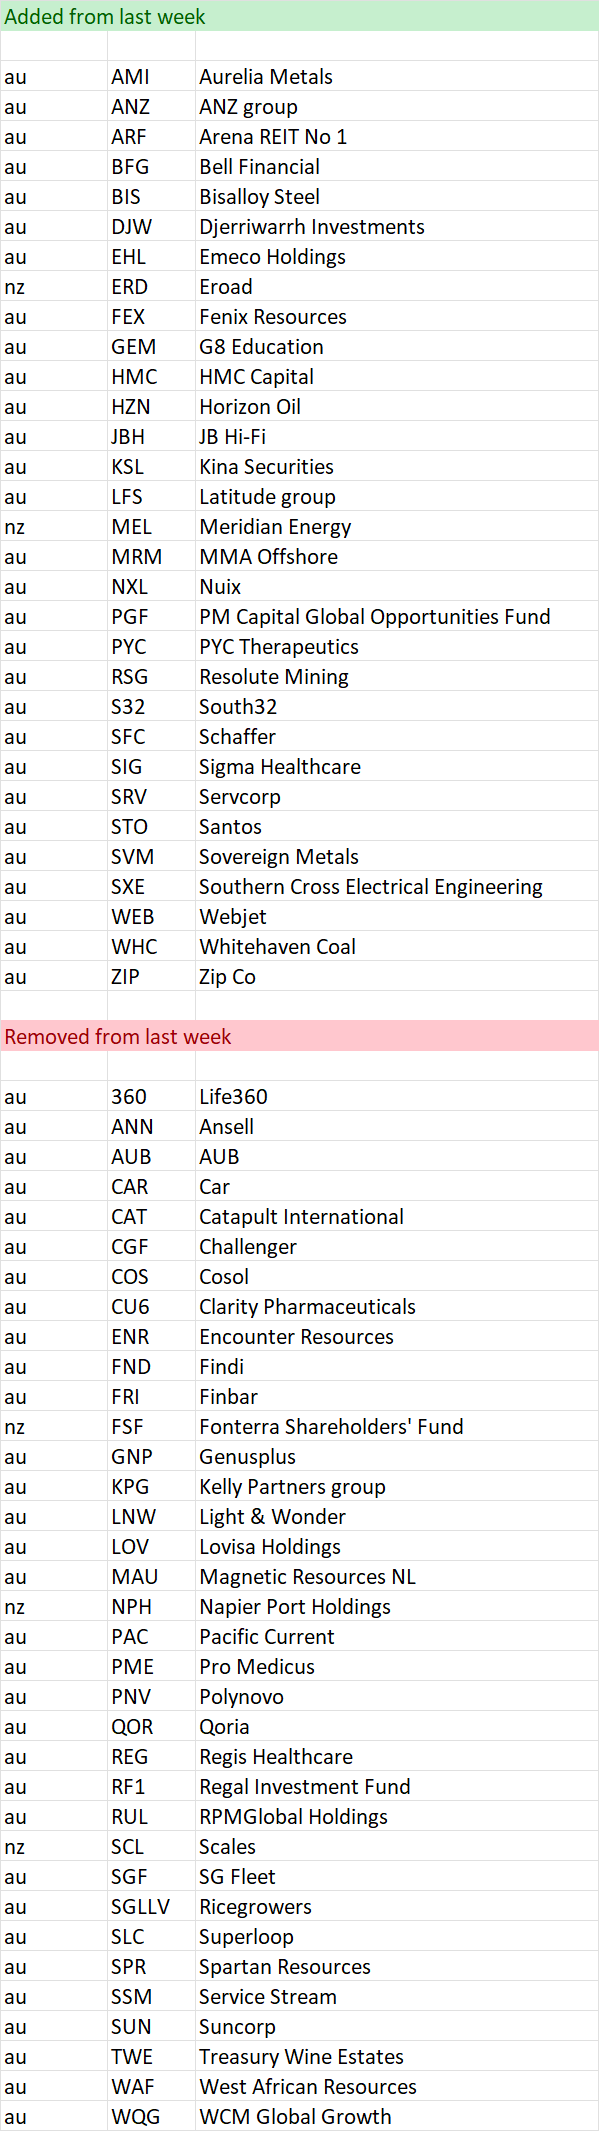
Stocks within 5% of their 52 week high as at 06 Jul
Important Information: Stockopedia Ltd ABN 39 757 874 670 UK business registration number 0637267 (“Stockopedia”) is an Authorised Representative of Daylight Financial Group Pty Ltd ABN 77 633 984 773 (“DFGPL”) which is the holder of an Australian Financial Services Licence (AFS Licence No. 521404).
Information in this commentary is current as at date prepared unless otherwise stated. However, please bear in mind that investments can go up or down in value, and that past performance is not a reliable indicator of future performance. For more Important Information please refer to the Disclaimer section of this website.
This communication may contain general financial product advice. It has been prepared without taking into account your personal circumstances, and you should therefore consider its appropriateness in light of your objectives, financial circumstances and needs before acting on it.
If our advice relates to the acquisition or possible acquisition of a particular financial product, you should obtain a copy of and consider the Product Disclosure Statement (PDS) before making any decision.
The author holds interests in companies listed in the data tables . This position can and will change at any time without notice.
Disclaimer
This is not financial advice. Our content is intended to be used and must be used for information and education purposes only. Please read our disclaimer and terms and conditions to understand our obligations.
1 comment
Hi Elio, please analyse NAB from a momentum aspect and if I can ask for 2, also WBC.