Momentum Monday 09 December 2024

Welcome to Momentum Monday.
Important note: I assume you have all read the recent newsletter that we sent you, and therefore I wish to confirm that this is the final Momentum Monday that I will be writing. While I sincerely hope that you all have found it personally enriching… (as I did), most importantly, I hope you have taken away lessons that will last a lifetime.
My journey articles will still be there for anyone interested in learning more of why I did, what I did and how I did it. So be sure to bookmark it to read if ever you are unsure. On behalf of myself, I want to thank you all that read this section religiously. I am looking forward to going through our charts one more time.
Don’t forget the final Lunch ‘n Learn session to be held on Friday. Be sure to book your place at the virtual table. Click here.
This week’s content is as follows:
Broader market sentiment
Member corner
Stocks in the “Shine Zone” (including changes)
Momentum Movers (weekly update)
52 week high screen (including changes)
A reminder that you don’t have to read all this contribution. Simply scroll to the area of interest.
Broader Market Sentiment
We look at the direction of both the US and ASX markets to gain an understanding of the broader sentiment at the minute. It is important to stress here that I DO NOT use this to time my entry or exit out of stocks. I prefer to use the individual charts of stocks to do that. However I find it useful in helping us determine how aggressive/cautious traders should be in their trading. In short the more positive the broader market is the more risks you can take and vice versa.
US / S&P500
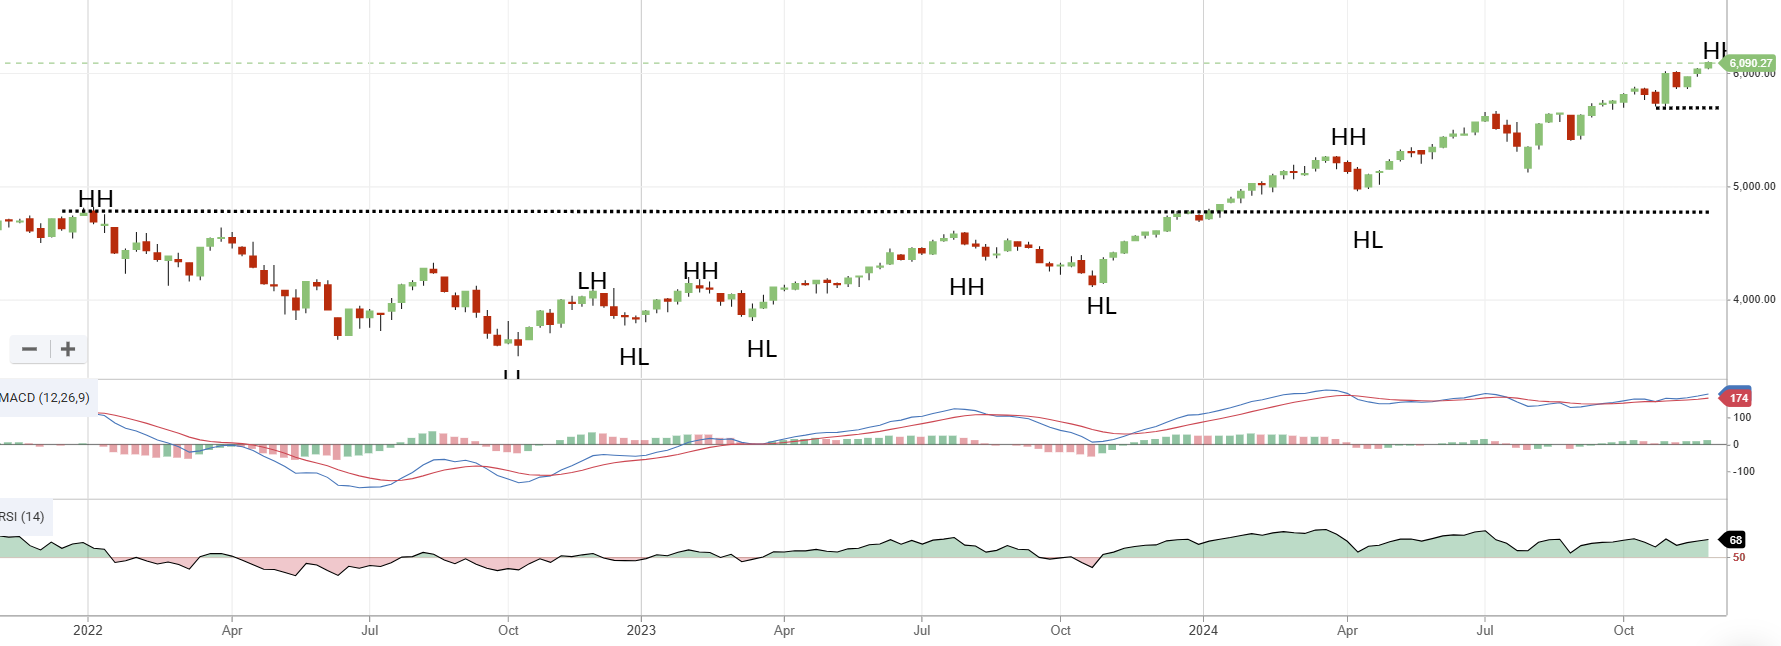
It seems fitting that for this last message, the broader S&P500 hit another all time weekly high!
S&P500 Weekly chart
I mean it’s hard to believe that with the looming threat of inflationary pressures, we are seeing the rally in the world’s largest market as we have. If anyone tells you that you shouldn’t be aggressive now, then they were probably the same that said it 12 months ago before this wonderful run. And in memory of a late professor that I knew well, the US should have gone broke decades ago. Yet here we are… all time record highs.

S&P500 3 month Weekly chart
So I apologise if this is repetitive, but I think it will serve you well as a Momentum Investor. “Think less, make more money!”
Speaking of thinking less, we saw Bitcoin cross the US$100,000 for the first time in its history. While I will continue to see it as a ponzy scheme, I can not deny that there are some that have made some real money from this, lots of it! The concept is also somewhat legitimised by the ETFs involved in Crypto. So again, I will “never say never”, just if you are going to have fun, do so with your eyes wide open.
Speaking of which, maybe I could advertise on TikTok? Even though an appeals court has upheld a law ordering China-based ByteDance to sell TikTok if it still wants to operate in the US. I suppose you can’t fix stupid so what would have been the point right?
Just like looking at Macro news. For those that have read this column in the past you will know my view. For those that haven’t, all I will say is often a narrative fits nicely into a price move, but rarely does it occur the other way around.
As promised last week, if the market went up then so would my “watch and act” level. So I will move it to 5705 which coincides with the market low at the end of October this year. For as long as the index stays above that I see absolutely no reason to revisit my investing thesis… basically that we are long and also are dancing in the streets.
AUS S&P/ASX200
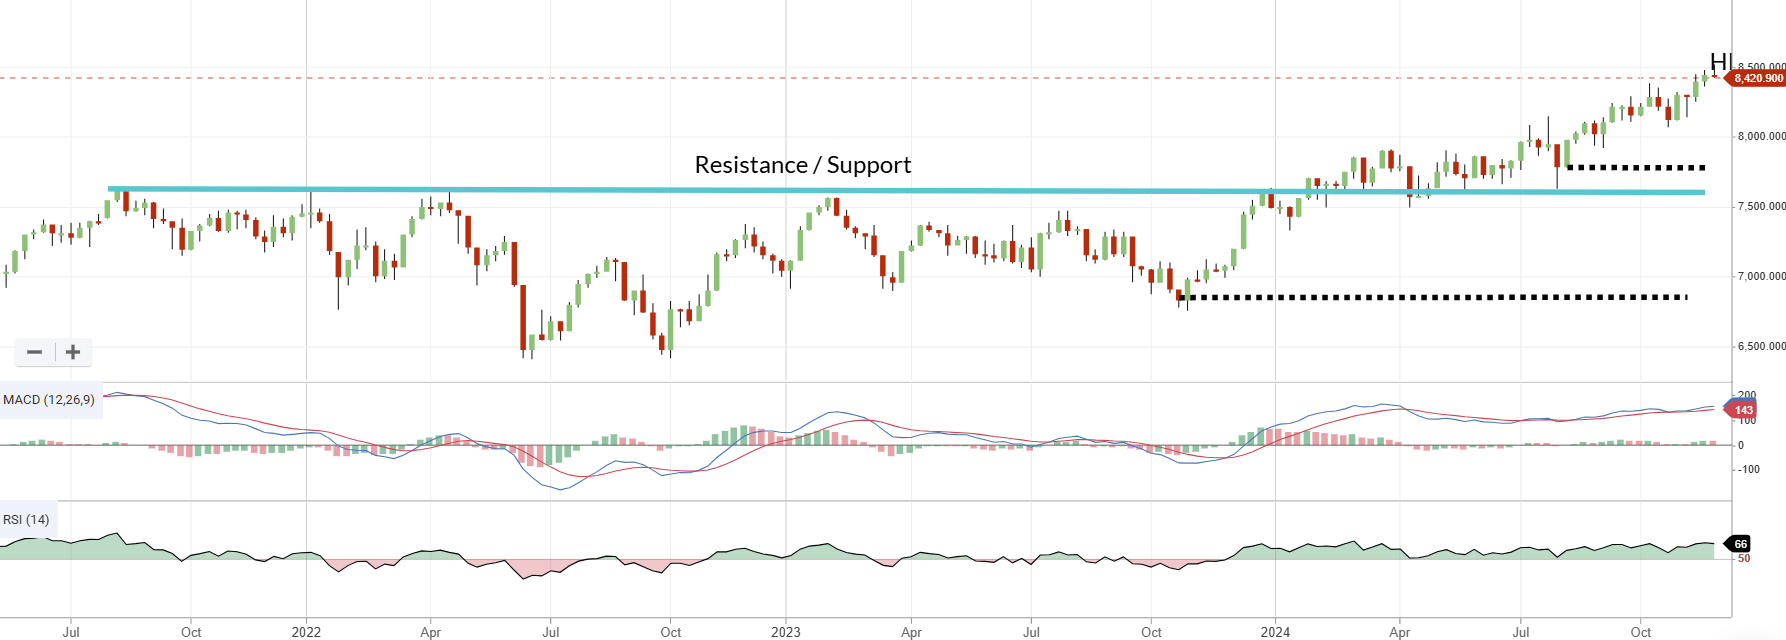
We were almost at an all-time weekly high for our market. But then some weakness in our largest continents (the banks) on Friday saw us actually finish down for the week. I think this will change by the end of this trading day.
S&P/ASX200 Weekly chart
When I started writing this piece we were in a sideways channel, and as I have said many times, Momentum Investors don’t mind when the market is going clearly up, or if the market is going clearly down. It’s when it goes Sideways that we get slaughtered. And so it was that I started writing a Momentum Article when the market was going sideways.
That said, there were always stories of interest if you looked deep enough. For example, the end of the Lithium boom, the gold and bitcoin run, industrials versus mining stocks, there was always a lot to observe and track.
I think if we have learnt anything over the past few years as DIY Investors is that there could be literally a thousand reasons why price might change. But whatever the reason is, it will always appear in the squiggly line.
I mean I look to the events of October 7, 2023 as a perfect example. I would eat my hat if oil prices wouldn’t have gone up. Yet here we are with oil prices down from that point in time. Further OPEC+ has just decided to extend their production curb for another 3 months. It’s insane.
But the chart has told me to steer clear of oil, and oil related stocks for sometime… so I have.
Just as a final reminder, I do not look at the market for trading signals. I only use it to determine how aggressive I am in the management of individual stocks.
If you haven’t been a member for long and you can’t figure out that the market trading at near all time weekly highs is bullish, then I worry. Because to me it only means one thing! To paraphrase, be aggressive and enjoy the ride the market gives us. This doesn’t happen all the time, but when it does you need to be in it to avoid it costing you when the market doesn’t do much.
I will leave you now by saying that my “watch and act” level for the market stays at 7800. I have no reason to change that for now. Truth be known I won’t turn completely bearish if it crosses below that level either. I will say that if the market keeps going higher then so will this number, vice versa will be the case as well. The thing you come to realise pretty quick as a Momentum investor is that the minute you think you’ve got it, you don’t. So stay vigilant, plan before an event occurs. And follow any rules you have with discipline. As I have always said, “It is rarely the strategy that hurts, rather it is the failure to adhere to the strategy with discipline that kills”. Go well!
Member corner
In this section we will provide a detailed chart assessment, on a maximum of ten stocks weekly, on companies from those of you in the Gallery.
We will also be looking at the charts of some of the more actively researched stocks for the week. We will try to rotate through a selection so as to not make the charts stale, however we will likely not cover a stock within 2 months of when it was last discussed.
If you want to see what has been written about a stock recently, go to the discussion area.

We will not be making up suggestions. If there are no changes to the most viewed list and/or there are no suggestions from members, then no stocks will be covered.
To learn of the methods used to analyse companies in this section, refer to my Momentum Journey series that I articulate here in three parts.
They will help provide context on what I am writing about and the editorial angle of this report.
Also look at the market capitalisation and liquidity before making any decisions!
ASX:SIG Sigma Healthcare
StockRank 64
Momentum Rank 95
QM Rank 83
VM Rank 71
A$2.88
A member has asked about Sigma Healthcare (ASX:SIG) and it was about a year ago when it was last covered from a Momentum perspective. You can read it here. It was just after the initial announcement of the reverse takeover of Chemist Warehouse that has now pretty much been approved.

ASX:SIG 1 year Daily chart
I said at the time that I would wait for a pullback after the spike. And sure enough, after the initial pop it pulled back to below a dollar. Now at $2.88 many investors may have wished they got in. Me? I slap my forehead for you.
Anyway… so the question is what now? It's obvious that a level of structural support is found at $2.27. On the upside the sky is the limit as a corporate action can often play havoc with price (I mentioned that a year ago too). On the surface the deal makes perfect sense and is a no brainer. Therefore I remain bullish on the stock.
ASX:GTK Gentrack Limited
StockRank 66
Momentum Rank 84
QM Rank 92
VM Rank 47
A$12.71
A member also asked about Gentrack (ASX:GTK) . I have decided to focus on the Australian listing as that is where many readers trade. Though it does have a New Zealand listing in Gentrack (ASX:GTK) as well.

ASX:GTK 1 year Daily chart
It's actually the first time we are covering it from a Momentum perspective. Readers will notice that the stock had been in a structural uptrend, until early November where the low was below the lower high in early August. This immediately put us on an exit footing, and I understand if you got out at the time.
For those that hung around for the “zig” (remember all prices “zig and zag” for the patient investor) then you were pleasantly surprised when they released their full year results on the 26th November and the share price popped. This rapid rise changed the trajectory of the price, and it has now created a new all time high.
So where to from here? In my view the price needs to hold $11.86 if you were lucky enough to hold it and lock in some short-term gains. Otherwise for as long as the price says above the November low we are fine. The problem is that it is a fair way down and you may not wish to wait that long, so $10.82 would be a level to watch. As for the upside target, the sky is the limit for a stock trading at close to all time highs. Though I would look for some volatility about the $14 dollar mark, but if it keeps delivering, it will break through this level too.
ASX:SGLLV Ricegrowers Limited
StockRank 99
Momentum Rank 88
QM Rank 96
VM Rank 98
A$10.21
Members looked at Ricegrowers (ASX:SGLLV) and as it was two months since we last reviewed this stock from a Momentum perspective, then we look at it again.

ASX:SGLLV 1 year Daily chart
As it is also an inclusion in the NAPS 2024 portfolio we have covered it significantly in the past from a Fundamental perspective.
When we last discussed this two months ago I said, “look for a clear break into record highs before considering the stock assuming it held the $8.15.” Well it did just that, and now it too is trading at record highs as troubles within many global rice growing areas buoys the price. Levels to watch from here? On the downside we see structural support at $9.04. Otherwise on the upside with the stock trading at close to all time highs it's smooth sailing ahead.
ASX:OCL Objective Corporation Limited
StockRank 68
Momentum Rank 85
QM Rank 96
VM Rank 43
A$17.98
It was unsurprising this week to see Objective (ASX:OCL) was commonly viewed by members given Chris had written about it fundamentally also. You can read his post here. From a Momentum perspective it was March 2023 since it was last covered.

ASX:OCL 1 year Daily chart
At that time I said the price was in a downtrend and that never changed. In fact it kept falling. Until it found its lowest low in late October of the same year. From then the price had bounced back and one could argue that from earlier this year, we were back in an uptrend. The price has obviously done well since then and investors will now ask, “what do I do now?” Well from the downside perspective there is structural support at about the $14 range. On the upside, I would look at the post COVID all time high at November 2021 as a level to take some profit lest we see a bit of volatility occur.
ASX:NST Northern Star Limited
StockRank 86
Momentum Rank 92
QM Rank 98
VM Rank 72
A$16.35
And now it is time to finish right where we started… Northern Star Resources (ASX:NST) which was last discussed from a Momentum perspective back in the very first edition on Momentum Monday about 2 years ago. A lot of water has passed under the bridge since then. And with Gold trading at levels not seen before, plus the AUD weakening, it becomes difficult to project a floor.

But members are looking at this because following the announcement of the all script offer for DeGrey mining the stock has gone down. (Coincidentally we last looked at DEG in the OCL edition of Momentum Monday and back then it was being looked at by members because Gold Road had taken a 19.9% interest in the business.)
I am not going to bore you to snores with details of the deal, other than to say it makes sense operationally and will in time be a value add to NST. But for now, I see structural support at $15.70. if it can’t hold that then I see a double top has formed and I think better buying could be had around $13.50. However, if it holds $15.70 then I would look for a cross back up above $17.90 before suggesting the trend had changed.
And that my friends is a wrap.
Stocks in the Shine Zone
To learn about the Shine Zone and how to use it, you can read it here.
The rules for inclusion in this list are based on those I like to see in a stock before considering a trade in it:
QM Rank above 80
Price is above the 2.5x ATR
50d MA is above the 200d MA
Price is greater than the 200d MA
Market cap greater than $200M
This is a very important point: the “Shine Zone” are rules for possible buying. They are not for holding and/or selling. If a stock falls out of the shine zone, use support levels to set your stops, or instigate a parachute stop if necessary. With markets moving sideways, one expects frequent changes in these lists.
If you feel there is a stock that should be included but is missing please let us know. This is a manual process and occasionally one gets through the cracks
Also look at the market capitalisation and liquidity before making any decisions!
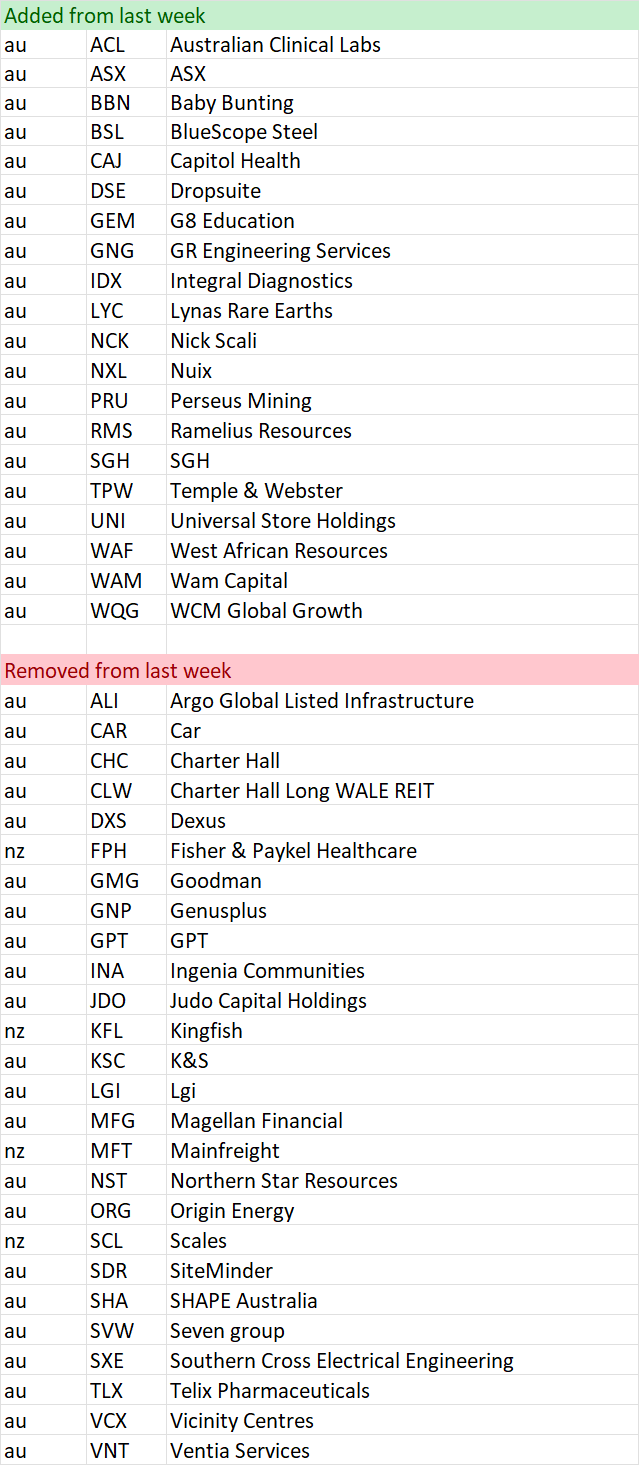
Data is at 07 December and is sorted by the stock code.
Changes from last week
Shine Zone list as at 07 December

Momentum Movers
I have actually published an article discussing my thinking with these tables. You can read about it here.
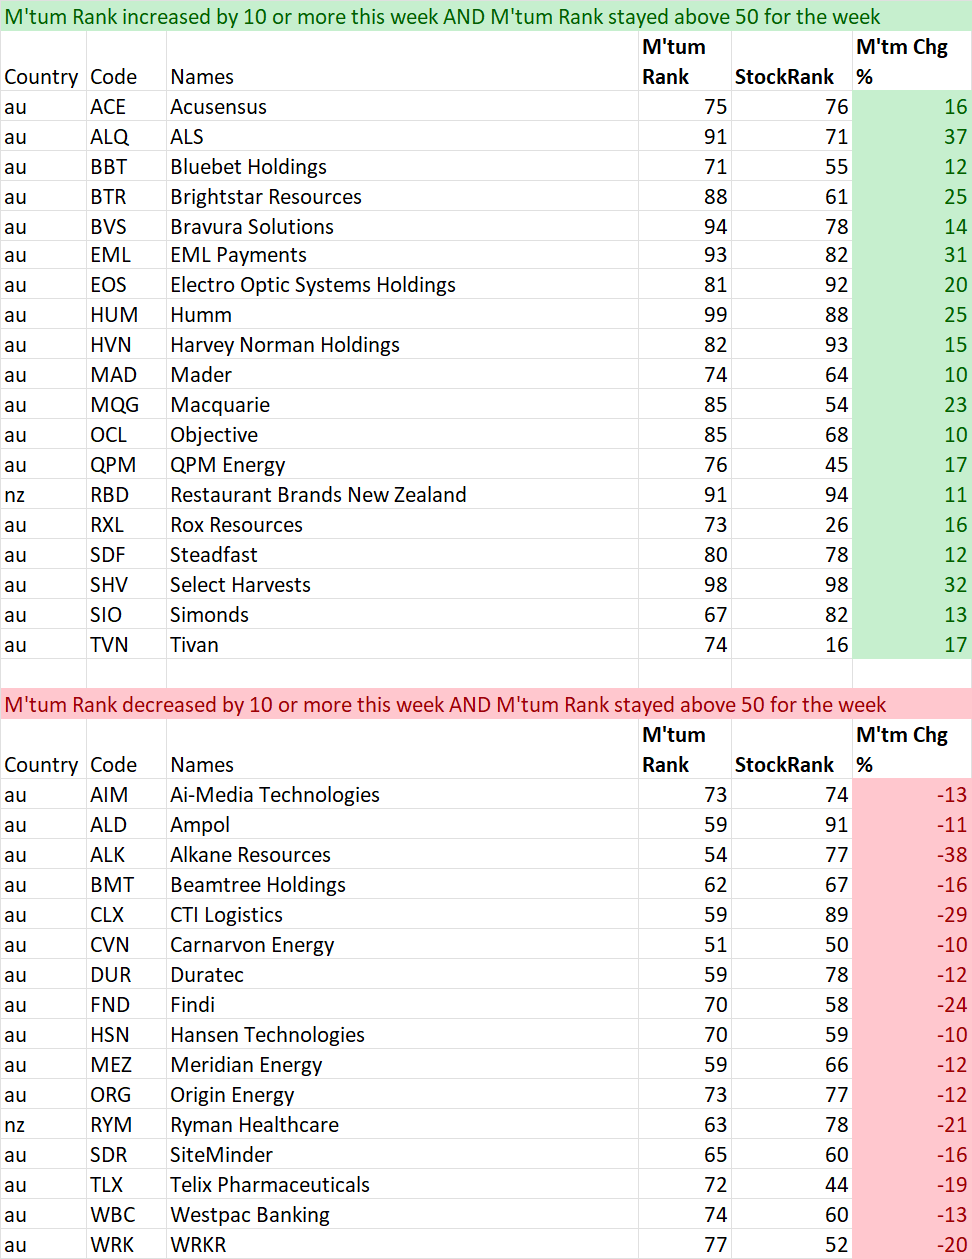
In summary, there is a school of thought that the change in something is just as important as the absolute number itself. Momentum is our most volatile ranking. This section is intended to bring to readers attention the big moves from a Momentum Perspective. As with other lists this is not designed to be a list of stocks that are replicated. Rather it can be a starting point of investigation for further consideration. Initially it will record weekly changes. This will include a monthly change when enough time has elapsed. This section is divided into two lists.
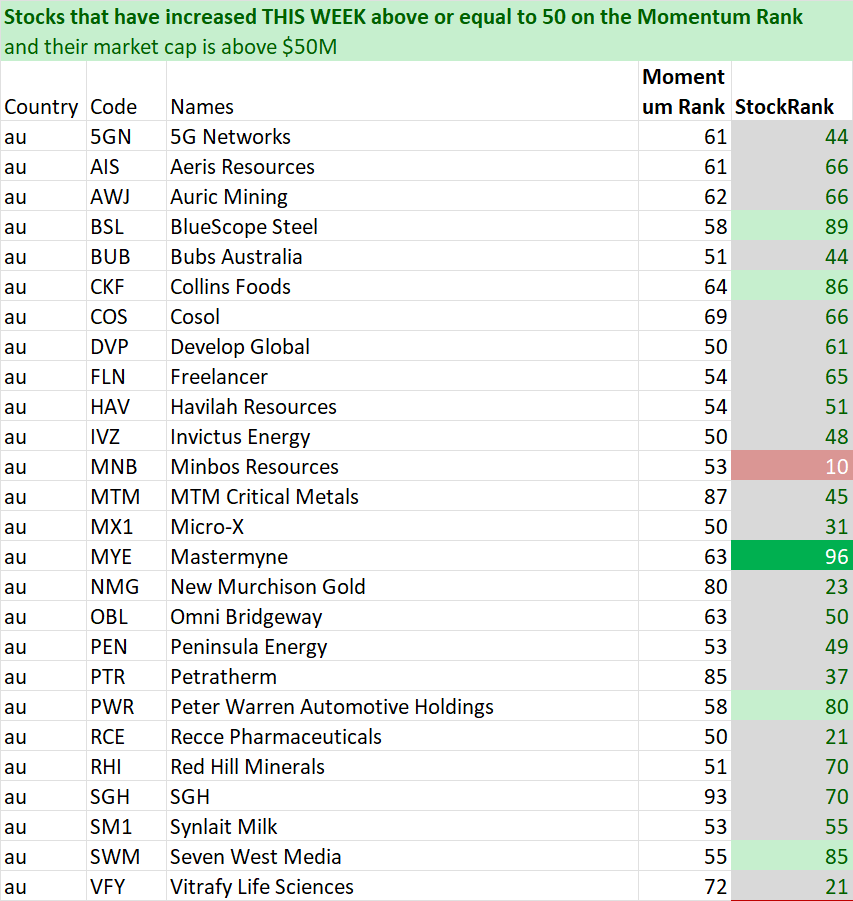
First is a list of stocks that have just crossed above 50 from a Momentum perspective. By definition, these will be stocks that have improved over the past week and month and may warrant further investigation. As a bare minimum a look at liquidity and market cap.
The second list measures all stocks that are currently ranked above 50, have remained above 50 during the time periods analysed (ie not just added or removed) AND whether they have improved or worsened by more than 10 points on the Momentum Rank.
With all filters a minimum market cap of $50 Mil has been included to help ensure investability from a small perspective. Be sure to check liquidity relative to your preferences.
Note: Some of the changes are due to the market cap now rising above $50M. Be sure to double check.
Data is on 07 December and is sorted by their code.
And remember, past performance is no guarantee of future performance.
Weekly Tables (the past week)
52 week high screen
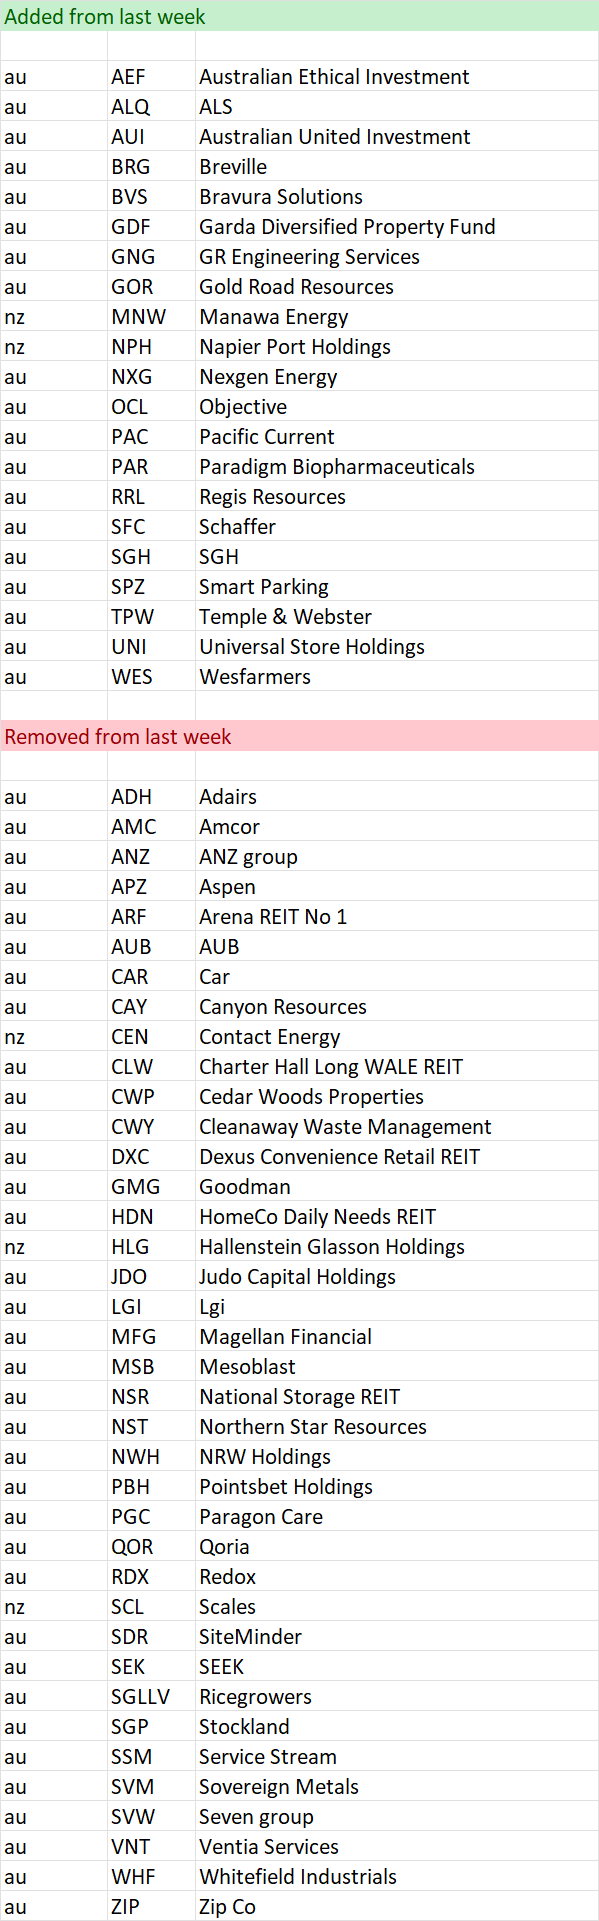
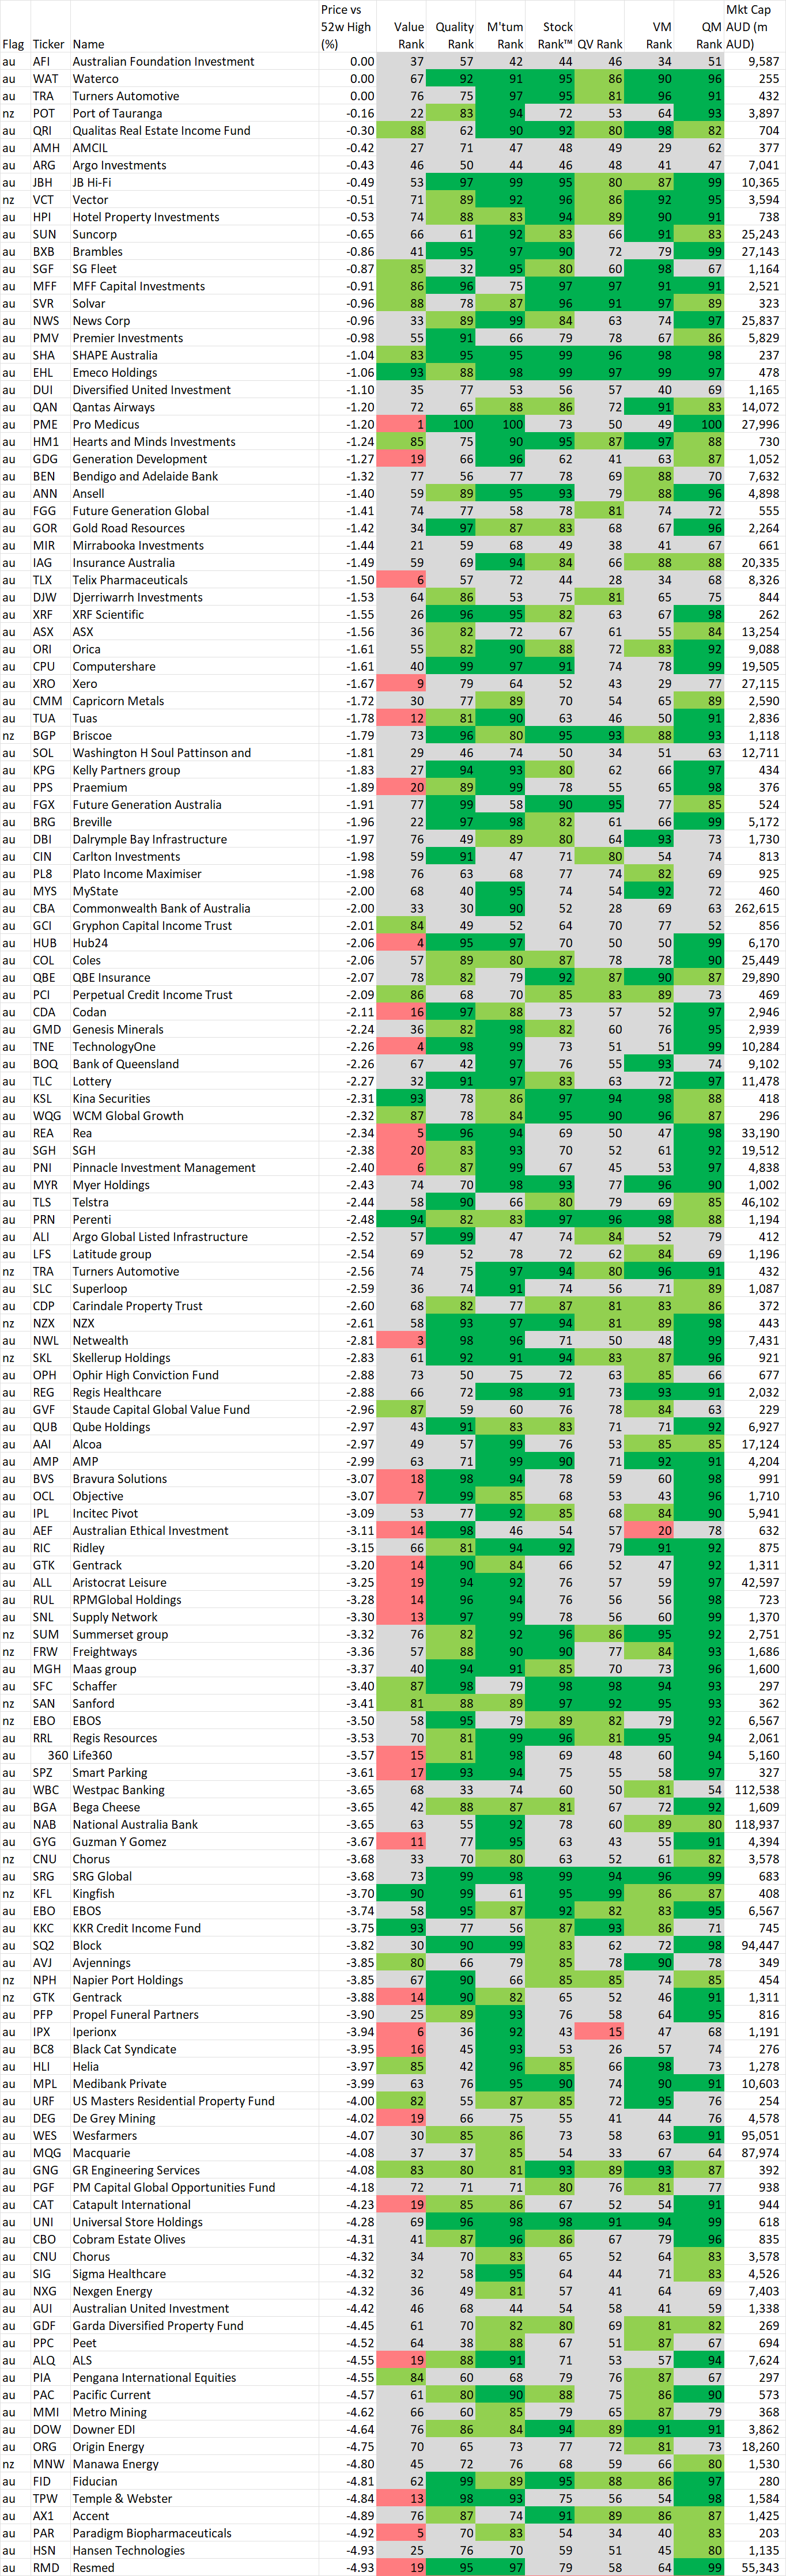
In this section we identify stocks within 5% of their 52 week intraday high based on the idea, supported by academic studies, that stocks close to their 52 week highs tend to outperform. Weekly changes to the list will also be noted.
If you wish to recreate this screen in the screener select "Price vs 52 high" greater than -5% and Mkt Cap greater than $200M
A stock coming onto the list is NOT an automatic buy, just as a stock that leaves the list is NOT an automatic sell. As with the shine list, assess every chart on its merits. However movements on this list may alert you to interesting charts so be sure to look at Stockopedia and the chart first.
Data is at 07 December and is sorted by the stocks closest to their 52 week intraday high.
Also look at the market capitalisation and liquidity before making any decisions!
And remember, past performance is no guarantee of future performance.
Changes from last week
Stocks within 5% of their 52 week high as at 07 December
Important Information: Stockopedia Ltd ABN 39 757 874 670 UK business registration number 0637267 (“Stockopedia”) is an Authorised Representative of Daylight Financial Group Pty Ltd ABN 77 633 984 773 (“DFGPL”) which is the holder of an Australian Financial Services Licence (AFS Licence No. 521404).
Information in this commentary is current as at date prepared unless otherwise stated. However, please bear in mind that investments can go up or down in value, and that past performance is not a reliable indicator of future performance. For more Important Information please refer to the Disclaimer section of this website.
This communication may contain general financial product advice. It has been prepared without taking into account your personal circumstances, and you should therefore consider its appropriateness in light of your objectives, financial circumstances and needs before acting on it.
If our advice relates to the acquisition or possible acquisition of a particular financial product, you should obtain a copy of and consider the Product Disclosure Statement (PDS) before making any decision.
The author holds direct interests in SIG, NST and companies listed in the data tables . This position can and will change at any time without notice.
Disclaimer
This is not financial advice. Our content is intended to be used and must be used for information and education purposes only. Please read our disclaimer and terms and conditions to understand our obligations.
3 comments
Elio,
Your weekly presentation of Momentum Monday was always well received by me,(a great start to each week) for the valuable insights and the cheeky sense of humor it sometimes brought. Great delivery always, whether by script or webinar.
Thank you Elio for your exceptionally perceptive insights over the last two years
Thank you for the support Julian... long may the market run... with the exception of the last two days of course :-)