Momentum Monday 09 January 2023

It was our first positive trading week in five on the market.
It was a quiet week market wise from both a volume and corporate news perspective. Most business leaders were still likely down on the Peninsula or watching rain fall at a Test Match. Expect things to start ramping up a little this week.
Me in particular, I will be keeping an eye on any sales updates from our retailers. I have long held the belief that the health of the Australian consumer is a key barometer for our market. It will be interesting to see whether being gainfully employed means they will continue to spend money as if they were teenagers, or whether we are starting to see some belt tightening as cost of living pressures start to bite.
Overseas I will be watching how China goes with its continued re-opening. Our largest trading partner has seen a wave of COVID infections hit the cities and it is likely to spread to rural communities over the coming month.How this looks for a country obsessed with “maintaining face” will be interesting.
Obviously from a market’s perspective the quicker our largest trading partner comes to terms with living with COVID the better (a little extra government stimulus would be the cream on the top).
Week ended 06 January 2023
S&P500
The US Market experienced its first positive week (though shortened) in five, and all of it was achieved on the Friday as we had been headed towards a fifth consecutive down week, particularly after the open on Friday.

S&P500 1 week, daily chart
But then on Friday, the December jobs report and an economic activity survey, showed signs that inflation may be cooling, signaling that the Federal Reserve’s interest rate hikes are having their intended effect.

S&P500 weekly chart
A focus for the last few weeks has been the 3700 - 3740 range. We also talked about the “Dragonfly Doji”of last week, so it was pleasing to see the market play out like it
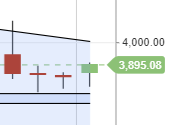
S&P500 4 weeks weekly chart
We are still not out of the woods, and with the market's willingness to keep testing the top end of the range suggests there is a lot of nervousness still abounding within the market.
However the hammer pattern last week (its called a hammer because it looks like one and can be a reversal pattern - want more info? Google it.) This weekly bar may mean (hope) we see continued momentum into the start of the new week. With US Futures up strongly at the time of writing it is a good sign.
Hopefully it will be enough to get itself out of the downward moving channel we’ve been stuck in. If the indices does that, it won’t immediately mean that we are in an uptrend, but it will provide some confidence that atleast the selling pressure is starting to ease.
S&P/ASX200
The past shortened trading week saw our first positive finish in five weeks, further highlighting the challenges of December on investors. But “a win is a win is a win” so investors will take the week as a sanctuary providing much respite from the shock and awe of the previous month

S&P/ASX200 Weekly chart
Of course looking at weekly charts on markets can be like watching paint dry. But that is the point. Getting caught up in daily moves when it comes to judging market sentiment is a mugs game. The minute you think it will go up, it goes down. No better evidenced by Friday’s move onthe ASX which was a positive day against the backdrop of a US down session the say prior.
One of the more interesting aspects this week was that during the week the index touched 6905, which is only 75 points away from the upper end of 6760 to 6830 range we have been looking out for.

It is a sincere wish that the price may find support around this level and bounces back up, as it would create a new higher low (HL), meaning an uptrend may be in the early stages of forming. But as I have mentioned a number of times, don’t trade on hope, and this market is volatile..
The RSI saw an improvement onthe week, however MACD continued to deteriorate which is a symptom of the use of moving averages within its calculation.

Last week I mentioned in the report that we were one week closer to an up week (zig) and this week past we saw a strong one happen. As I mentioned back then though it still doesn’t change the broader sentiment, and investors should be cognisant that even in a downtrend there are periods of reprieve as prices rarely move in a straight line north-east (or south-east for that matter).
Despite the strong week the ‘house’ view is maintained, and that is it's best to be patient and trade stocks only on the perfect set up.
Stocks of Interest
Author note: In line with the approach I am using with Stockopedia, I will focus the majority of my attention to stocks with a QM rating above 80 and market cap above $500M. To learn more please read the last instalment of my momentum journey here. I will discuss where their charts presently sit to provide context for potential and current investors.
These stocks are considered purely for the purposes of education. Be sure to read all relevant commentary to understand the context from which a chart is presented. It’s not always positive!
ASX:CUV Clinuvel Pharmaceuticals. QM Score 94. A$23.13
Its been a long while, but Clinuvel Pharmaceuticals (ASX:CUV) has gone through the pain of re-basing and appears ready for a run.

ASX:CUV 1 year daily chart
Last week saw the price break up above the previous lower high (LH) of $23.14 last reached in September last year.The price pull back to now what has become support and should see the price breach the next key level around $24.50. Should it be successful in scaling that level, then the next key target becomes ~$30.00.

ASX:CUV 2 year daily chart
This will be important for two reasons, not only is the next structural level of resistance, but it was also a resistance level between April and August 2021.
Therefore a break up the $30, would bring in the all time highs of $43.00 back into play.
While there is still a bit of work for the stock to do before that, the good news is the initial setup is looking positive.
ASX:BGL Bellevue Gold. QM score 86. A$1.30.
Gold has had is moment in the sun and that is likely to continue in the very short term as inflation concerns ease in the US.
Hang on! Isn’t gold an inflation hedge? That is when inflation expectations are high the price of gold rises, and vice versa.
The answer is, gold needs to be more viewed as a hedge against the US dollar.
We know that Gold is a store of value and is considered safe. Its allure has lasted centuries and it doesn’t corrode. In the same way the US dollar is seen as a store of wealth as the currency from the world’s largest economy is deemed safe.
I am not about to enter into an intellectual debate about this statement. This is the reality for the moment. Whether it is right or not, I will let the academics and those with a vested interest to worry about.
Lots of Gold stocks have therefore found their feet on the latest price gold run. One of those is Bellevue Gold (ASX:BGL)

ASX:BGL 1 year daily chart
Since finding support between September and October 2022, the price has experience a rapid recovery and is now in a short term up trend following a series oh higher highs (HH) and higher lows (HL)
One thing to not that the more rapid and vertical a price rise, the more careful we have to be. BGL has risen 100% in 2 months, so we need to ensure our stop losses are moved up higher, as using past structural support levels are not as effective in stocks that have aggressively broken out.
If a trader were keen to take a position here, a stop loss of $1.22 which coincides with the previous higher high may be prudent.
For those that held the stock all the way down, and subsequently have held it for the rebound, a more appropriate stop loss would be $1.13. Why so low? Because after rapid runs stock need some space to breath and the $1.13 coincides with the ATR level which has just turned positive on account of Fridays move.
Gold on Saturday morning was up so it will likely be a a good day Monday for Gold miners, just be cautious because the harder they rise…
ASX:PRN Perenti. QM score 96. A$1.29
Talk about stocks that have been through the wars, Perenti (ASX:PRN) once was listed on the boards at $4 back in April 2012, it then subsequently sank to 23.5 c in 2016.

ASX:PRN 13 year monthly chart
The African based mining services business, and its shareholders have endured a decade of pain, however hope springs eternal in 2023.
Looking at recent price action, the COVID lows were nearly tested twice. Once around June/July 2021 and then at the same time a year after.
Since then the price has rebounded strongly and on the back of heightened mining activity in Africa, and whilst still early in the piece the price seems to be lifting itself of the canvas.

ASX:PRN 1 year daily chart
It looks like the initial target of $1.56 will be hit.
How the company’s price reacts at this level will be important. This level was tested in Feb, Jun and Dec 20, and in Feb 2021. On each occasion the price failed to break through, so what happens at this level this time around will be key.
Traders will be hoping that a positive break above that resistance level will se smooth sailing to $2.35.
I know its tempting to consider an early position in PRN, however given its history patience will likely be rewarded and perhaps it can sit on a watchlist with that $1.56 level the next to watch.
ASX:GRR Grange Resources. QM score 88. A$0.92
Another sector which has experienced a rapid return to favour is the Iron Ore sector on the back of the China re-opening trade.
However in this instance, not all stocks have experienced a strong run up. Grange Resources (ASX:GRR) is an Iron Ore Pellet producer.
Following the disappointment of the interim result in August 2022 where the company chose to maintain a 2 cent dividend, when it has the cash capacity to pay more, the price fell heavily for the first two days. However since the price has remained relatively stable to this point.

ASX:GRR 1 year daily chart
The stock actually created a new mini-higher higher in December last year, and the price looks ready for another tilt at the $0.95 level.

ASX:GRR 4 month daily chart
A lot will have to go right to get the price back to $1.30 which would be the next target.
The continued rebound in iron ore prices is one thing, being able to keep a lid on costs will be another. And another major point will be a lifting of the annual dividend.
Last year it was 10 cents, however it is unlikely that will be replicated given the volatility in Iron Ore prices this year. But GRR is a cash generating machine and therefore income seeking investors who have maintained the faith will want a reward for their loyalty.
ASX:BHP BHP Group. QM score 95. A$47.51
We are yet to cover the largest stock on the ASX in Momentum Monday, so let’s put the spotlight on it as it too has a chart which is at an interesting point..
BHP (ASX:BHP) needs no introduction. After achieving an all time in July 2021, the price has acted like a fly bouncing off a window, with the price retesting those levels no less than 4 times since

ASX:BHP 2 year daily chart.
So why does BHP this time have a fair chance of breaking through resistance?
Besides all the macro factors that everyone is aware of. The chart for the past 12 months highlights one key interesting thing. The pullback in May was a lot more severe than the pullback in December.
Therefore the price has had to expend far less fuel to get backto these levels offering a good chance for momentum to keep supporting the stocks to higher levels.
For interests sake that resistance level is at $47.50 - $47.60. A sustained break above that level will be quite bullish for the stock.

AS:BHP BHP Group 1 year daily chart
ASX:SGM Sims Group. QM 84. A$14.02
Another beneficiary of Iron Ore’s resurgence has been the price of scrap metal.
Scrap metal is a cheaper alternative to steel. When iron ore prices rise, so too does the cost of making steel, thus making scrap metal more attractive as an alternative. This is of course the opposite when prices move the wrong way (ie Iron Ore prices fall) which is why Sims (ASX:SGM) our largest scrap metal provider listed on the ASX had such a rough 2022.

ASX:SGM 1 year daily chart
This relationship exists because when iron ore prices fall, the price of scrap does the same as companies are less incentivised to downgrade to recycled metal.
Though SGM is obviously linked to this cycle, the price of the stock has yet to bounce hard as it also has a non-ferrous scrap division (non ferrous metal is metal that does not contain iron)
Further the company decreased its earnings expectations as “lower scrap volumes resulting from significantly reduced economic activity, coupled with increased competition for available infeed, has tightened trading margins in both percentage and dollar per tonne terms.” This update was provided at the AGM in November so the market has had some time to digest the news.
Which brings us to today and we are starting to see some signs of life, with the price ending the week on a new very short-term high, breaking above the previous lower high (LH).

ASX:SGM 7 weeks daily chart
While it is still very early days in any recovery, this price action is a sign that price may be finding its feet and that should they deliver a report in line with expectations at their half year, then we are starting to see the origins of a turn around.
NZE: SPK Spark New Zealand. QM score 99. NZ$5.37
Spark New Zealand (NZE:SPK) the NZ Telco carrier has been the envy of many a frustrated Telstra shareholder for quite sometime, making a string of shrewd decisions which has maintained its relevance in a changing operating landscape.

NZE:SPK 1 year daily chart
The company is fast approaching its all time high, achieved in September 2022, which normally would normally likely be a resistance level, however the current moment, both in price and analyst expectations.
The only thing to note is that the recent run up has not quite been supported by a similar rise in the OBV which insinuates that while the price is going up, there are no real big chunks of capital going into the business (ie less conviction). Howeve,r given the time of year, one may excuse this result. Thought is still worth keeping an eye on.

Note: There is an Australian Listing for SPK, though it closely tracks what the NZ price does (plus or minus currency impacts)
ASX:TLC Lottery Corporation. QM score 82. A$4.63
Lottery (ASX:TLC) saw a rapid recovery toward the end of last calendar as it was announced a number of mega jackpots to celebrate end of year festivities. This was hot on the heels of the biggest Powerball jackpot in history, the $160 Million division one price in October.
Gambling stocks are traditionally seen as defensive during economic uncertainty, however since the split of from Tabcorp the stock has not done much price wise and is pretty much right back where it started..

ASX:TLC Since re-listing daily chart
Though the price hasn’t moved much, it can at times be volatile. The recent run for example may have tempt traders into the business but the breakout in December 2022 ended up being false move.

The key levels to watch here are $4.81 to the upside and $4.47 on the downside. Breaks either side of those levels will likely govern the next short term direction of the stock.
This will be important s the stock looks a little directionless at the moment.
This is why buying at support can be an effective tool for a trader who has the patience to wait and not rush a trade.
ASX:SMR Stanmore Resources limited. QM score 93. A$3.17
A company that is often forgotten when coal stocks are discussed is Stanmore Resources (ASX:SMR) . Stanmore are Queensland based Metallurgical (Met) coal miner who finished the week at all time highs.
Its transformational acquisition of the 80% interest in BHP Mitsui Coal (BMC) Pty Ltd makes them now the seventh largest producer in the world. To fund much of the acquisition the company took on a bit of debt, but the amount of cash it is producing now means it is not an issue. The fact it is involved in the less volatile Met Coal is also a bonus.

SMR 1 year daily chart
The Queensland government's introduction of more layers of royalty payment initially caused the price to fall 15% in a day. But the price has rebounded and then some. Paying higher taxes is never good, but paying taxes (making money) is better than the alternative (losing money).
What is interesting to see from a chart perspective is that the previous resistance of $2.44 ultimately became support once the price crossed above it in October 2022. While you would notuse that support line as a stop loss from here if you purchased on Friday, it gives a very strong visual as to when sentiment will change.
ASX:PLS Pilbara Minerals QM rank 91. A$3.96
The story of 2022 was Lithium for all the good reasons. Will Lithium stay in the headlines in 2023, but for all the wrong reasons? Looming extra global supply coming on line has many thinking that the boom times for Lithium are close to being over.
Pilbara Minerals (ASX:PLS) has been a bellwether for the entire sector’s health enjoying extraordinary gains over the past few years,
In the last few months however it, and many of its peers in the industry have started to see price turn the other way.

ASX:PLS 1 year daily chart
These comments are probably more pertinent for those that have recently got into stocks like PLS, rather than those who have multi-year holdings where the gains are still very large.
The chart has a number of worrying signs, beside the price falling below the ATR and the 50 day exponential moving average (EMA) heading south and moving closer to the 200 day EMA, on the 15th December 2022 the stock officially entered a downtrend when it crossed below the previous higher low in late November.
That level of $4.37 has turned from a point of support (not only was it tested in November but also in September and October), to now become a new level of resistance. PLS is now officially in a downtrend.
It is looking increasingly clear that the boom times may be easing for Lithium (though the demand for lithium will remain - it is fair to say the easy money has been made). Therefore investors should be cautious now in assuming that prices will only keep going up and for those that have only just entered the sector - tread wearily.
Any suggestions?
If there is any company you would like to see written about? Do you have feedback on this contribution? It would be most welcome as we want to ensure that you receive editorial content that is most relevant to your investing.
Please feel free to write any comments below.
While we guarantee that all feedback will be read and digested, there is no guarantee that we will accept them. Though we do have an open mind at the minute.
________________________________
Important Information: Stockopedia Ltd ABN 39 757 874 670 UK business registration number 0637267 (“Stockopedia”) is an Authorised Representative of Daylight Financial Group Pty Ltd ABN 77 633 984 773 (“DFGPL”) which is the holder of an Australian Financial Services Licence (AFS Licence No. 521404).
Information in this commentary is current as at date prepared unless otherwise stated. However, please bear in mind that investments can go up or down in value, and that past performance is not a reliable indicator of future performance. For more Important Information please refer to the Disclaimer section of this website.
This communication may contain general financial product advice. It has been prepared without taking into account your personal circumstances, and you should therefore consider its appropriateness in light of your objectives, financial circumstances and needs before acting on it.
If our advice relates to the acquisition or possible acquisition of a particular financial product, you should obtain a copy of and consider the Product Disclosure Statement (PDS) before making any decision.
The author holds interests in the following stocks mentioned in this article: BHP, PLS. This position can and will change at any time without notice.
Disclaimer
This is not financial advice. Our content is intended to be used and must be used for information and education purposes only. Please read our disclaimer and terms and conditions to understand our obligations.
2 comments
Hi Elio, really enjoying your contributions, I think the way these articles are being written is almost perfect, well especially for the way I go about investing. The only thing I would like to see is if maybe in the articles you could explain was there anything in the stock ranking score that caught your attention in looking at these stocks. Maybe something for us learning that you saw when deep diving that we could learn from, or was it just the overall score. Apart from that, great work, much appreciated.
Thanks for the feedback Anthony09 . This contribution is more focused on momentum indicators and it will no doubt evolve. We are always looking at ways to improve things but fore now our process is, if it has a Quality Momentum rank above 80 then those are the stocks we will consider for this section. How ranks move and what it means from an educations perspective is something we can consider as well.
But for now, thanks for the support and we look forward to sharing our development and improvements with everyone in the future.