Momentum Monday 11th November 2024

Welcome to Momentum Monday.
It’s finally over. The US elections which occupied so much of our media focus is now behind us though there will be repercussions over the coming months. Hence why we need to stay on top of our investments moving forward.
Now is a good time to remind you to read the blurbs at the start of each section. While they may give the impression of a copy and paste, they need to be read and understood in order to ensure the transparency in which they are given. There is no rocket science, no hidden agenda. It's all out there so be sure to read (or re-read) those bits to ensure each section is understood.
Interesting links
Shares for Beginners this week looks at a stock I have analysed from long time back. It is AUB: AUB Group Click here to be taken to the link of the recording.
“Empower Others” and share Stockopedia with your friends, colleagues and family members. It is simply our best ever rate. If you think there is someone who will benefit from this offer, please reach out and we will send you the link
We had a technical glitch with Friday’s Lunch ‘n Learn session. We hope to have it up and running next week.
For any external commentary we make to the broader market, follow us on Social Media Facebook Linkedin Instagram or X (formerly Twitter) Some of you already have so ‘Thank You’ for that.
If you haven’t already signed up to Podbean or your favourite streaming channel to receive our morning ASX market reports. (Assuming you know what I even mean)… Click here to signup for it - Signing up for Podbean is the quickest way you will get it.
This week’s content is as follows:
Broader market sentiment
Member corner
Stocks in the “Shine Zone” (including changes)
Momentum Movers (weekly only)
52 week high screen (including changes)
A reminder that you don’t have to read all this contribution. Simply scroll to the area of interest.
Broader Market Sentiment
We look at the direction of both the US and ASX markets to gain an understanding of the broader sentiment at the minute. It is important to stress here that I DO NOT use this to time my entry or exit out of stocks. I prefer to use the individual charts of stocks to do that. However I find it useful in helping us determine how aggressive/cautious traders should be in their trading. In short the more positive the broader market is the more risks you can take and vice versa.
US / S&P500
Well during the week the market hit all time new highs, so globally we have to be bullish on equities. With the S&P500 topping 6,000 in the first time in its history and the Dow rising 44.000 also hitting that mark for the first time. Dare I say it, sentiment is fantastic!
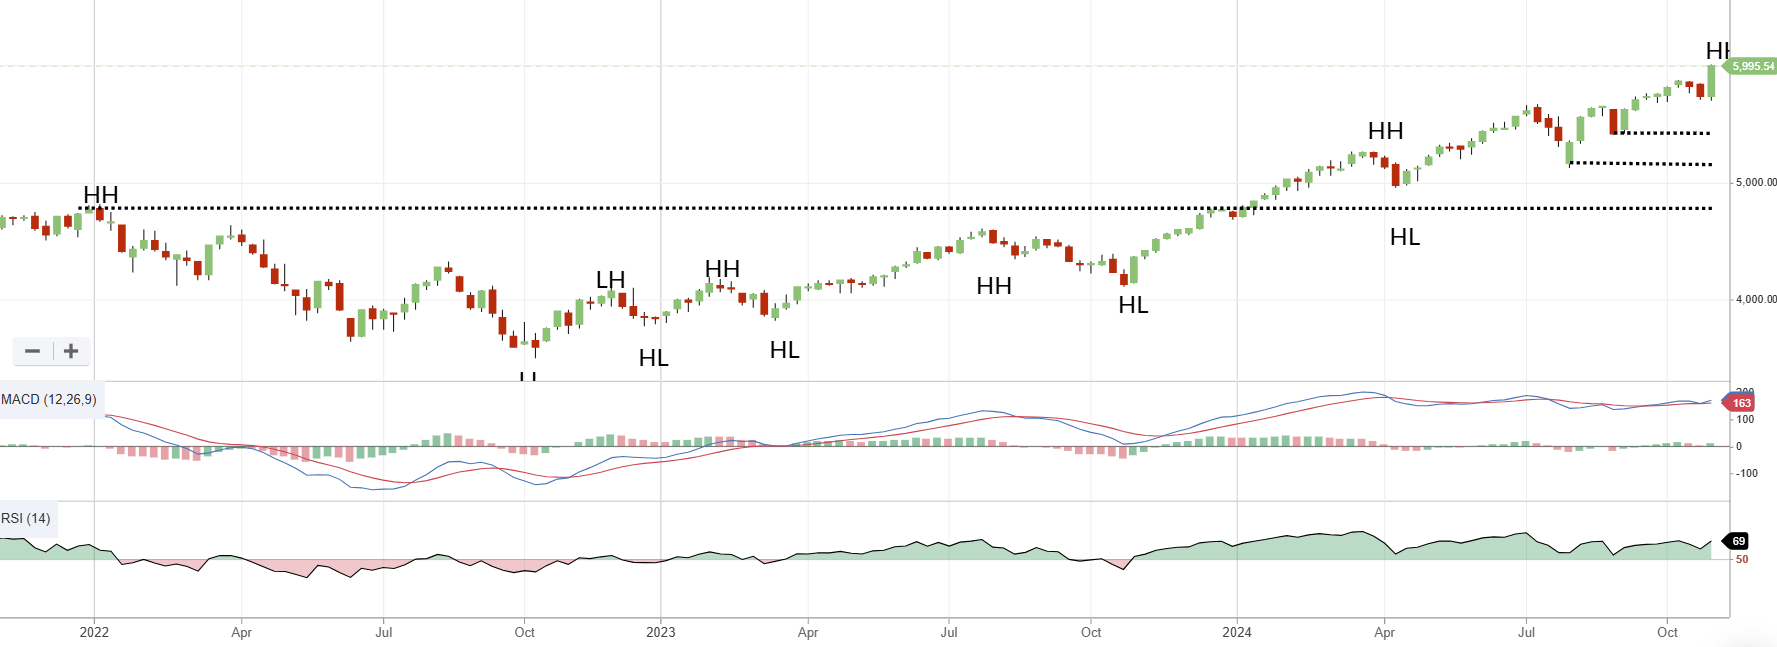
S&P500 Weekly chart
With S&P500 and all other indices rising very strongly for the week positivity definitely abounds. Of course much of the positive sentiment came about because of Donald Trump being declared the victor of the US Election campaign, and with a majority in the Senate and is leading in the House of Representatives, we believe there will be little to halt his and the Party’s agenda.
No doubt as promised it will see a lot of protectionist tactics and change in tact on a number of other policies. What is unknown however is the inflationary impact this may have and what it means for the broader economy. Of course there is a lot to play out over the coming months and years so there is no need to predict anything just yet.
You would have noticed that I have deliberately remained quiet on policies and what they might mean for specific industries. This is in fact deliberate. For this piece we give away the idea of trying to predict the future, rather we focus on where the index line is going. And it has been at record highs now, and in the months leading up to this point, so from an investment and stock watching perspective it has made no difference who was in the top position. Of course the impact could be quite stark for specific sectors, though there is little point in trying to predict what will happen. Simply trade where the wind blows and you will be fine.
If you want to learn a bit more about the US election and what it may mean for your investments there was an excellent article written by Megan Boxhall that you can read here if you are interested. For the purposes of this piece though. I will stay with sentiment as much as I can. Including Bitcoin which $80,000 for the first time. This is a true sentiment bellwether.
It was interesting, though expected, to see the Federal Reserve cut their desired rate range by another 25 basis points. This comes following the 50 basis point cut back at their last meeting in September. What I found interesting was the comments that future rate cuts are expected to slow down (or be non-existent) moving forward. Again a timely reminder to everyone that we are not headed to emergency rates any time soon. Though it was also predictable to hear President Elect Donald Trump say that if he could fire him he would, be he can’t, so he won’t - somethings are predictable when it comes to investing.
What was a surprise was 10 year US Treasury Bonds, who despite experiencing a pop of the day of the US election, actually finished the week down. Again, a reminder to not read too much into political events and their impact on our market. Its simply a nice a nice to know and part of the overall picture.
So while the election result may have an impact at some point in the future, it is not this week as the chart looks exceptionally healthy. So I am sill looking for the index to fall below 5408 before I can provide any more guidance. That said, another strong week like this (or even just a positive one) and I will have to raise that level higher again!
AUS S&P/ASX200
On the day the US election was won, here in Australia our market was a little mixed. Though it has to be said we felt a bit of the “Trump Bump” as the S&P/ASX200 was positive for the week by 2.2% and though is not too far from intra-week high levels, it is important to note that the close of Friday for the broader index was indeed and all-time high for the index..

Given how insignificant we are in the scheme of things, this was a very strong weekly rally. It is important to remember that the US only accounts for about 7 per cent of Australia's GDP and therefore what happens there has a minimal effect.
What is likely to have a larger impact is whether protectionist policies impact our largest contributor to GDP in China (about 39%) and the second largest economy in the world. As previously mentioned there is no need to predict anything just yet. Just keep an eye out.
Talks last week of a 60% tariff imposed on Chinese Goods, means that it will likely need an economic bazooka to help it stay on the straight and narrow. The extra stimulus announced for local councils late on Friday was definitely not enough and I feel that for this to get up and have the desired affect then a large amount of stimulus will be needed to help support the index. The short term impacts of this disappointment was definitely felt in Iron Ore trade in Singapore, and in the price of oil. Both fell in response to the delivery of this mooted action. Though in the case of oil it will likely finish up for the week.
Gold miners also took a bit of a hit as the commodity prices has fallen a bit from all-time record highs. This is a direct response to the price of Gold falling as the US dollar has strengthened since the election win. You need to understand the impact of this and currency moves if you have any gold miner in your portfolio.
That said, while the size of the lists below did increase, perhaps some investors would have been hoping by more. At this point I remind investors of the heavy influence Gold miners have on our market. The gold price fall either stopped new additions getting added or saw some miners fall out of favour. Hence the need to look at each chart individually.
At this point I don’t really know what else to say. We are at weekly highs and positivity abound both in the chart and the chit-chat. I still see no need to change my aggressive stance on Aussie stocks until we cross below 7547 as an absolute bare minimum.
I said the market was behaving normally and I meant it. If you can block out the nose, you too can enjoy the good times being shared by all.
Member corner
In this section we will provide a detailed chart assessment, on a maximum of ten stocks weekly, on companies from those of you in the Gallery.
We welcome stock requests to be analysed from members. We will also be looking at the charts of some of the more actively researched stocks for the week. We will try to rotate through a selection so as to not make the charts stale, however we will likely not cover a stock within 2 months of when it was last discussed.
If you want to see what has been written about a stock recently, go to the discussion area.

We will not be making up suggestions. If there are no changes to the most viewed list and/or there are no suggestions from members, then no stocks will be covered.
To learn of the methods used to analyse companies in this section, refer to my Momentum Journey series that I articulate here in three parts.
They will help provide context on what I am writing about and the editorial angle of this report.
Also look at the market capitalisation and liquidity before making any decisions!
And again, if you have a stock you would like analysed from a momentum perspective, please write it into the comments section below or email us at support@stockopedia.com.au
IF NO ONE ASKS… HOW AM I SUPPOSED TO KNOW?!?
ASX:MIN Mineral Resources Limited
StockRank 46
Momentum Rank 12
QM Rank 43
VM Rank 21
A$38.47
Just crossing the two month threshold was Mineral Resources (ASX:MIN) who commanded major headlines as its founder and major shareholder Chris Ellioson was found to have changed some related businesses too much for services and had a tax vehicle on the Virgin Islands.

ASX:MIN 1 year Daily chart
One cannot imagine my faux horror at the revelation that a Billionaire would do this and the Board has come down with punitive measures and fines on Mr Ellison, but they let him keep his job and his paypacket. In fact the initial part is the only difference to the outcome here and what fellow Billionaire Richard White faced at WTC.
All that of course does not matter and the stock has been discussed from a momentum perspective here. At the time I said, “nothing screams buy for now” and I pointed to the long term down trend of the stock to support that view.
In the short term it did bounce a bit. But as you can see that support/resistance at $52.55 created by the lower low at the start of this year has become quite powerful now that the price ‘just’ crossed above it (but quickly failed). Pleasingly the low of late October was higher than the September, so technically that is a higher low and a level I will be watching from a short-term perspective (at least I won’t have to wait long to know if I am wrong.). It has to cross back above $52.55-$53.35 to have a chance of returning to a positive short term trend.
As a price taker though, the price of Iron Ore, Lithium and Nickel will play a big role here.
ASX:SRG SRG Global Limited
StockRank 99
Momentum Rank 98
QM Rank 99
VM Rank 97
A$1.16
In that same edition I also talked about SRG Global (ASX:SRG) from a Momentum perspective. At the time I mentioned by positive disposition on the chart and that hasn’t changed.

The upside target of $1.70 still stands. It never hit my stop loss, and now that would be raised to $1.02.
If I was looking for a trade supported by a strong structural run up, maybe I would look at above $1.185 before I got in. But I am still in this trade.
ASX:MAH McMahon Holdings Limited
StockRank 99
Momentum Rank 96
QM Rank 99
VM Rank 98
A$0.375
In a similar industry is Macmahon Holdings (ASX:MAH) and it was discussed back in August from a Momentum perspective that you can read here
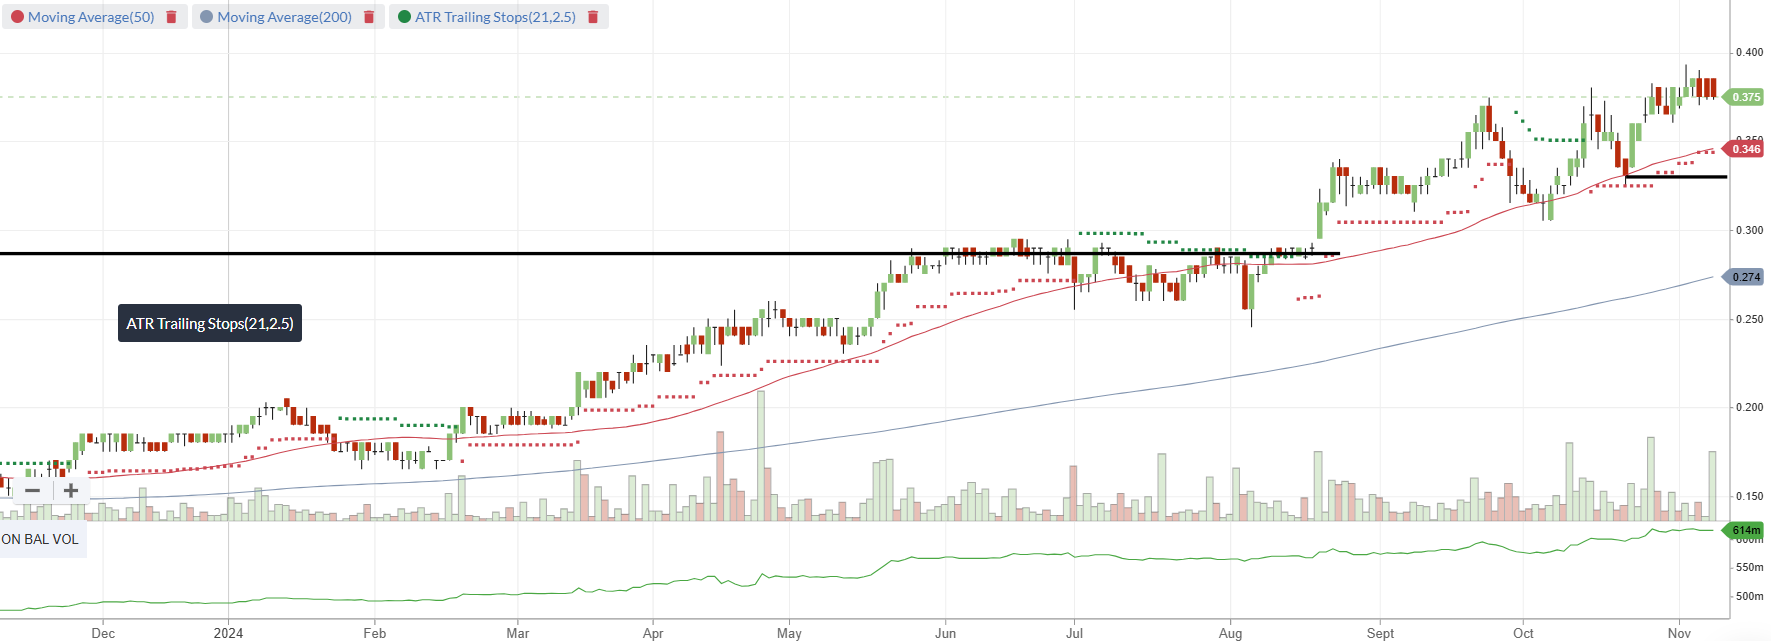
ASX:MAH 1 year Daily chart
At the time I said that I felt a stop loss level of $0.285 would be appropriate, and it hasn’t breached that level. I also mentioned that there was quite a bit of clear air ahead of the price and it has kept going up.
So I remain positive on the chart for now until the price crosses back below 33 cents. All my previous comments on the sector remain.
Stocks in the Shine Zone
To learn about the Shine Zone and how to use it, you can read it here.
The rules for inclusion in this list are based on those I like to see in a stock before considering a trade in it:
QM Rank above 80
Price is above the 2.5x ATR
50d MA is above the 200d MA
Price is greater than the 200d MA
Market cap greater than $200M
This is a very important point: the “Shine Zone” are rules for possible buying. They are not for holding and/or selling. If a stock falls out of the shine zone, use support levels to set your stops, or instigate a parachute stop if necessary. With markets moving sideways, one expects frequent changes in these lists.
If you feel there is a stock that should be included but is missing please let us know. This is a manual process and occasionally one gets through the cracks
Also look at the market capitalisation and liquidity before making any decisions!
Data is at 09 November and is sorted by the stock code.
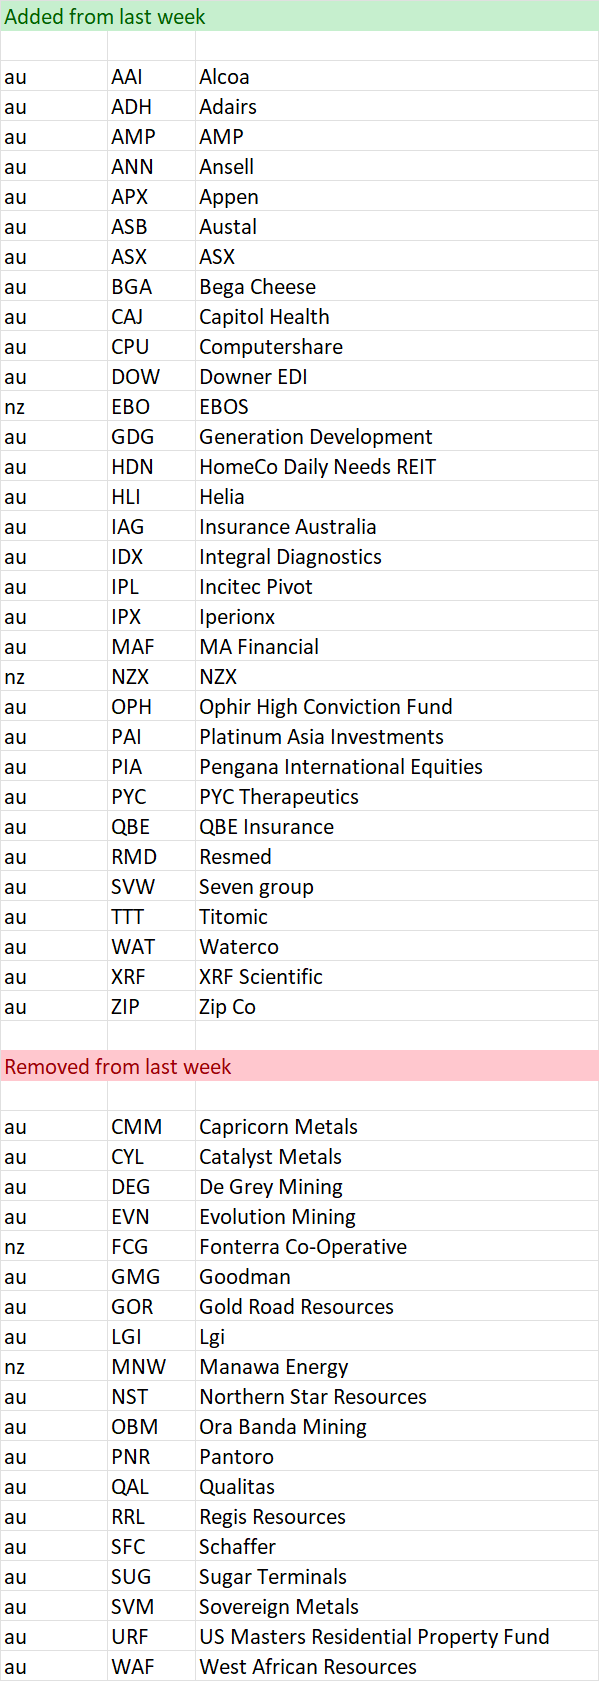
Changes from last week
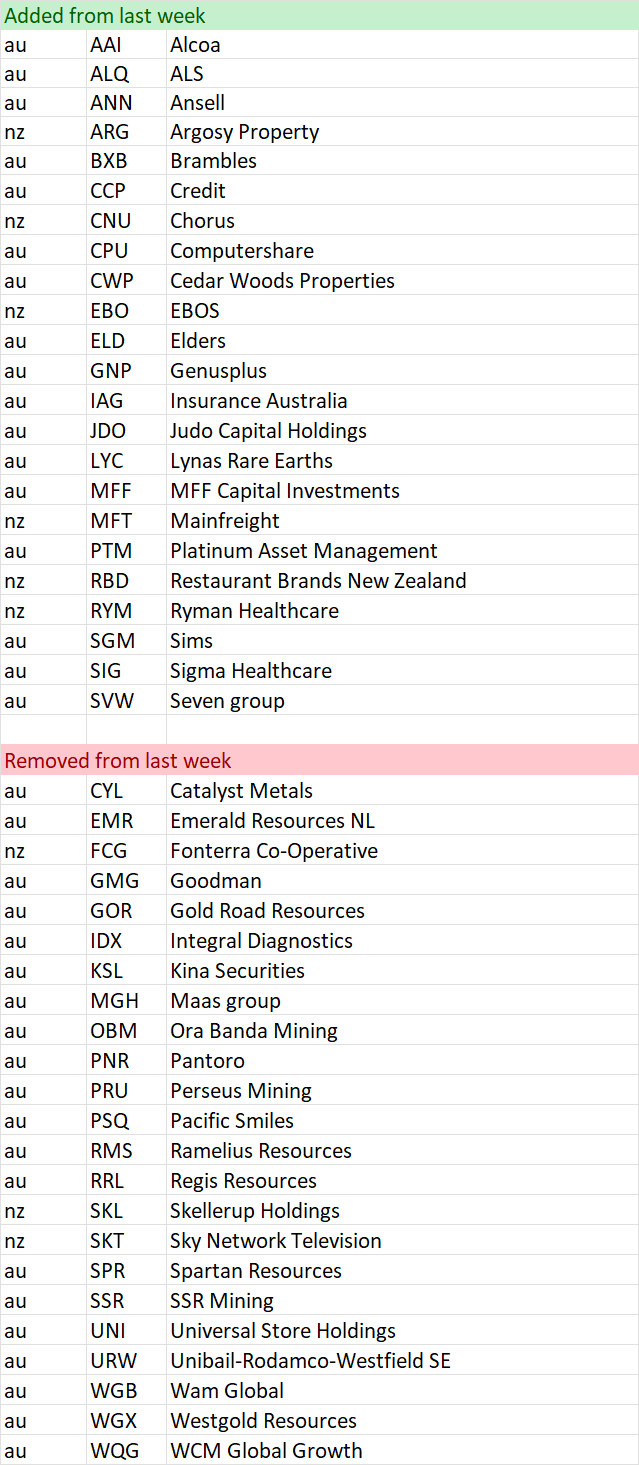
Shine Zone list as at 09 November

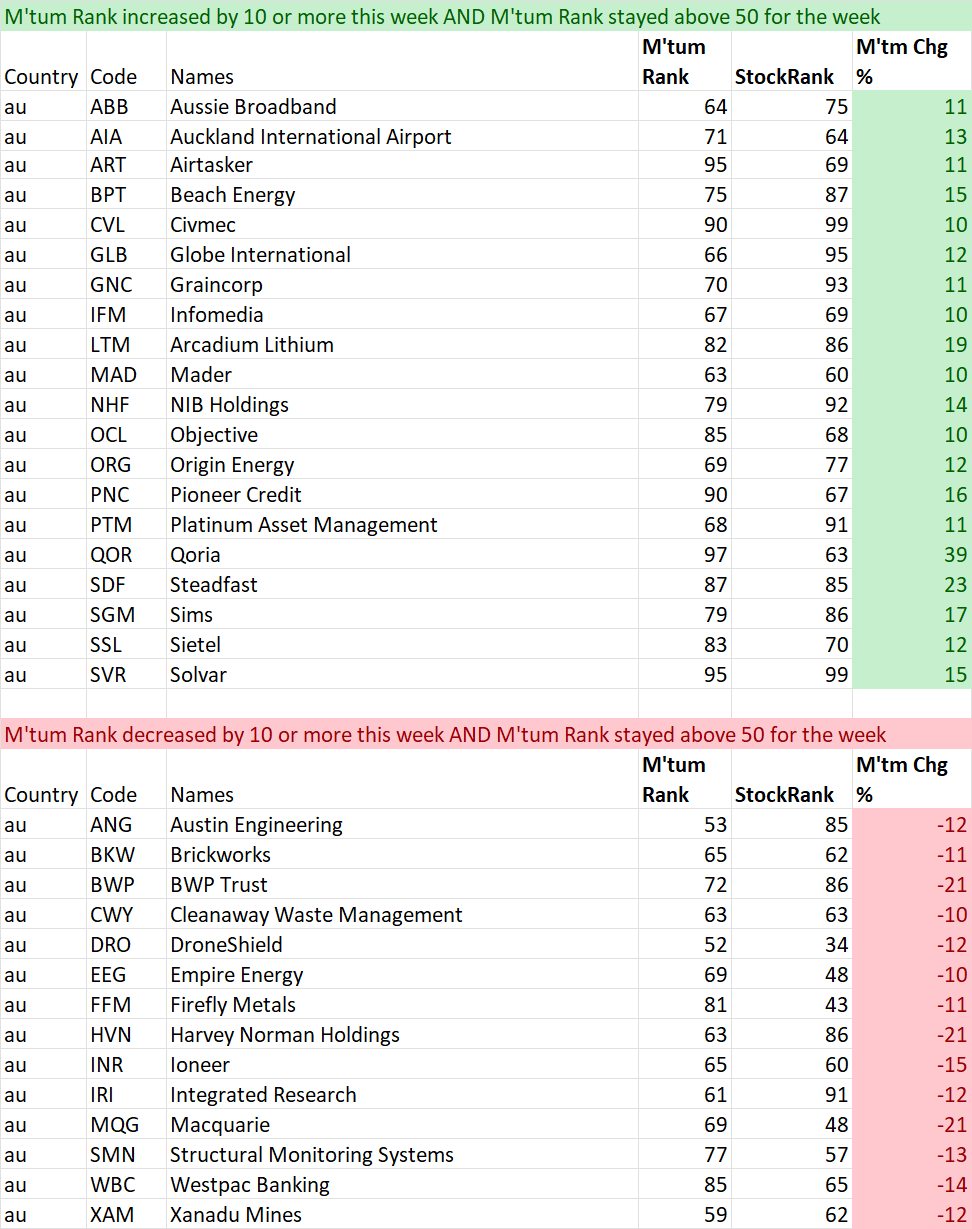
Momentum Movers
I have actually published an article discussing my thinking with these tables. You can read about it here.
In summary, there is a school of thought that the change in something is just as important as the absolute number itself. Momentum is our most volatile ranking. This section is intended to bring to readers attention the big moves from a Momentum Perspective. As with other lists this is not designed to be a list of stocks that are replicated. Rather it can be a starting point of investigation for further consideration. Initially it will record weekly changes. This will include a monthly change when enough time has elapsed. This section is divided into two lists.
First is a list of stocks that have just crossed above 50 from a Momentum perspective. By definition, these will be stocks that have improved over the past week and month and may warrant further investigation. As a bare minimum a look at liquidity and market cap.
The second list measures all stocks that are currently ranked above 50, have remained above 50 during the time periods analysed (ie not just added or removed) AND whether they have improved or worsened by more than 10 points on the Momentum Rank.
With all filters a minimum market cap of $50 Mil has been included to help ensure investability from a small perspective. Be sure to check liquidity relative to your preferences.
Note: Some of the changes are due to the market cap now rising above $50M. Be sure to double check.
Data is on 09 November and is sorted by their code.
And remember, past performance is no guarantee of future performance.
Weekly Tables (the past week)
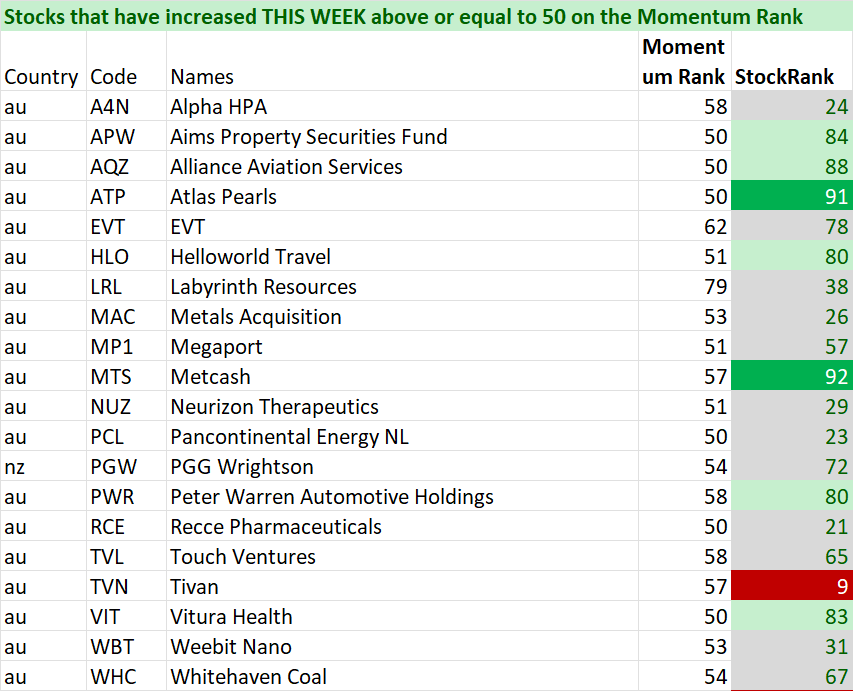
52 week high screen
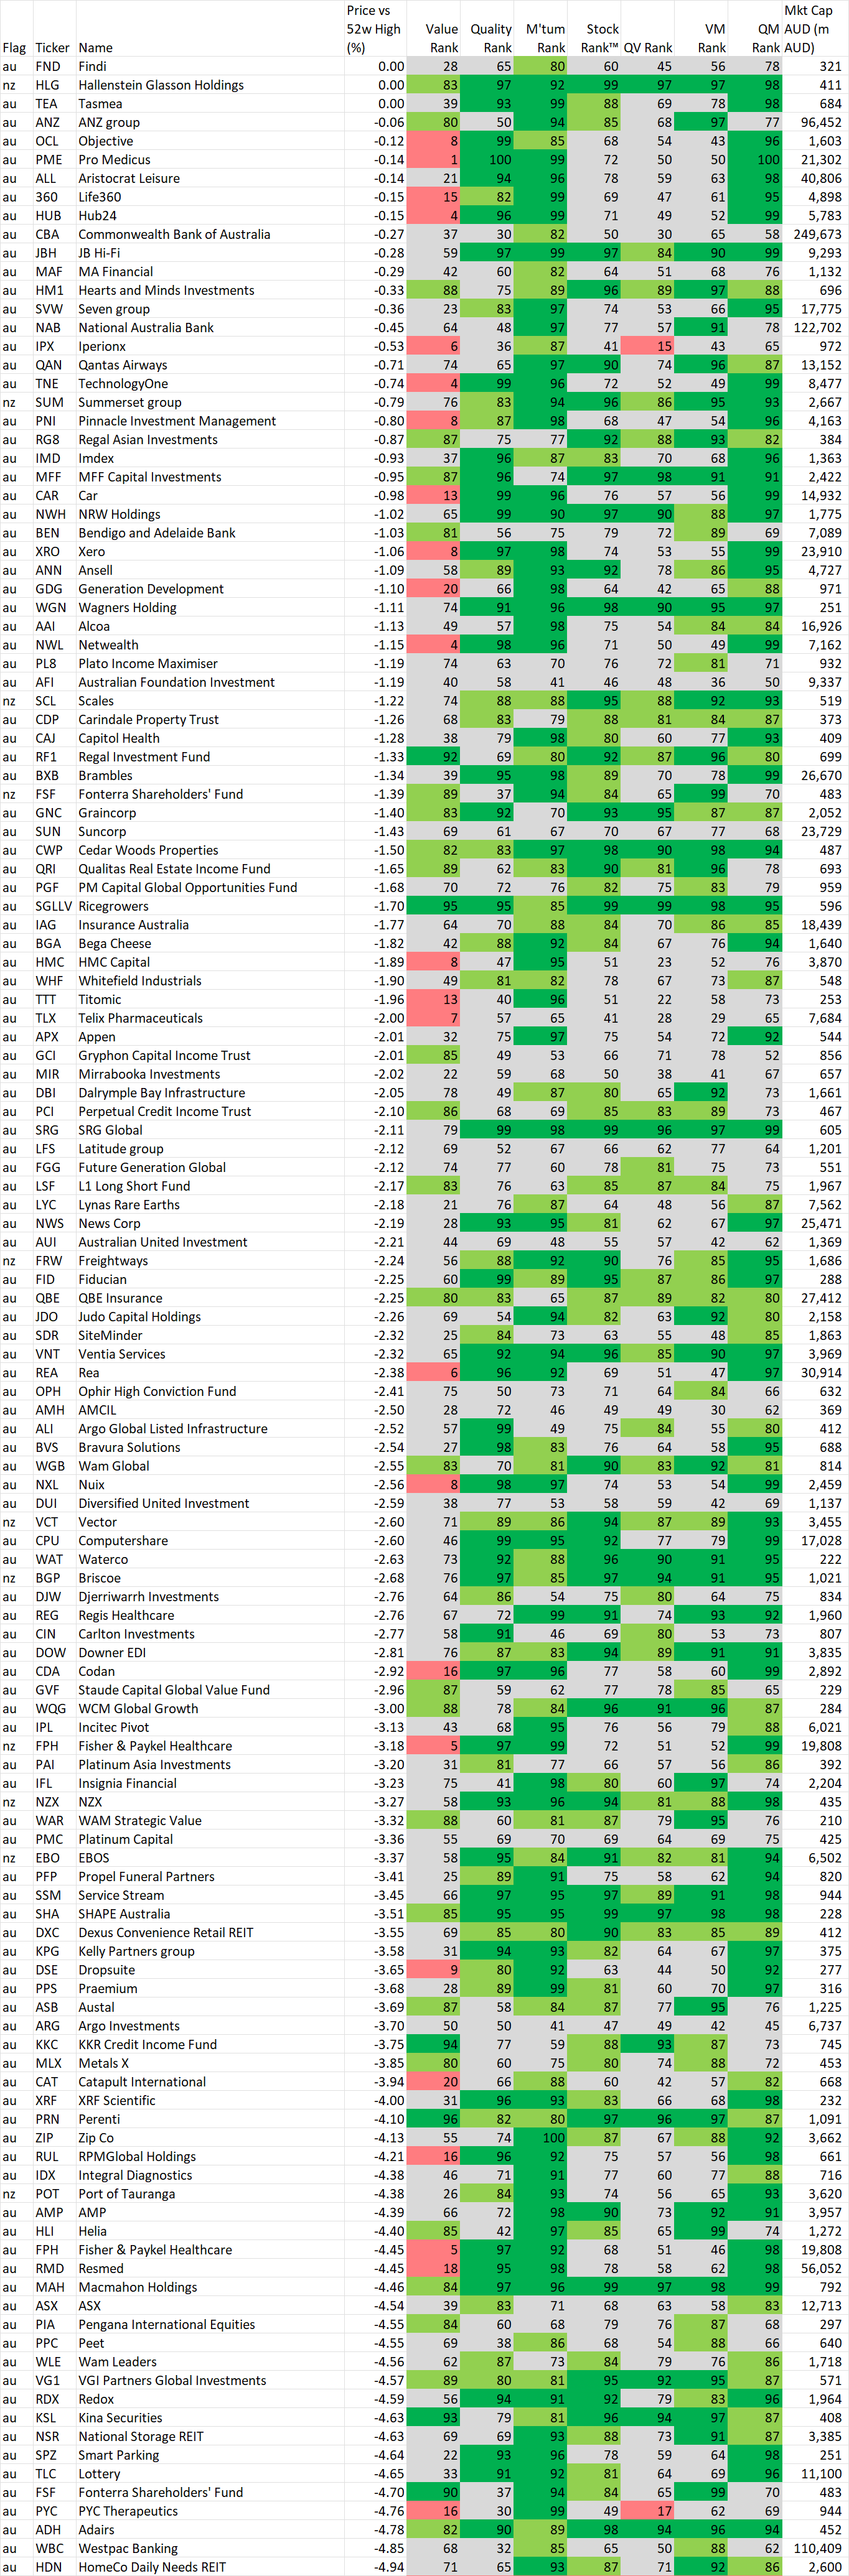
In this section we identify stocks within 5% of their 52 week intraday high based on the idea, supported by academic studies, that stocks close to their 52 week highs tend to outperform. Weekly changes to the list will also be noted.
If you wish to recreate this screen in the screener select "Price vs 52 high" greater than -5% and Mkt Cap greater than $200M
A stock coming onto the list is NOT an automatic buy, just as a stock that leaves the list is NOT an automatic sell. As with the shine list, assess every chart on its merits. However movements on this list may alert you to interesting charts so be sure to look at Stockopedia and the chart first.
Data is at 09 November and is sorted by the stocks closest to their 52 week intraday high.
Also look at the market capitalisation and liquidity before making any decisions!
And remember, past performance is no guarantee of future performance.
Changes from last week
Stocks within 5% of their 52 week high as at 09 November
Important Information: Stockopedia Ltd ABN 39 757 874 670 UK business registration number 0637267 (“Stockopedia”) is an Authorised Representative of Daylight Financial Group Pty Ltd ABN 77 633 984 773 (“DFGPL”) which is the holder of an Australian Financial Services Licence (AFS Licence No. 521404).
Information in this commentary is current as at date prepared unless otherwise stated. However, please bear in mind that investments can go up or down in value, and that past performance is not a reliable indicator of future performance. For more Important Information please refer to the Disclaimer section of this website.
This communication may contain general financial product advice. It has been prepared without taking into account your personal circumstances, and you should therefore consider its appropriateness in light of your objectives, financial circumstances and needs before acting on it.
If our advice relates to the acquisition or possible acquisition of a particular financial product, you should obtain a copy of and consider the Product Disclosure Statement (PDS) before making any decision.
The author holds direct interests in MIN, SRG and companies listed in the data tables . This position can and will change at any time without notice.
Disclaimer
This is not financial advice. Our content is intended to be used and must be used for information and education purposes only. Please read our disclaimer and terms and conditions to understand our obligations.
1 comment
Last time (April) you covered XRF Scientific (ASX:XRF) you concluded that $1.40 was your upside target (price then of $1.19). This is now way in the rear view mirror and I am now getting that dangerously confident feeling that this going to be a good stock for a long time yet. Some of your realism may be necessary!