Momentum Monday 11th September

Welcome to Momentum Monday.
Last week we held our Friday Lunch ‘ Learn webinar which covered in depth the Reporting season. If you haven’t watched the webinar as of yet here is a link to the recording
Within the webinar, we talked Factor moves and individual stocks. It was action packed so be sure to watch it as I hope it will add to your knowledge bank.
A copy of the ASX Factor report is also available here
Further, for those of you who listen to my daily market wraps on Apps, either directly through ABC Melbourne, or alternatively on our various social channels or podcast provider, note that from next week, the “end of day wrap” will become a “at the opening bell” wrap due to a change with the ABC radio line-up. If you want to listen, but don’t have access to social media or prefer no to listen to ABC Melbourne, then follow the podcast channel here. It should be free to access.
The content for this week's edition is as always:
Broader market sentiment
Member corner
Stocks in the “Shine Zone” (including changes)
52 week high screen (including changes)
We are always open to suggestions on how to make this contribution better, so if you have any, please feel free to write them in the comments below. All comments to date have been noted so thank you.
A reminder that you don’t have to read all this contribution. Simply scroll to the area of interest.
Broader Market Sentiment
We look at the direction of both the US and ASX markets to gain an understanding of the broader sentiment at the minute. It is important to stress here that I DO NOT use this to time my entry or exit out of stocks. I prefer to use the individual charts of stocks to do that. However I find it useful in helping us determine how aggressive/cautious traders should be in their trading. In short the more positive the broader market is the more risks you can take and vice versa.
US / S&P500
Despite Friday’s green day, it wasn’t enough for the S&P500 to have a small pullback. Down 1.3% on the week.
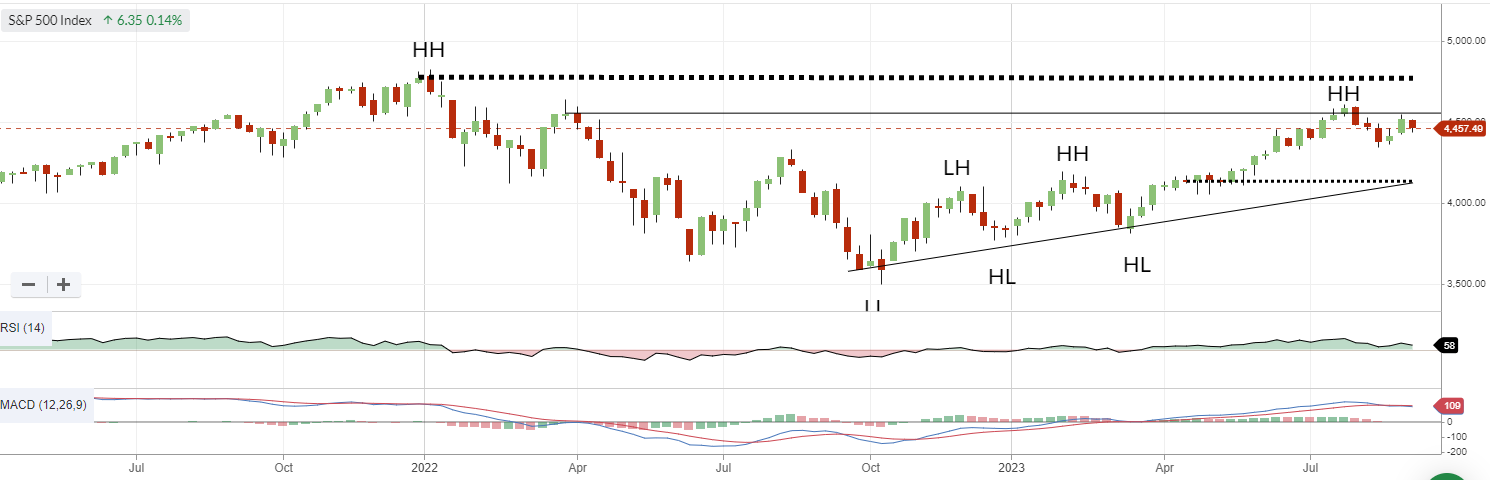
S&P500 Weekly chart
This is not overly concerning as of yet and the index remains in a short-term upward trend. Further, both the RSI and MACD on the weekly charts remain in positive territory, though it is interesting to see the moving average lines on the MACD converging and remain tied together for a month now. I suppose if you are going to go sideways, do so in a general upward direction.

Not much to report from a macro/sentiment basis. Jobless figures at the start of the week were strong, adding fears that the Fed may increase rates again. That said, the economy is doing just fine at the moment, so the media is clutching at straws.
Some of the big IT stocks had a mild pullback. Much of that due to Apple who saw its stock price falls as news filtered in that China had banned the use of the iPhone by government employees. While in of itself not expected to hurt the bottom line, some hypothesise that this could be the start of something bigger. Hopefully the coming Tuesday (Wednesday our time) Apple launch of a new iPhone and Watch arrests that trend.
An interesting aside is with strength returning to the labour market in recent years, a “Summer of Strikes” has been occurring America. The latest large scale threat is the United Auto Workers union who has voted to authorize a walkout of about 150,000 members at General Motors, Ford Motor and Stellantis if negotiations fail before contracts expire on Sept. 14. This would result in this year seeing over 450,000 walk off the job, the highest rate since 2018. If they surpass that level, it then been the highest since 1986. Despite the overall weakening of the union moment indecent decades, I suspect more will come as inflation has woken the employee demands for their wages to keep up.
AUS S&P/ASX200
Grind… whether it is your teeth or the market, it is never a pleasant activity. Last week saw Tuesday through to Friday deliver consecutive negative days and we are back right in the middle of our symmetrical triangle

S&P/ASX Weekly chart
Just a reminder, a breakout either way will not change sentiment, however we do need to be wary of them as breakouts either way can be quite volatile. The tension is thick, you can cut it with a knife at the moment.
Last week I had ‘hoped’ the pop would stick, but it hasn’t. With a lack of support from the S&P500 during our trading week, our market appears quite nervous about the idea of taking its own bold steps.
Pleasingly we closed above the low from two weeks ago, therefore despite how frustrating last week was to witness, we are still technically headed in the right direction.
So the market remains stagnant and will continue to have its frustrations. The down week saw more stocks fall out of the shine zone and less appear within 5% of their 52 week highs. Though given the current general direction, we remain invested in stocks. Support remains in the 6995 and 7038 range.
Member corner
In this section we will provide a detailed chart assessment, on a maximum of ten stocks weekly, on companies from those of you in the Gallery.
If no one asks for a stock to be analysed, this section will remain blank.
Also please note, that while we may receive a number more queries than ten per week, we retain the right to save a stock for another week, or ignore it all together.
To learn of the methods used to analyse companies in this section, refer to my Momentum Journey series that I articulate here in three parts.
They will help provide context on what I am writing about and the editorial angle of this report.
If you have a stock you would like analysed from a momentum perspective, please write it into the comments section below or email us at @stockopedia.com.au">support@stockopedia.com.au
ASX:SXE Southern Cross Electrical Engineering
StockRank 99
Momentum Rank 95
QM Rank 98
VM Rank 99
A$0.78
Last week I spoke of ACF and if investors had diligently been using screens, that they would be aware of the business. Today we cover another one in Southern Cross Electrical Engineering (ASX:SXE)

ASX:SXE 1 year Daily chart
We last spoke of SXE back in January. We noted its undeniable quality, though we are a little cautious on liquidity. Pleasingly, it has a strong institutional investor on board in Thorney Group who have over 16% interest and Colonial with over 9%. Founder Gianfranco (Frank) Tomasi who now sits on the board in a non-Executive role is still the largest shareholder.

Back in January I mentioned that a break above 73 cents would be positive. It failed to achieve that. Fast forward 8 months and it finally did it in late August and subsequently popped. So patience is a virtue.
The price for the minute is doing exactly what it needs to do after such an aggressive run. It needs to pause, pullback and hopefully then go on another run (or we get stopped out.
Where would that potential buy zone be now? Likely around $0.755 to $0.76 cents. It may even get as low as $0.73 which was the previous resistance level I spoke of, which now becomes support. I would look to have a stop loss at $0.67 cents as that would see the price fall below both the 200d moving average and below the recent short-term higher high.
However given SXE’s undeniable qualities that they have, investors will hope they are finally being acknowledged by others, that would also help with liquidity. I will finish though on the same point of caution I raised back in January that technical analysis is not as reliable on illiquid stocks as it is on highly liquid stocks. This is because massive shifts in sentiment can be caused by one opinion changing. For example, should Thorney one day decide to cash in $2M worth of stock on market, no bullish pattern is going to save that price from going down. Therefore fundamentals are required when assessing illiquid microcaps alongside a long term view. In the case of SXE they look solid following their record profit result recently.
ASX:KLS - Kelsian
StockRank 58
Momentum Rank 72
QM Rank 69
VM Rank 57
A$6.33
Kelsian (ASX:KLS) has been spoken about a number of times in the past. From a momentum perspective it was covered in a Momentum Monday article back in February

ASX:KLS 1 year Daily chart
At the time we mentioned, “Put simply, the price has to break above $6.12. If it does so there is a chance it can get to the previous lower high level of $6.52 and if it can breach that, the target next becomes $8.05.”
So what happened. Price broke $6.12 and $6.52 however while on its way to $8.05 it has stumbled. The company did not have a particularly good annual report and that resulted in all the Factor scores experiencing pullbacks.

The main culprit was the acquisition of the All Aboard America! Holdings Inc which was completed in the last month of the financial year. From a quality and value perspective this has the effect of bringing on board a large amount of assets and debt without 12 months of earnings to support them. Looking at the acquisition itself, more than half was funded by debt with the remainder through an equity raise and existing cash reserves.
But ignoring all that, the price broke below support at $6.52 so now is not an ideal to acquire based on the chart. For those that believe and/or hold hopes that the price will get to the $8.05 target then the price fall must stop and price now needs to stay above $5.55 - $5.65 otherwise some big downside targets remain in play.
For those keen to take an interest, they could wait for more of a pullback towards support and then consider an entry because “you won’t have to wait long to know if you are wrong”
At least from a midterm perspective the price looks like it is still on the path to recovery . The key will be to ensure this latest pullback creates a new higher low, which could provide a platform to getting back to all-time highs.

ASX:KLS 3 year Weekly chart
ASX:SSM - Service Stream
StockRank 95
Momentum Rank 85
QM Rank 96
VM Rank 88
A$0.885
Service Stream (ASX:SSM) was a company that benefited significantly from the original NBN rollout. The stock peaked with an intraday high in August 2019. Long story short, as the work dried up, so did the price. And it has a lot of work to do to get back to those levels.

ASX:SSM 1 year Daily chart
But there are some positive signs. First, after such a prolonged pullback it is great to see the 50/200d moving averages moving in the right direction. After basing for a period of 12 months, the recent run which started in June has created a new short-term higher which supported by a rising ONV measure and now the price is above the 2.5x ATR.
But I mentioned the stock has some work to do. First, the most recent high has been tested twice which makes it a significant level. Therefore before considering a position, I feel we need a break above $0.92 to create a new higher high. This if it fails to breach $0.92 is that there is a double top forming. This reversal signal would see a downward target of at least $0.72.
Let’s say that $0.92 is breached. You would expect a pullback eventually,though the next upside target is $1.07 which coincides with the lower highs formed in March and July last year, that too being a significant level.

ASX:SSM 2 year Daily chart
Beyond that $1.66 will be next which coincides with the collapse in Feb 2021. Only above that level with some clever air start to be breathed. We need to remember that everyone that bought the stock from then to August 2022 is in the red. So if prices get back to those levels I believe there will be a lot of selling pressure, especially given there have been a number of capital raising over that time.

ASX:SSM 5 year Weekly chart
All in all, the recent action looks promising, though this still has a lot of work to do and traders would need to be prepared to grind it out (unless of course some fundamental news changes the game - hopefully it is positive.)
Stocks in the Shine Zone
To learn about the Shine Zone and how to use it, you can read it here.
The rules for inclusion in this list are based on those I like to see in a stock before considering a trade in it:
QM Rank above 80
Price is above the 2.5x ATR
50d MA is above the 200d MA
Price is greater than the 200d MA
Market cap greater than $200M
This is a very important point: the “Shine Zone” are rules for possible buying. They are not for holding and/or selling. If a stock falls out of the shine zone, use support levels to set your stops, or instigate a parachute stop if necessary. With markets moving sideways, one expects frequent changes in these lists.
Read the “how to” article above to learn more
If you feel there is a stock that should be included but is missing please let us know. This is a manual process and occasionally one gets through the cracks eg PDN last week (sorry).
Data is at 09 September and is sorted by the stock code.
Changes from last week

Shine Zone list as at 09 September

52 week high screen
In this section we identify stocks within 5% of their 52 week intraday high based on the idea, supported by academic studies, that stocks close to their 52 week highs tend to outperform. Weekly changes to the list will also be noted.
If you wish to recreate this screen in the screener select "Price vs 52 high" greater than -5% and Mkt Cap greater than $200M
A stock coming onto the list is NOT an automatic buy, just as a stock that leaves the list is NOT an automatic sell. As with the shine list, assess every chart on its merits. However movements on this list may alert you to interesting charts so be sure to look at Stockopedia and the chart first.
Data is at 09 September and is sorted by the stocks closest to their 52 week intraday high.
And remember, past performance is no guarantee of future performance.
Changes from last week

Stocks within 5% of their 52 week high as at September 09, 2023

_____________
Important Information: Stockopedia Ltd ABN 39 757 874 670 UK business registration number 0637267 (“Stockopedia”) is an Authorised Representative of Daylight Financial Group Pty Ltd ABN 77 633 984 773 (“DFGPL”) which is the holder of an Australian Financial Services Licence (AFS Licence No. 521404).
Information in this commentary is current as at date prepared unless otherwise stated. However, please bear in mind that investments can go up or down in value, and that past performance is not a reliable indicator of future performance. For more Important Information please refer to the Disclaimer section of this website.
This communication may contain general financial product advice. It has been prepared without taking into account your personal circumstances, and you should therefore consider its appropriateness in light of your objectives, financial circumstances and needs before acting on it.
If our advice relates to the acquisition or possible acquisition of a particular financial product, you should obtain a copy of and consider the Product Disclosure Statement (PDS) before making any decision.
The author holds interests in companies listed in the data tables . This position can and will change at any time without notice.
Disclaimer
This is not financial advice. Our content is intended to be used and must be used for information and education purposes only. Please read our disclaimer and terms and conditions to understand our obligations.
1 comment
Thanks Elio, appreciate it. Would be interested in your views on GUD Holdings (ASX:GUD) and SiteMinder (ASX:SDR)